

This article will help us to understand how to monitor Azure SQL Database and set up Azure metric alerts. Even though the database in Azure SQL Database is fully managed by Microsoft, we are still responsible for proper database access and performance. Azure does make it easy for us and it can alert on critical database metrics that are automatically tracked by the system. The metrics tracked by Azure can be subdivided into three categories, connectivity related metrics, performance related metrics and database related metrics.
For performance, Azure can alert you on many different conditions. For example, are you are close to the capacity (percentage wise) of your DTUs, what is your DTU limit at any point in time, how many DTUs are you using (not as a percentage but as an actual absolute number), how much CPU percentage are you consuming, how much log IO percentage you're are consuming, and data IO percentage. In terms of database metrics, you can get alerted if deadlocks are happening on your database. You can get alerted based on your total database size, such as if it's growing past a certain amount that you are not comfortable with. You can also get alerted on the percentage of your database size instead of the absolute value.
Defining alerts on Azure is a very straightforward process. First, connect to the Azure portal and search for the database where alerts need to be configured. In this example we will look for the AdventureWorks database. Once we are on the database blade, on the left hand panel, scroll down and find the monitoring section. Under this it will say Alert rules and the Database size as shown in Fig 1.
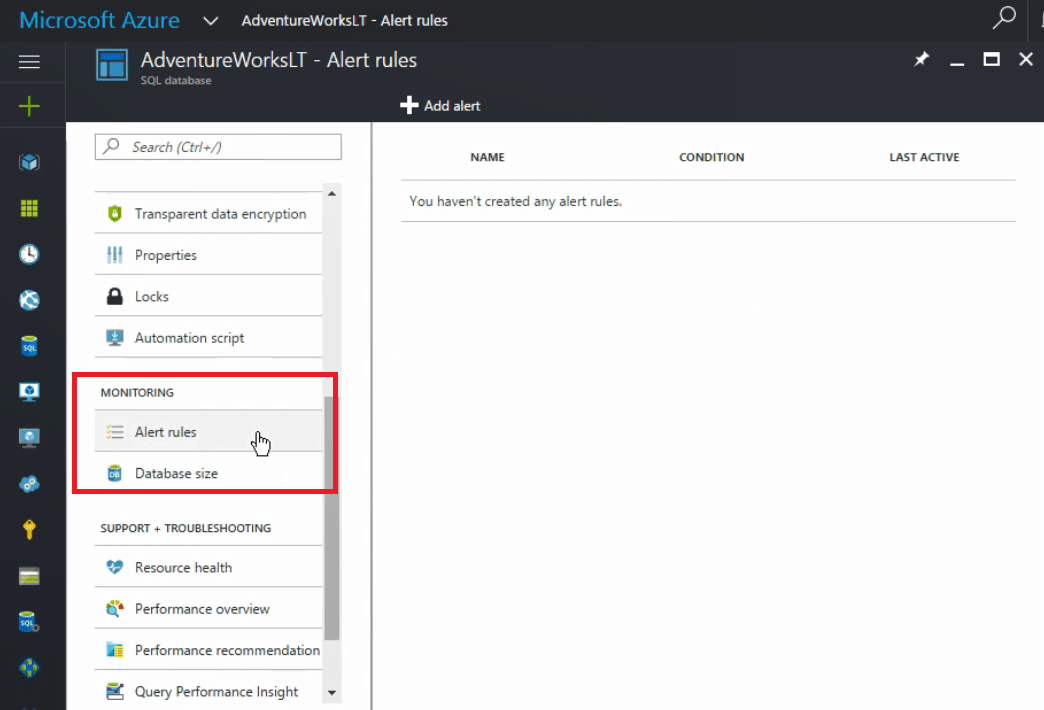 Fig 1
Fig 1
At this point we can see that we haven't created any alert rules for this particular database. We'll just click on Add alert, and we get an alert rule blade as shown in Fig 2.
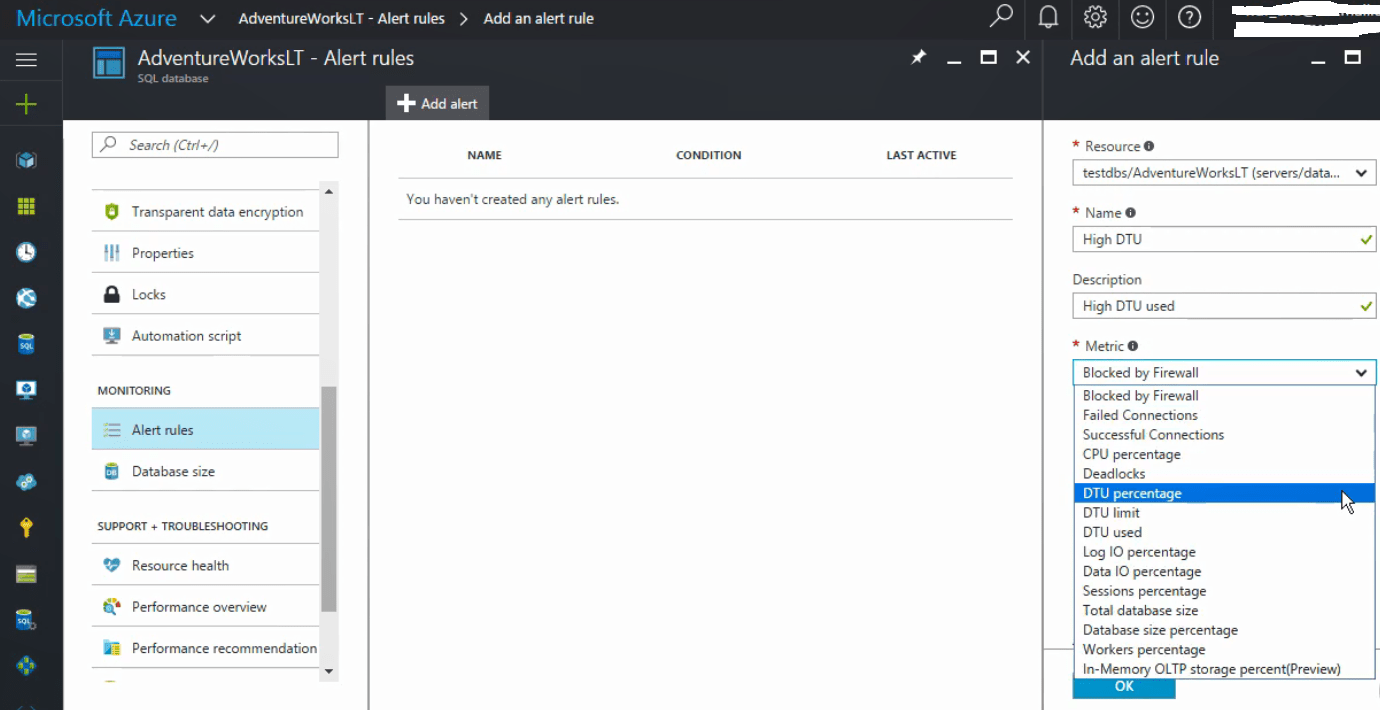
Now we can give a name to the alert, in this case we're going to call it High DTU. If we want we can give it a description, High DTU used, and now we can pick the metric. We can open the drop down and see here we have DTU percentage, which is the metric that we want to use for this alert. Click on that one as shown in Fig 3.
Scroll down, we can see the condition we want to pick, greater than, greater than or equal, less than, less than or equal. In this case what we want is greater than or equal to. The threshold we're going to pick, let's say 85% of our DTUs consumed because that means that we're really close to capacity. For the period we have the option of making it over the last 5 minutes all the way to over the last hour. For proper performance monitoring, you can select the smallest period, which is 5 minutes as shown in Fig 4.
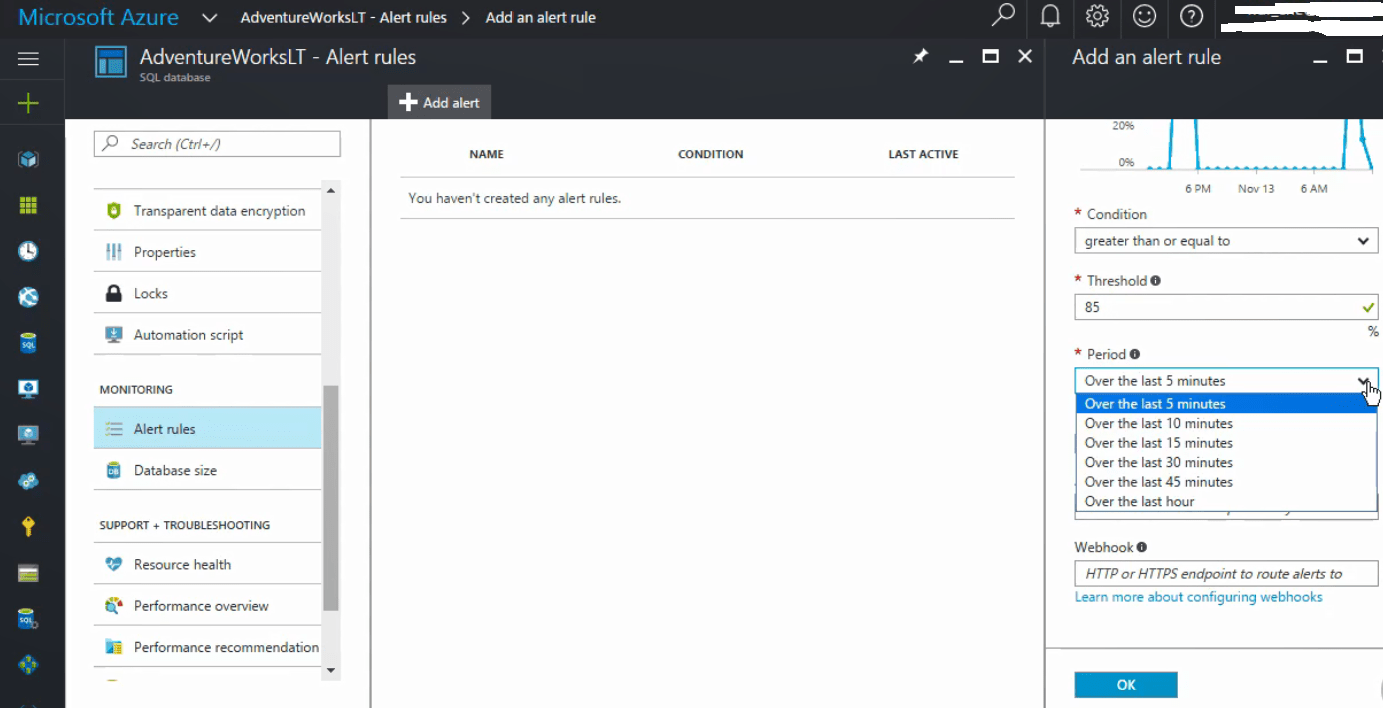 Fig 4
Fig 4
At this point you can either say that you want to email owners, contributors, and readers, which are the roles that you can assign to this Azure resource, or you can also use additional administrator emails and you can set a custom list here. If so desired, you can also use the web hook capability of Azure, which basically will send the notification to an HTTP or HTTPS endpoint. In this case we will just select email owners, contributors, and readers and press OK as shown in Fig 5.
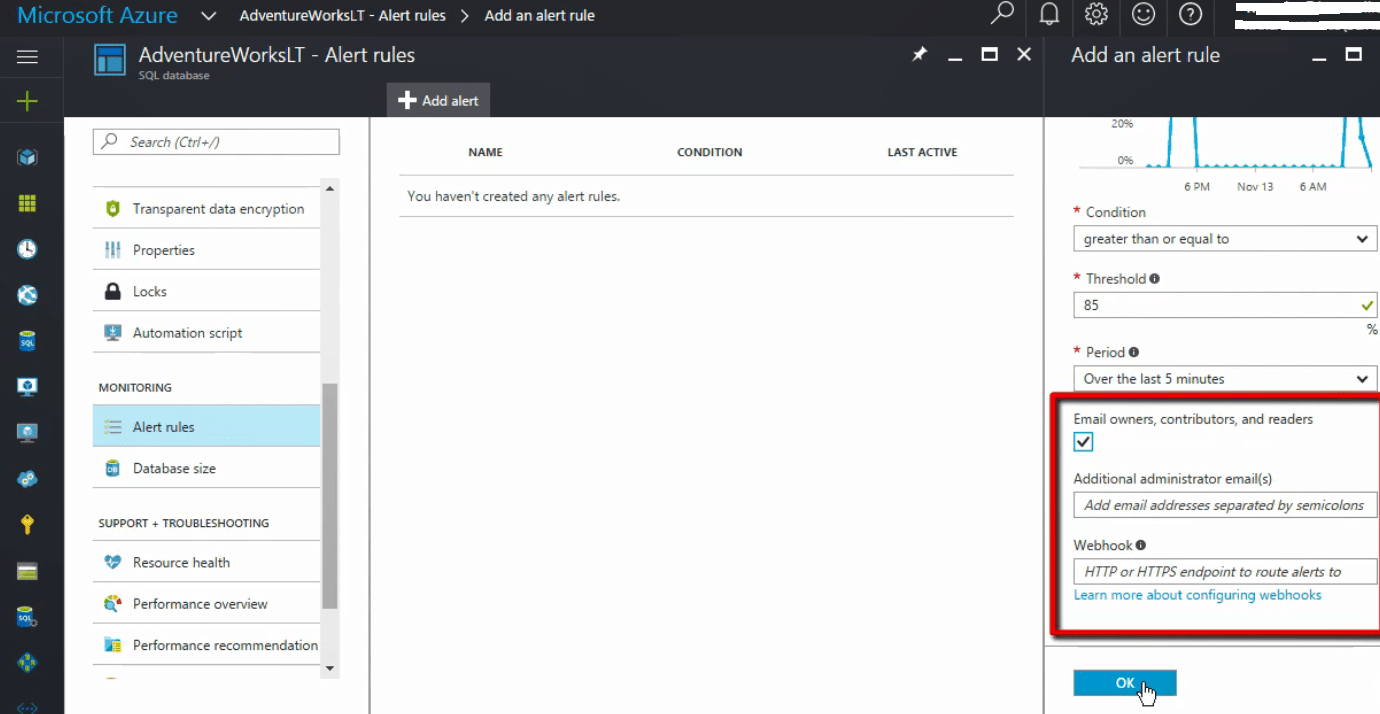 Fig 5
Fig 5
Azure at this point has successfully added the alert and in the situation that the DTU percentage goes over 85% in a 5 minute period, we are going to get an alert as shown in Fig 6.
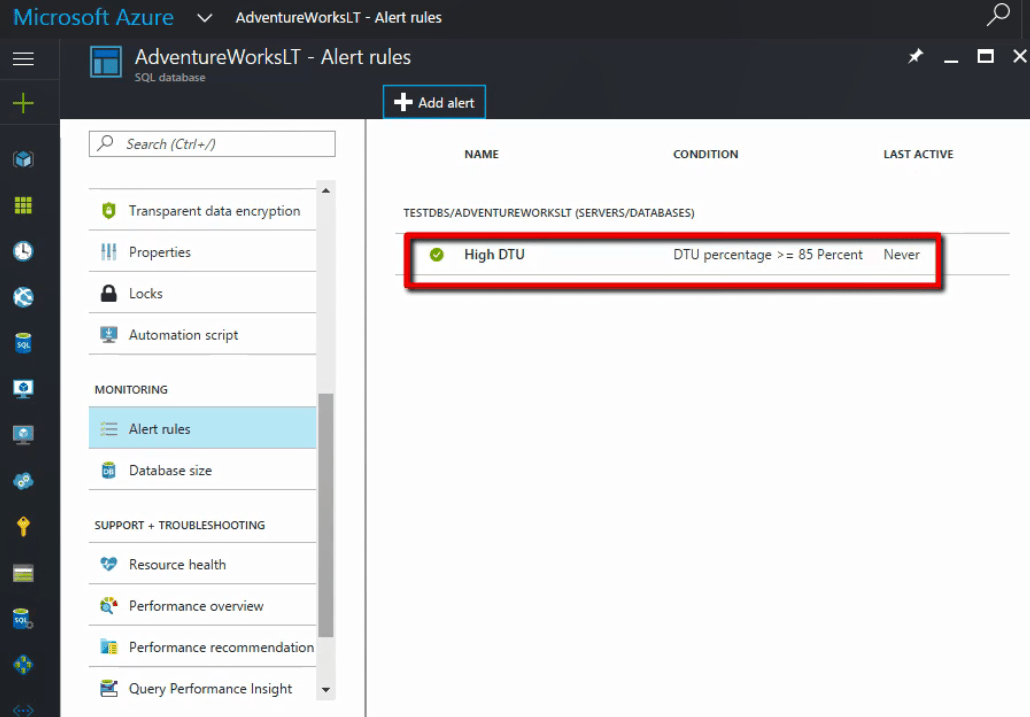 Fig 6
Fig 6
Summary
Azure does make it easy for you and it can alert you on critical database metrics that are automatically tracked by the system.


