Introduction and Background
Microsoft provides a lot of well integrated diagnostic features within SQL Server’s management environment, such as Activity Monitor, standardized templates for Profiler, and preconfigured Alerts triggered by specific changes in the operating environment. However, a critical component of performance analysis that has not been integrated with the same level of point-and-click ease involves the need to incorporate the instance’s CPU usage level into the picture.
Specifically, SQL Server does not provide an easy way to trigger traces or other captures of diagnostic information based on the level of CPU processing directly attributable to the database engine. There are solutions for creating SQL Alerts based on the overall usage level of the server’s CPU. However, it is important to isolate the cause of the CPU escalation directly to the SQL Server process and therefore not trigger the overhead of traces because of CPU usage caused by native Windows processes or third party utilities.
Likewise, when a legitimate Alert occurs, you want to capture information about the relevant queries when the Alert triggers, not when you finally manage to connect to the server. By configuring the appropriate captures ahead of time you can analyze the performance issues at any time regardless of when they actually occurred.
The solution outlined in this article is a method for triggering SQL traces and other diagnostics based on the percentage of Processor time used by the “sqlservr.exe” process. The steps involved can be accomplished without having to leave the SQL Server Management Studio environment or requiring OS rights.
Two Main Steps
There are two main steps to triggering the trace or other diagnostics related to processor usage:
- Configuring the Alert
- Scripting the Trace
Configuring the Alert
In order to obtain the actual CPU performance statistics from within SSMS you will need to configure a WMI query within the Alert. Create a new Alert by right clicking on the Alerts folder under the SQL Server Agent node as shown in Figure 1. Give it a relevant name like “CPU Alert” and then click the drop down in the second field named “Type.”
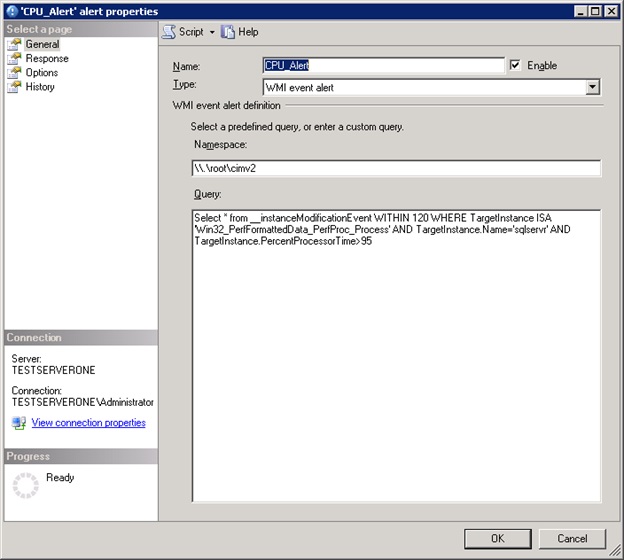
Figure 1
Select the bottom option named “WMI event alert” and you will see a field named “Namespace:” already configured with the following code:
\\.\root\Microsoft\SqlServer\ServerEvents\MSSQLSERVER
This is the default namespace that SQL WMI alerts are configured with because this area of the WMI namespace contains performance related objects relevant to SQL Server. It does not, however, contain the objects that we need in order to construct a query that will trigger an alert based on CPU usage. Thus, we need to change this entry to the following:
\\.\root\cimv2
Copy and paste the entry above into the namespace, ensuring that you completely overwrite any of the preexisting code. The “\\.\root\cimv2” is the default WMI name space that most system administration scripts connect to in order to execute system information queries such as OS configuration or performance related statistics.
After changing the WMI namespace we need to construct a query that will determine the two conditions that must be met in order to fire the Alert: the level of processor usage considered inimical to healthy performance and the duration for which this level must be maintained. In one case an application performance team determined that a level of 95% utilization sustained for an interval of 2 minutes was the point at which diagnostic information needed to be captured. Based on that requirement, the following WMI query was written within the “Query” panel of the Alert Properties page.
Select * from __instanceModificationEvent WITHIN 120 WHERE TargetInstance ISA 'Win32_PerfFormattedData_PerfProc_Process' AND TargetInstance.Name='sqlservr' AND TargetInstance.PercentProcessorTime>95
The query syntax is WQL which is short for WMI Query Language, a subset of ANSI SQL specifically designed for facilitating queries of Windows Management Instrumentation. The key WQL word in the query above is “WITHIN.” This key word specifies the interval (measured in seconds) for which the condition must be met before the Alert is fired. The second key takeaway in this query is the percentage utilization parameter which in this case is the 95. Substitute the parameters relevant to your situation and paste the query into the panel as shown in the screenshot.
(For more info on WQL key words see Microsoft reference: http://msdn.microsoft.com/en-us/library/windows/desktop/aa394606(v=vs.85).aspx)
After specifying the query that fires the Alert, click on the Response page to configure the actions that determine whether or not you are alerted and what diagnostics are initiated. In the example screenshot below, the operator will receive an email and a SQL job named “sp_ScriptTuningTrace_2M(Trace)” will commence once the Alert is triggered. In order to execute your trace or other diagnostics, you must encapsulate them within a separately configured SQL job; there is no field to simply paste some TSQL commands.
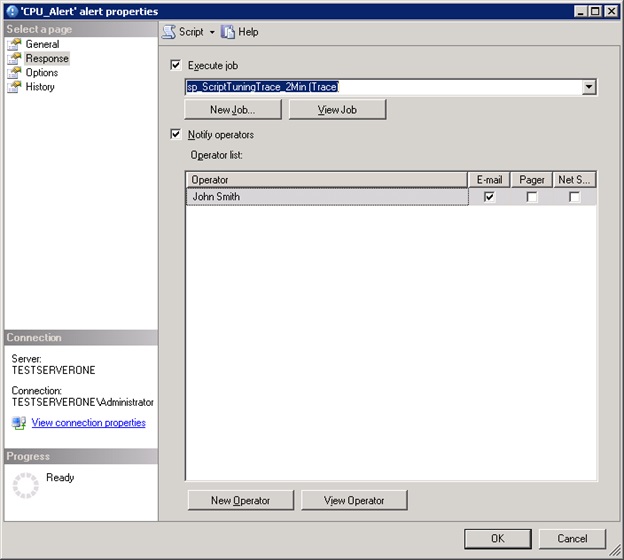
Figure 2
Assuming that you are following this article step-by-step, you do not yet have a trace routine or other diagnostics job configured so save the Alert by clicking the OK button. Otherwise, select the job from the drop down.
This brings us to the next step:
Scripting the Trace and other Diagnostics
As mentioned at the beginning of this article, the GUI based Profiler tool is a nicely integrated, intuitively usable tool. With a few drop-down based clicks you can select some preconfigured traces, filter out what you don’t want and with the press of a button kick off the capture. Unfortunately, the tool does not include any GUI based capabilities for either scheduling traces or kicking them off based on performance events. Therefore, we need to script out our trace configuration and encapsulate the code within a SQL job. Furthermore, DBAs ideally will take the extra step to encapsulate the trace logic in a stored procedure that accepts input parameters first. Doing so will allow easy reuse and customization of the code for future requirements that will inevitably vary.
The quickest way to script out a trace is to use the GUI based Profiler tool, export the resultant definition to text and then customize as necessary.
Open the Profiler tool and give the trace a relevant name on the Trace Properties page. The example in this article uses a trace configured from a Profiler Tuning Template as shown in the screenshot below. If you are familiar with Profiler and know what you want to capture, set the necessary values. After you have configured Profiler, a minor limitation of the tool becomes apparent; you must actually start and run the trace briefly before the option to export the trace definition becomes available. So, start and then stop the trace. Then, navigate to File > Export > Script Trace Definition, select the version of SQL relevant to your situation and save the file.
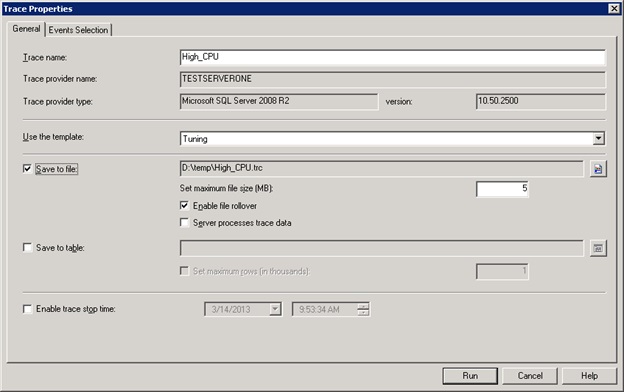
Figure 3
Now, open the definition file in SSMS and edit the template to your liking.
In the code below, I’ve encapsulated the trace definition into a stored procedure as I recommended. The procedure takes the trace run time as an input parameter with a default value of two minutes and creates trace files with a naming pattern prefix “Trace_CPU_” followed by a time stamp (line 16). I’ve bolded the portions of the code that I added to the definition so that you can use it as a template if you like. When you’re done, save the procedure in the Master database and then you can always refer to it by its short name.
It should be noted that in order to prevent the overhead of running more than one trace concurrently, be sure to limit the trace duration and the alert interval to the same specification.
CREATE PROCEDURE [dbo].[sp_ScriptTuningTrace_2Min]
     @RunTime int = 2 -- Duration of the trace in minutes
AS
-- Create a Queue
      declare @rc int
      declare @TraceID int
      declare @maxfilesize bigint

-- Generate File Names based on prefix and time stamp
-- Specify Max File Size and Location
     DECLARE @Now datetime
     DECLARE @StopTime DateTime
     DECLARE @FQFileName Nvarchar(100)
     DECLARE @FileStamp Nvarchar(25)

     SET @Now = GETDATE()
     SET @StopTime = DATEADD (Mi , @RunTime , @Now )
     SET @FQFileName = 'D:\temp\Trace_CPU_'
     SET @FileStamp =
     CAST(Datepart(year, GetDate()) AS Nvarchar) +
     CAST(Datepart(month, GetDate()) AS Nvarchar) +
     CAST(Datepart(Day, GetDate()) AS Nvarchar) +
     CAST(Datepart(Hour, GetDate()) AS Nvarchar) +
     CAST(Datepart(Minute, GetDate()) AS Nvarchar)
     SET  @FQFileName = @FQFileName + @FileStamp
     SET @maxfilesize = 10

      exec @rc = sp_trace_create @TraceID output, 0, @FQFileName, @maxfilesize, @StopTime
      if (@rc != 0) goto error

-- Client side File and Table cannot be scripted

-- Set the events
      declare @on bit
      set @on = 1
      exec sp_trace_setevent @TraceID, 10, 1, @on
      exec sp_trace_setevent @TraceID, 10, 3, @on
      exec sp_trace_setevent @TraceID, 10, 11, @on
      exec sp_trace_setevent @TraceID, 10, 12, @on
      exec sp_trace_setevent @TraceID, 10, 13, @on
      exec sp_trace_setevent @TraceID, 10, 35, @on
      exec sp_trace_setevent @TraceID, 45, 1, @on
      exec sp_trace_setevent @TraceID, 45, 3, @on
      exec sp_trace_setevent @TraceID, 45, 11, @on
      exec sp_trace_setevent @TraceID, 45, 12, @on
      exec sp_trace_setevent @TraceID, 45, 13, @on
      exec sp_trace_setevent @TraceID, 45, 28, @on
      exec sp_trace_setevent @TraceID, 45, 35, @on
      exec sp_trace_setevent @TraceID, 12, 1, @on
      exec sp_trace_setevent @TraceID, 12, 3, @on
      exec sp_trace_setevent @TraceID, 12, 11, @on
      exec sp_trace_setevent @TraceID, 12, 12, @on
      exec sp_trace_setevent @TraceID, 12, 13, @on
      exec sp_trace_setevent @TraceID, 12, 35, @on

-- Set the Filters
      declare @intfilter int
      declare @bigintfilter bigint

      set @intfilter = 50
      exec sp_trace_setfilter @TraceID, 12, 0, 4, @intfilter

      exec sp_trace_setfilter @TraceID, 35, 0, 7, N'Master'
-- Set the trace status to start
      exec sp_trace_setstatus @TraceID, 1

-- display trace id for future references
      select TraceID=@TraceID
      goto finish

      error:
      select ErrorCode=@rc

      finish:
Go
At this point, we need to configure the SQL job that will initiate our stored procedure when the performance Alert triggers. Create a new job with an appropriate name under SQL Server Agent and paste in the reference to our stored procedure in the Steps section as shown in the graphic below. The last thing to do is link the Alert we created to this job. Back in the Response section of the CPU based Alert you should now be able to click the drop down and select the newly created job. (Of course, it’s more efficient to create the job first and then the Alert; the order presented in the article was strictly for instructional purposes.)
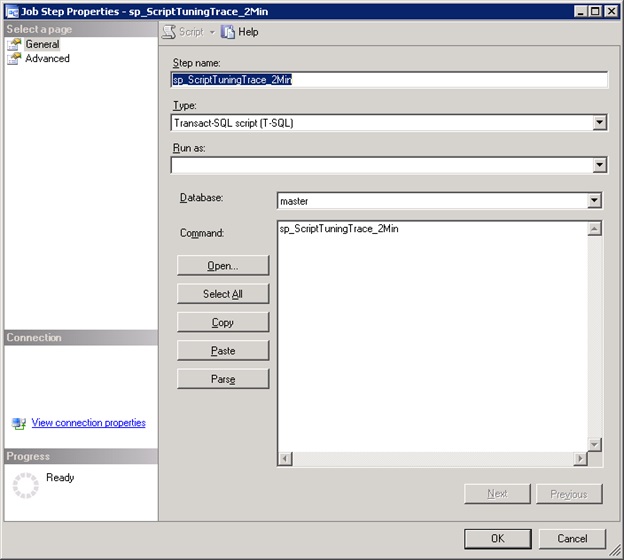
Figure 4
Conclusion
At this point you have a job and sproc that you can easily modify to fit changing diagnostic criteria. As mentioned at the beginning of this article, you can use this WMI code to trigger other diagnostics based on CPU usage, such as scripts which might for instance insert the output of CPU related DMVs into a table. In some cases such scripts may have the advantage of being less resource intensive than running a trace, depending on filtering, the script parameters and other variables. However, properly configured traces can be useful and the automation capabilities provided by WMI ensure that the trace information can be captured whenever it is needed.