

A database diagram clearly details the structure, relationships, and data rules in a database. It makes storing, retrieving and manipulating your data much simpler by ensuring your data's consistency and organisation.
This image belows shows a very simple database diagram containing four entities, three of them are linked through 1:many or 1:1 relationships, and the fourth is standalone.
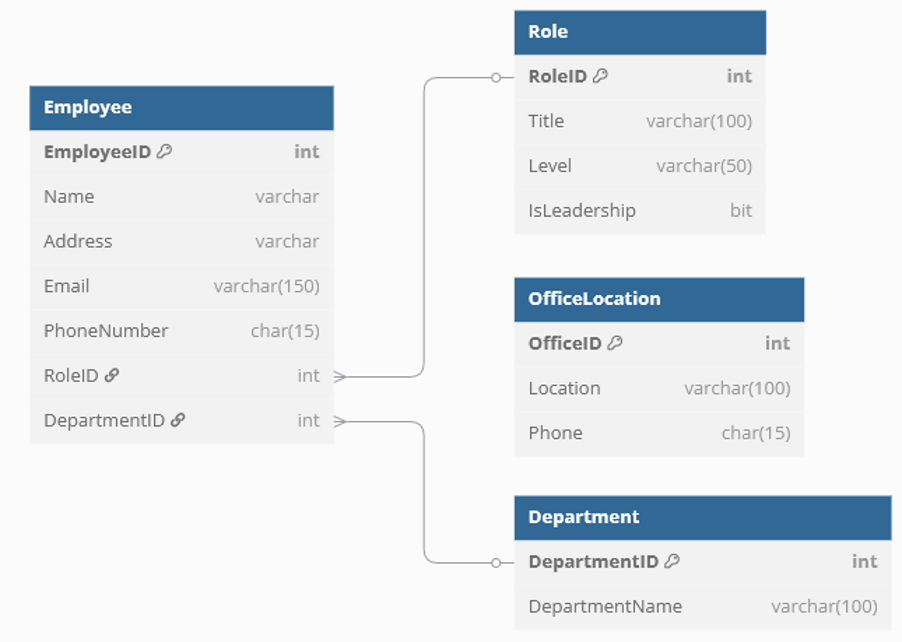
Each entity has it's own list of fields, alongside their associated data types. A database diagram identifies the following:
- Entities – In a database, these are your tables. They represent the core components of your Data. In this example, we have Employee, Role, Department and OfficeLocation
- Associations - These are the foreign key relationships that connect your tables. Associations define how different entities relate to each other, for example linking an 'Employee' to their 'Department' through a DepartmentID foreign key.
- Requirements - These influence the design of tables and relationships. Requirements list the anticipated uses for the data, such as tracking employee assignments, and help define what entities and associations need to exist in your schema.
- Technology Assessment - This is a review of the strengths and weaknesses of the hardware and software which the database will be hosted on.
Types of Database Diagrams
There are three main types of database diagrams: Conceptual, Logical, and Physical. They each have their own uses, providing different levels of detail and complexity.
Conceptual Database Diagram
A Conceptual Database Diagram is defined as:
- Containing the essential entities and the relationships between them.
- Not specifying any attributes or primary keys.
They are designed to answer the following questions:
- What is the database's purpose?
- Who are the intended users?
- How will it be used in practice?
Answering these questions will define the necessary entities and relationships for your database.
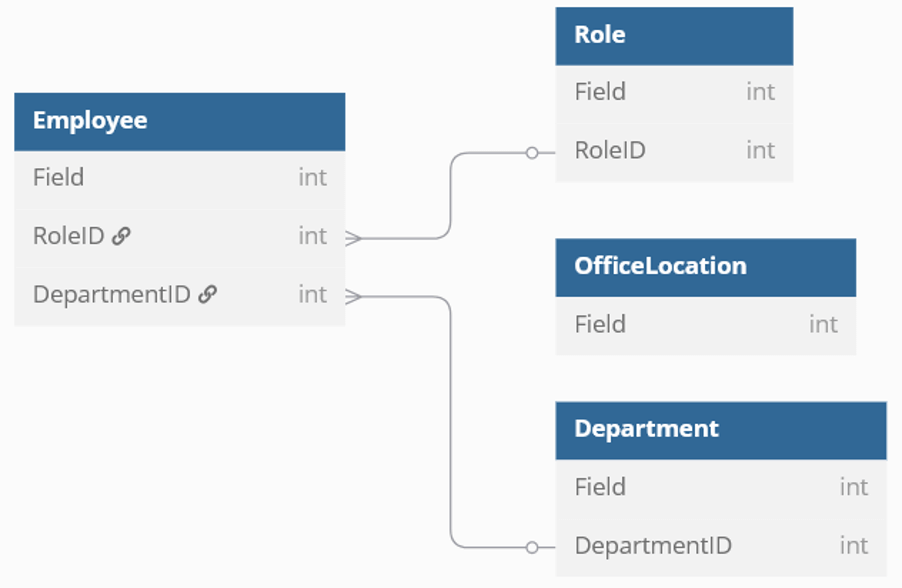
For example, consider a basic employee management system. The purpose of the system would be to hold information on employees, their respective roles, and departments. It would be used by managers to understand where every employee is working, and what they are doing within the company. It would also allow them to reassign people to other departments, and ensure each team within the company has enough people that can fulfil a certain role to operate efficiently.
A conceptual diagram for this, as shown below, would show entities like 'Employee', 'Department', and 'Role'. This shows the layout of the database, the entities needed for it and how they relate to each other – without needing to worry about all of the fields and data types.
Logical Database Diagram
Now we have created a conceptual diagram, the next step of the process is to create a logical database diagram. This will define the information structure in as much detail as possible. The aim of it is to document business data structures, processes, rules, and relationships in detail.
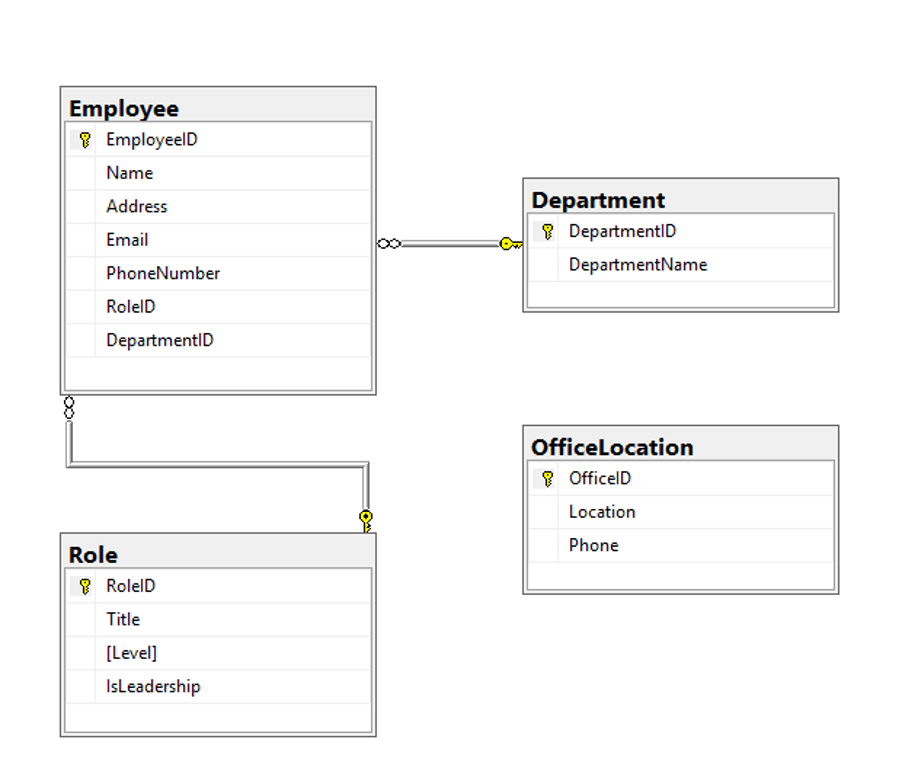
A logical diagram includes all entities and their relationships, all attributes for each entity and the Primary and Foreign Keys for each entity. The diagram below contains all of our entities with the Primary Keys being shown by a key icon, and the Foreign Keys being shown by a link icon.

Let's take a more detailed look at the diagram to understand it a little more. As the diagram shows, we have four entities: Employee, Role, Department and OfficeLocation. EmployeeID is an attribute of the Employee entity and its primary key. The Employee entity's 5th and 6th attributes are the RoleID and DepartmentID, these are both foreign keys that relate to the Role and Department entities respectively.
Similarly, the Role entity has RoleID as its primary key. The Employee entity also has an attribute RoleID. This is its foreign key and matches to RoleID in the Role entity. Having identified the required attributes between the entities we have defined a conceptual model. While OfficeLocation is still a part of the database, it has no links to these other entities, so while it has it's own primary key (OfficeID), it has no connections as none of the other entities use OfficeID.
Obviously in a more detailed example each employee or department would be assigned an office location but for the purposes of our simplified example we have assumed not.
Physical Database Diagram
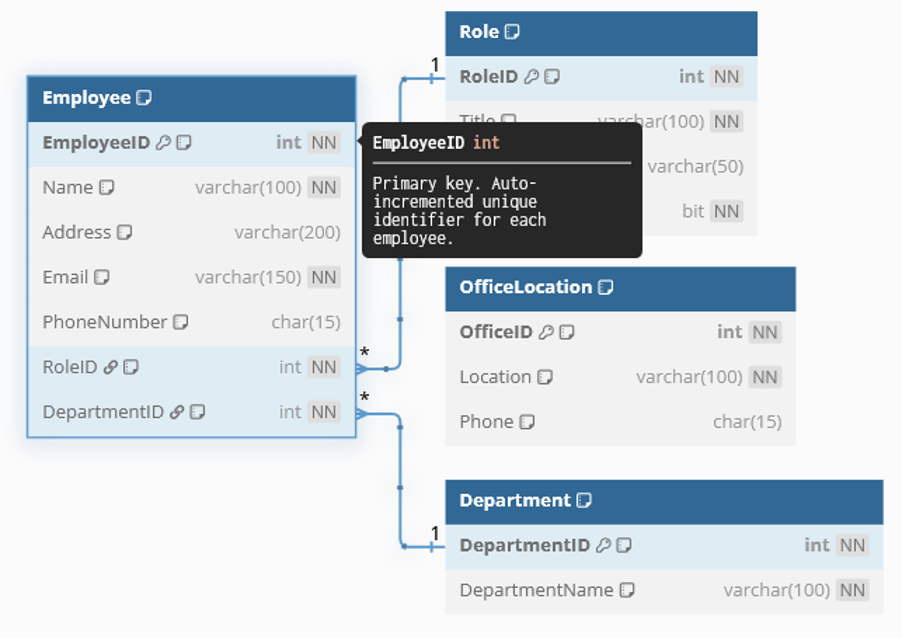
Physical diagrams are more detailed again and show how the data model will be presented in the database. It gives a reader all table structures, column names, data types, constraints, primary keys, foreign keys, and the relationships between tables.
Physical database diagrams expand on a logical database diagram to define the structure of the RDBMS system hosting the database. It includes defining the structures of the tables and data types, that will be used to store the information, and can also include new data structures to help with query performance.
Here the database diagram, shown below, has been expanded into a physical diagram containing explicit notes to describe each field. These notes act as built-in documentation, helping clarify logic and the role each element plays in the overall schema. This version also reflects implementation-level details such as using NN (Not Null) to show which fields are required.
Benefits of a Database Diagram
A well designed database diagram helps organize data by providing a clear visual structure how different entities relate to one another. For example, in the employee management system we created, you can immediately see how each employee is linked to a role and a department. This clarity ensures that developers, analysts and administrators are all clear about that they are working towards, reducing confusion and minimising wasted effort.
Database diagrams also improve data quality and integrity by clearly defining the constraints and relationships between entities. The use of foreign keys like RoleID and DepartmentID shows that every employee must be linked to other valid entries in the Role and Department tables. This will prevent common issues like orphan records or inconsistent data, making it easier to validate entries during data input and migration.
They also help reduce redundancy, making sure that data is only stored once and is referenced when needed. Rather than creating several department names in the Employee table, the diagram has its own Department table which should hold this information. This helps save storage space.
A clear structure will also massively streamline the data retrieval process. With the previous example, retrieving all employees from a specific department would only require a join between the two tables. Clean relationships and predictable naming conventions make queries are easy to write, debug and optimize.
Finally diagrams allow for scalability. When you can see how each table connects and what relationships they are dependent on, it becomes much easier to add new features. Here you could add a new table like Project for the project someone is currently assigned to, and link it to the Employee table without disrupting the structure. Having things laid out clearly like this is critical as your data model grows in complexity.
Creating Database Diagrams
There are a lot of tools on the market that can be used to create database diagrams. In this section we'll look at SQL Server Management Studio, which is the industry standard all other tools are judged against, and also dbForge, which is a more advanced but paid for tool.
Using SQL Server Management Studio (SSMS)
Microsoft created SQL Server Management Studio in 2005. It is free and has become the industry standard. Creating database diagrams is simple and approachable using SSMS. Open the SSMS object explorer, locate your database (here we are using CompanyDB), right-click on "Database Diagrams" and select "New Database Diagram". Then select the tables you want to include, and click "Add".
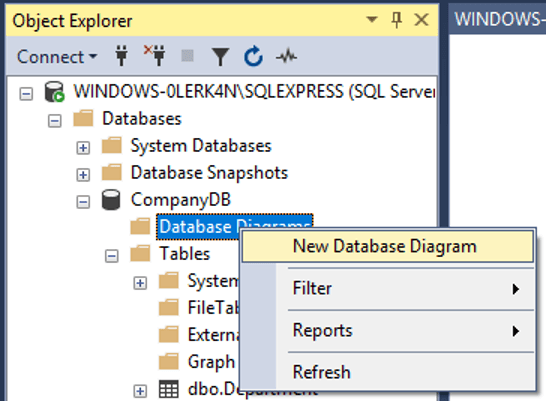
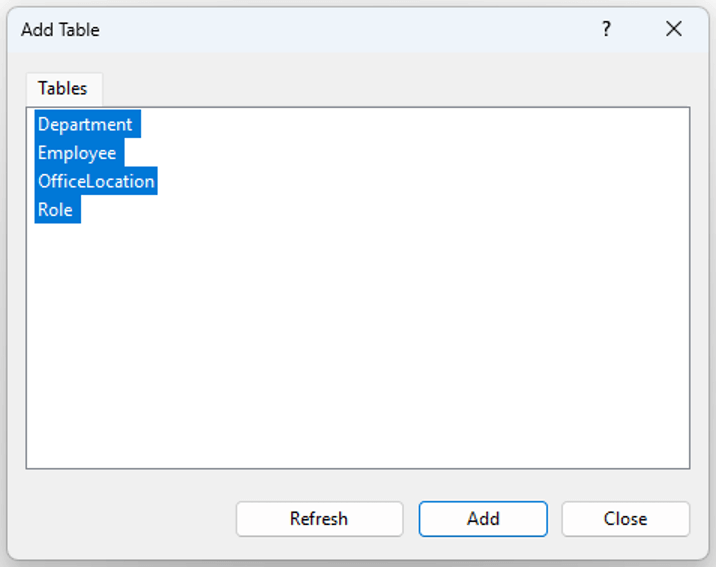
The tables we picked can be seen below. The diagram shows all their fields with links for the Foreign Keys, and the Primary Keys being indicated by the gold key icon.
Using dbForge Studio for SQL Server
As noted above, dbForge Studio is a paid for tool which is more advanced than SSMS. It comes with a better interface and diagram creation capability. Full details on it as a database diagram tool can be found on dbForge's website.
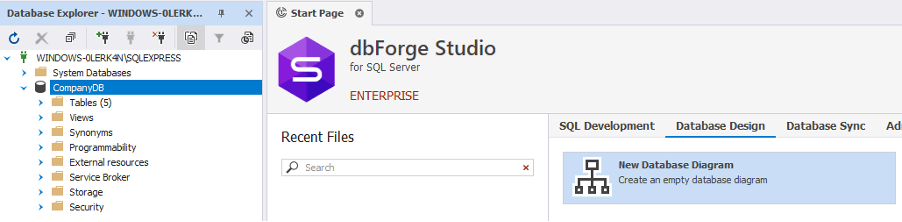
This time, all you have to do is open dbForge Studio, connect to your database, select the Database Design tab and then click "New Database Diagram". From here, just select the tables you want to include, and drag and drop them into the workspace.
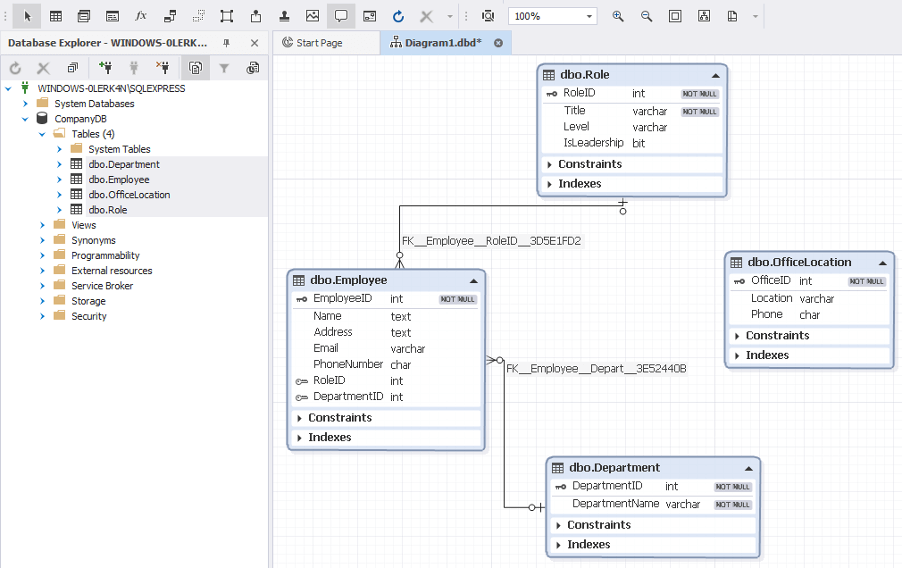
As you can see below, the layout is quite different, the foreign key is now listed alongside the connection, and has it's own transparent key icon that faces to the right, while the primary key for each table is a filled key icon that faces to the left. There are also drop-down menus for Constraints and Indexes, which is great for Physical Database Diagrams.
SQL Server Management Studio (SSMS) vs dbForge Studio for SQL Server
As discussed above, SSMS is a far simpler solution than dbForge. SSMS offers all the core functionality you would expect from a database interface, including the ability to connect to and manage databases, execute queries and perform basic admin tasks. Through its Object explorer, users can easily browse tables, views and other objects within a database. The built-in query editor also includes IntelliSense which will speed up the SQL writing process and help you track errors. SSMS also integrates with SQL server reporting services, allowing users to manage and deploy reports from within the same environment.
However it does have a limited toolkit, it lacks some more advanced database deployment and admin features. There are no built-in tools for schema comparison, version control, data masking or automated data generation for testing. This means that Database Admins often need to use other third-party tools or manual processes to handle these tasks.
DbForge on the other hand is a much more comprehensive tool designed for professionals that need more than just the basics. It offers an enhanced query editor with real time suggestions, a content-relevant IntelliSence that gives suggestions in real time and a fully integrated code formatter that maintains coding standards. DbForge also has a data comparison function, enabling users to quickly identify and fix differences between databases. It also allows users to generate test data to simulate their actual data, and has performance analysis tools that will help users build efficient and functional databases.
Both tools work well for their intended markets. DbForge is designed for professional use and larger databases while SSMS is a simple system designed for small databases.
Conclusion
A database diagram isn't a nice to have, just as a map isn't a nice to have when you set out on a journey. A good diagram is the basis of an efficient well-managed database. It helps ensure that relationships are correctly defined, naming conventions are consistent, and future changes can be made with confidence. Creating one might feel tedious when you are eager to jump into development, but it prevents costly reworks down the line by exposing any structural issues early on in the process. By visualising the system, you can avoid confusion during collaboration, streamline future changes, and make maintenance easier.
