

Introduction
The Bin Packing Problem, in its simplest form, is easy to explain and to understand: imagine that there are a certain number of items, each one with its own value (e.g. a volume, a weight, a length…) and an infinite number of bins in which the items must be packed. All the bins have the same capacity that is greater than or equal to the maximum capacity of each item. The problem is to pack all the items in a way that minimizes the number of bins.
One theoretical approach could be to try every possible combination and then to choose the best one. This brute-force solution has the drawback that it can be used only with very few items because the necessary computational time grows exponentially as the number of the items grows. So, the task is to find an algorithm that guarantees a good enough solution, even if not the best, in a short enough time.
If you are interested to delve into the Bin Packing Problem you can have a look at Wikipedia where you can find the formal statement, all the details about the algorithms and more.
But how could this problem be solved in T-SQL? Several authors have already studied the problem and come up with different and interesting solutions. I would like to mention here Hugo Kornelis, Joe Celko and Gert Jan.
In this article I am going to show another solution with the detailed description of the algorithm, and then I am going to analyse the results from the point of view of speed and efficiency varying the number of the items from several thousands to millions.
Setup the Environment
I found the structure of the tables and the data generator of the aforementioned Hugo Kornelis very interesting, and I have decided to use them, although with several modifications in order to be able to increase the number of the items as needed.
The Scenario
The scenario is the following: a certain institute organises exam sessions related to different subjects and each subject has its own number of registered students. From the point of view of the Bin Packing Problem, the subjects play the role of the “items” and the number of registered students represents their “value”.
The exam sessions will be taken in rooms – the “bins” – with a maximum of N seats, let's say 100, for example. The problem then is to “pack” the subjects into the rooms in a good enough way, in order to use as few rooms as possible.
This job lasts three months and has to be done every quarter. From our perspective this is very interesting because it gives us the possibility to generate different distribution of data for each quarter and to test the algorithm with them.
The Code
The following is the code that creates the Registration table. Please note the check constraint that limits the number of the candidates to less than or equal to 100. I have decided to consider this number as the capacity of the bins and this value is hard coded in all the scripts.
CREATE TABLE dbo.Registrations(
   Year smallint NOT NULL
  ,Quarter tinyint NOT NULL
  ,SubjCode char(5) NOT NULL
  ,NumCandidates int NOT NULL
  ,SessionNo int DEFAULT NULL
  ,CONSTRAINT PK_Registrations
      PRIMARY KEY (Year, Quarter, SubjCode)
  ,CONSTRAINT CK_Registrations_Quarter
      CHECK (Quarter IN (1, 2, 3, 4))
  ,CONSTRAINT CK_Registrations_NumCandidates
      CHECK (NumCandidates > 0 AND NumCandidates <= 100)
);
go
The Sessions table represents the rooms that must be rented. For each of them we register how many empty seats we have left:
CREATE TABLE dbo.Sessions(
   Year smallint NOT NULL
  ,Quarter tinyint NOT NULL
  ,SessionNo int NOT NULL
  ,SpaceLeft int NOT NULL
  ,CONSTRAINT PK_Sessions
      PRIMARY KEY (Year, Quarter, SessionNo)
);
go
The following piece of code creates the stored procedure, spBinPackingProblemDataGenerator. This procedure, according to its name, the data generator. It has two parameters: the first one, @NumYears, indicates for how many years data will be generated starting from 1995. The second one, @NumSubjects, indicates how many records will be generated for each quarter. By default, it generates data for 10 years and 1000 records per quarter producing 40000 records in total.
create procedure [dbo].[spBinPackingProblemDataGenerator] (@NumYears tinyint = 10, @NumSubjects int = 1000)
as
begin
--Parameters
--@NumYears -- Number of years
--@NumSubjects  -- Number of subjects (= rows) in each quarter
--             The default value 1000 means 40000 generated rows (multiply this number by 4 quarters for 10 years)

--The first querter Q1 will have a normal distribution: 100% 1-100, evenly distributed
--The second quarter Q2 will have a greater number of smaller sessions:  70% 1-25, 30% 26-100
--The third quarter Q3 will have a greater number of larger sessions:  20% 1-40, 80% 41-100
--The fourth quarter Q4 will have a bell curve distribution: 100% 4-80 with most around 42
  set nocount on;

  truncate table dbo.Registrations;

  -- Loop counters
  declare @y tinyint,
      @q tinyint,
      @s int;

  -- The line below ensures reproducible results - remove it to get truly random results
  set @y = RAND(123); -- Replace 123 with another seed value to get a different set of reproducible results

  set @y = 1;
  while @y <= @NumYears
    begin;
      set @q = 1;

      while @q <= 4
        begin;
          set @s = 1;
          while @s <= @NumSubjects
            begin;
              -- Random number generation - different expression for each quarter
              INSERT  dbo.Registrations
              (Year, Quarter, SubjCode, NumCandidates)
              VALUES
              (@y + 1994, @q,
              CONCAT(REPLICATE('0', 5 - LEN(@s)), @s),
              CASE @q
                WHEN 1 THEN CEILING(100 * RAND())
                WHEN 2 THEN CASE WHEN RAND() < 0.7 THEN CEILING(25 * RAND()) ELSE CEILING (75 * RAND()) + 25 END
                WHEN 3 THEN CASE WHEN RAND() < 0.2 THEN CEILING(40 * RAND()) ELSE CEILING (60 * RAND()) + 40 END
                WHEN 4 THEN CEILING(20 * RAND()) + CEILING(20 * RAND()) + CEILING(20 * RAND()) + CEILING(20 * RAND())
              END);

              set @s = @s + 1;
            end;

          set @q = @q + 1;
        end;

      set @y = @y + 1;
    end;
  end;
GO
The Data Distribution
In order to test the solution with a different data distribution, the procedure generates data differently for each quarter. In detail we have an even distribution for the first quarter (Q1), a greater number of smaller subjects for the second (Q2), a greater number of larger subjects for the third (Q3) and finally a sort of a Gaussian distribution with very few small and large subjects, but with a lot of them with values near to the average (Q4).
The Algorithm
The algorithm is divided into two steps: the first is to read the records from the Registration table in a certain order and to assign them a row number. The row number restarts from 1 for each quarter of every year.
The idea for the second step is to use a recursive CTE using the records having a row number equal to 1 as the anchor member of the CTE. Then, the recursive part of the CTE reads the records belonging to the same year and quarter of the input records, with the row number increased by 1 and their value is used to compute a ‘custom running sum’ that will be used to assign the bin number to each record. I will explain later what I mean with the expression ‘custom running sum’.
The First Simple (and Inefficient) Approach
For the first step, you are simply going to read the records partitioned by year and quarter, ordered by the number of candidates in an ascending way. This choice will not produce an acceptable result from the point of view of the quality of the solution; we will come back later to this point in order to find a good enough solution. For now, I think it is better to maintain a simpler logic.
The result is put into a temporary table (#regs) both for a more readable code and for performance reasons.
with
C as (  select row_number() over (partition by year, quarter order by NumCandidates) Rn,
         Year, Quarter, SubjCode, NumCandidates
    from Registrations)

select Rn, Year, Quarter, SubjCode, NumCandidates
into #regs
from C
order by Year, Quarter, Rn;
The second step assigns a bin to each record. In our example, the maximum capacity of the bins is 100 and the idea is to compute the number of the bins simply as the ‘custom running sum’ divided by 100 considering the integer part.
The tricky part is the one that computes the ‘custom running sum’. In fact, we cannot simply add the new value to the previous one but we have to consider that if the sum overtakes a multiple of the capacity of the bins (that is, in our case, every multiple of 100), the new ‘custom running sum’ will be the overtaken multiple of 100 plus the new value.
The following table should help to explain better. In this example, the first three rows fit in the first bin (bin nr = 0). The fourth row cannot be put into the first bin as there is not enough room. So, we must add a new bin and for this reason the new ‘custom running sum’ value will be 150 instead of 140. For the same reason, the fifth row does not fit in the second bin (bin nr = 1) and the new ‘custom running sum’ will be 260.
| Year | Quarter | Row number | Value | Running Sum (RS) | Bin nr (RS / 100) |
| 2000 | 1 | 1 | 20 | 20 | 0 |
| 2000 | 1 | 2 | 30 | 50 | 0 |
| 2000 | 1 | 3 | 40 | 90 | 0 |
| 2000 | 1 | 4 | 50 | 150 | 1 |
| 2000 | 1 | 5 | 60 | 260 | 2 |
Table 1
The following piece of code does exactly what has been just explained.
with
C1 as ( --As anchor member of the recursive cte, it considers records having Rn = 1
    select Rn, Year, Quarter, SubjCode, NumCandidates, NumCandidates CustomSum
    from #regs
    where Rn = 1

    union all

    --You add the new value of NumCandidates to the sum of the previous record
    --If the running sum remains less than the maximum capacity of the bin or it reaches exactly the maximum capacity of the bin
    --   then there is nothing to do
    --If the running sum overtakes the maximum capacity of the bin, the new value will be part of a new bin and so
    --   the new value is added to the multiple of 100 that has been overtaken
    select Regs.Rn, Regs.Year, Regs.Quarter, Regs.SubjCode, Regs.NumCandidates,
        case when (ca.NewSumValue / 100 = C1.CustomSum / 100) or (ca.NewSumValue % 100 = 0) then ca.NewSumValue
           else (ca.NewSumValue / 100 * 100) + Regs.NumCandidates
        end
    from #regs Regs
    inner join C1 on Regs.Rn = C1.Rn + 1 and Regs.Year = C1.Year and Regs.Quarter = C1.Quarter
    --You use the apply operator in order to have a more readable 'select clause'
    cross apply (select C1.CustomSum + Regs.NumCandidates as NewSumValue) as ca
    )
--You subtract 1 from CustomSum because the exact multiple of 100, must belong to the current bin
select Rn, Year, Quarter, SubjCode, NumCandidates, CustomSum, (CustomSum - 1) / 100 as binNumber
into #bridge
from C1
option (maxrecursion 0);
The result of the CTE is put into a new temporary table because in the complete script it will be used to consolidate the output into the Registrations and Sessions tables with the two following statements:
insert into Sessions
select Year, Quarter, binNumber, 100 - SUM(NumCandidates)
from #bridge
group by Year, Quarter, binNumber

update r
set SessionNo = b.binNumber
from Registrations r
inner join #bridge b on r.Year = b.Year and r.Quarter = b.Quarter and r.SubjCode = b.SubjCode
The complete attached script (BinPack_1_FirstAttempt.txt), in its final part has a statement that shows the quality of the result. With 40000 records in the Registration table, the complete script takes an average of 1506 milliseconds to complete on my laptop, but it produces a low-quality result (Table 2):
| Quarter | NumSessions | AvgSessionSize | AvgEmptySeats |
| 1 | 6503 | 78.026756 | 14289.2 |
| 2 | 3352 | 81.846957 | 6084.9 |
| 3 | 7820 | 77.49271 | 17600.7 |
| 4 | 5729 | 73.313143 | 15288.9 |
| ALL | 23404 | 77.241625 | 13315.925 |
Table 2
A Better Solution
In order to produce a better result, we have to find a more sophisticated way to assign the row number to the records in the first step of the algorithm. This is the core: we have to find a new “order by” criterion that lines up the records in a more suitable way for the recursive CTE.
As a starting point, I took one of the “order by” ideas, used by the aforementioned Hugo Kornelis in his tests, and I tuned it up. The idea is to create groups of records having the same distance, in absolute value, from the half of the capacity of the bins, that is 50, in our example. In this way, the first group has all the records with value equal to 50, the second with value equal to 49 and 51, the third with value equal to 48 and 52 and so on. If there were the possibility to make the records belonging to the same group appear, whenever possible, in an alternating way (e.g. 48 coupled with 52), the recursive CTE could create a lot of perfect couples the sum of which is exactly the maximum capacity of the bins.
As an example, if you had 3 records with value 48 and 2 records with value 52, they would belong to the same group. You can have a look at them in Table 3, Column A. While Column B has the row number related to this group based on the order by the values of the items, Column C has a row number based on the opposite criterion to Column B.
In Column D I have computed the absolute value of the difference between the values in Column B and Column C. It is likely that the couples having the same value in Column D will perfectly fill the bins. Of course, it strictly depends on data: if I had only records with 48, I would not completely fill the bins, but the result will be good any way. On the contrary, if all the values were 52, at least for this group, this algorithm would be highly inefficient because it would generate one bin per record.
| A | B | C | D |
| Item’s value | Row Number (order by Item’s value) | Reverse, as compared to C | ABS (C - D) |
| 48 | 1 | 5 | 4 |
| 48 | 2 | 4 | 2 |
| 48 | 3 | 3 | 0 |
| 52 | 4 | 2 | 2 |
| 52 | 5 | 1 | 4 |
Table 3
The following piece of code is the revision of the first step, where I implemented what just described:
with
C as (  select row_number() over (partition by year, quarter, ABS(50 - NumCandidates) order by NumCandidates) Rn,
           count(*) over (partition by year, quarter, ABS(50 - NumCandidates)) CountEl,
         Year, Quarter, SubjCode, NumCandidates, ABS(50 - NumCandidates) as AbsDiff
    from Registrations)

select ROW_NUMBER() over(partition by year, quarter order by AbsDiff, ABS(Rn - (ABS(CountEl - Rn) + 1)), NumCandidates) Rn,
     Year, Quarter, SubjCode, NumCandidates
into #regs
from C;
With this new criterion, the complete script (BinPack_2_BetterSolution.txt) takes an average of 1499 milliseconds to complete and the result is much better compared to the previous one (Table 4):
| Quarter | NumSessions | AvgSessionSize | AvgEmptySeats |
| 1 | 5384 | 94.243684 | 3099.2 |
| 2 | 2966 | 92.498651 | 2224.9 |
| 3 | 6831 | 88.712194 | 7710.7 |
| 4 | 4583 | 91.645428 | 3828.9 |
| ALL | 19764 | 91.467466 | 4215.925 |
Table 4
How Does This Scale?
Until now we have worked with 40,000 records. The question is if this algorithm remains fast enough and what is the quality of the solution with many more records, let’s say a couple of millions, for example. If you carry out the spBinPackingProblemDataGenerator setting 10 as @NumYear and 50000 as @NumSubjects, the result will be a Registrations table with 2 million records.
In this case the complete script takes an average of 61980 milliseconds to complete and we have a very good result:
| Quarter | NumSessions | AvgSessionSize | AvgEmptySeats |
| 1 | 254055 | 99.354435 | 16400.9 |
| 2 | 143695 | 97.572573 | 34880.9 |
| 3 | 337300 | 89.62434 | 349971 |
| 4 | 227215 | 92.446312 | 171631.1 |
| ALL | 962265 | 94.046505 | 143220.975 |
Table 5
It seems to scale well.
In order to understand better, I have tested the algorithm with a different number of records and the following are the results with the corresponding charts. It is clear from the shape of the charts that the algorithm scales linearly and that it reaches its best performance with at least one million records and tends to maintain it.
| NumRecs | AvgMillisecs | AvgSessionsSize |
| 40,000 | 1499 | 91.46 |
| 100,000 | 4116 | 92.73 |
| 300,000 | 10757 | 93.44 |
| 500,000 | 15798 | 93.77 |
| 1,000,000 | 31871 | 93.94 |
| 1,500,000 | 46666 | 94.05 |
| 2,000,000 | 61980 | 94.04 |
| 2,500,000 | 76765 | 94.07 |
Table 6
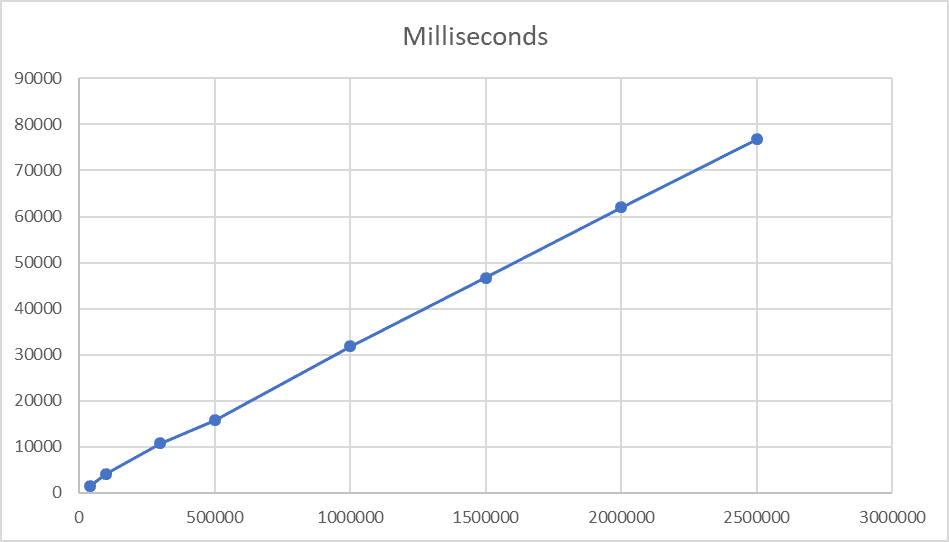
Chart 1
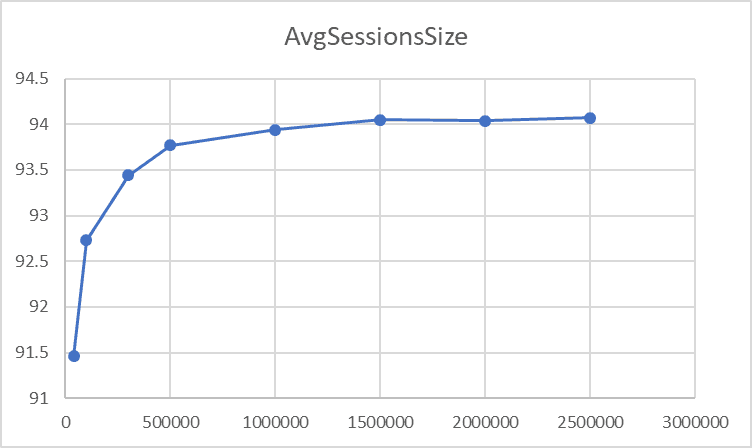
Chart 2
Conclusion
The bin packing problem is a very interesting topic and it is challenging to find a fast-enough solution in T-SQL that produces a good-enough result.
In this article I have shown a technique that scales linearly with somewhat good results especially starting from one million rows, when the bins, on average, are actually full at 94%.
