

Data is stored in heterogenous environments in many organizations. Enterprise reporting for management and other departments is created using a variety of tools. There are Excel Workbooks, SSRS Reports, Tableau Dashboards, flat files, data streams from MySQL databases, etc. Each data extract or report is created by a BI or DB Development Team member. Often team members have competing demands placed upon their limited development time.
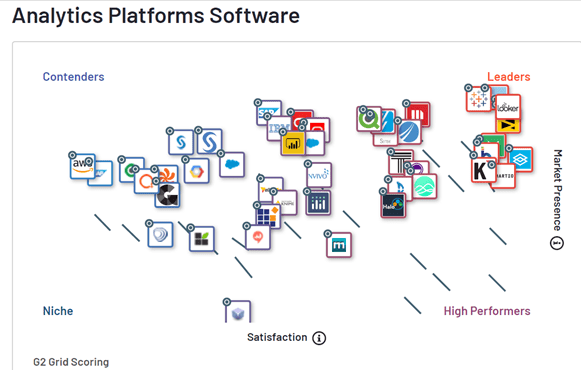
Part of a desired solution is to allow authorized users to help themselves to formatted data via self-service tools. As you can see below, there is a plethora of Business Intelligence tools available to use for data analysis and visualizations.
The Microsoft Power BI data visualization platform will allow you to provide the tools and services to content authors who can easily create shared reports and data streams for end-users, at a reasonable cost. It integrates well with other Microsoft Servers such as SharePoint and SQL Server.
Power BI is a cloud-based business intelligence service suite. It is used to convert raw data into meaningful information by using intuitive visualizations and tables. One can easily analyze data and make important business decisions based on it. Power BI is a collection of software services, apps and data connectors that together constitute the Power BI suite of tools, or platform.
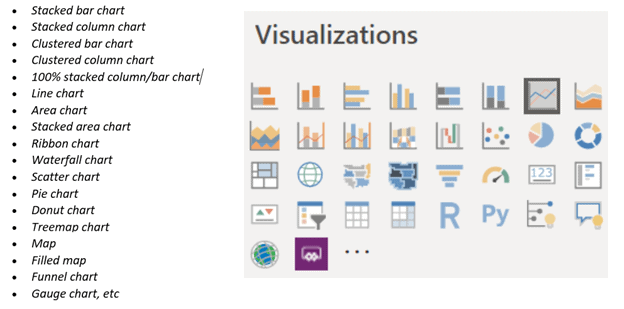
Authors can use pre-formatted or ad-hoc datasets imported in Power BI for data analysis by making sharable reports, dashboards, and apps. Power BI is a user-friendly tool offering impressive drag-and-drop features and self-service capabilities. In Power BI you can create visualizations such as:
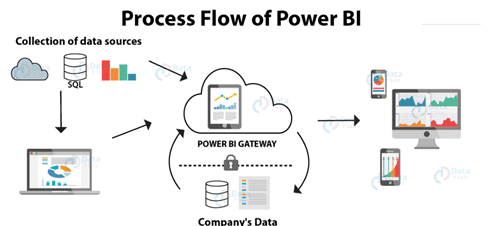
Authors can use Power BI with both on-premise and on-cloud platforms. Data sources for Power BI datasets can be an Excel Workbook, SQL Query, JSON or XML file, or even a simple formatted text file. Reports can be collected into Dashboards to do data comparisons.
Dashboards can be collected into Power BI App Workspaces, which are like Office 365 Workgroups. They can then be shared with authenticated end-users in the enterprise. These Workspaces are then made available to end users in a variety of data visualization tools, such as Web reports, Excel Workbooks, and can be embedded into SharePoint pages or other 3rd party applications. Access to the final product can be through traditional web pages, Excel Workbooks or even custom apps on iOS or Android devices.
There are four levels of the Power BI system:
- Power BI Desktop Free edition enables users to connect to 70+ data sources, limited publishing to the web, and export to excel. They have several connectivity options such as direct SQL queries, Excel workbooks, custom data streams and cloud services. However, there are some limitations to the free version. For example, users can’t do peer-to-peer sharing with app workspaces and reports are limited to 1GB storage space in the cloud. However, the free version is great if your end-users are doing their own data analysis and don’t need to distribute the results to other end-users.
- With Power BI Desktop Pro, users can create Power BI App workspaces, which are like Office 365 Workgroups. These allow end users to collaborate with colleagues, who also have a Power BI Pro license. They can create collections of dashboards, workbooks, and paginated reports that have a common purpose into Workspaces. The Pro edition has 10GB of cloud storage per Pro user. Datasets are limited 1GB per report and they can only be refreshed 10 times a day.
- Power BI Embedded (appendix 1) is exclusively Azure based and can take content from Pro and distribute it via a Web tool. These Embedded Reports can be surfaced in SharePoint, a HTML page, or any Dot-Net application through an API. Power BI Embedded widgets are complicated enough that only BI and DB developers will be able to create them.
- Power BI Premium is designed to address the challenges of large enterprise deployments and workloads. This hybrid solution starts with the Power BI Cloud solution and then adds an on-premises Power BI Report Server. It also allows any authenticated end user to consume content. This will allow authors to maintain and distribute reports on-premises or in the cloud. Data storage limits are expanded to 100TB in the cloud and each dataset can be refreshed 48 times a day. It will enable you to use your own existing servers, rather than relying solely on Microsoft’s shared capacity. This allows for much larger scale and better performance, while saving money by using your own hardware in conjunction with the cloud service. Because the Power BI Report Server will render your legacy SSRS reports, eventually the SQL Server Reporting Services servers can be phased out.
The Total Cost of Ownership (TCO) for Power BI can be illustrated with two examples. The first example assumes only 30 users who will produce and consume the Power BI content. The Power BI Pro version (cloud only) is a subscription license for $10 a month, per user. For 30 users that works out to $300 a month, or $3,600 a year.
The downside of that scenario is two-fold. The first is the restriction to just 10GB for data stored in the cloud for each user. Both the report and the dataset are all stored in the cloud. Storage for the dataset is restricted to 1GB per report, or if an Excel Workbook is the result it can only be 250MB. With these restrictions it is easy for an author to easily max out their storage limit. The other downside to this scenario is that author’s products can only be shared with other licensed Power BI Pro users.
The second example is for Power BI Premium. Power BI Premium is licensed by resources (appendix 1). It allows authors to use the Power BI Cloud service, as well as a Power BI report server hosted on-premises with our own servers. The number of authors and consumers is limited only to available resources.
For this example, we assume the lowest tier, which provides us with 8 cores, 25GB of RAM, and the Cloud storage limit is expanded to 100TB. The subscription cost of $5,000 a month works out to $60,000 a year. The upside of this scenario is number of users that can produce or consume reports is only limited to the carrying capacity of the hardware. The Power BI Premium pricing structure is tiered, so that we only pay for the next tier when we max-out the resources of the current one. This way costs kept are in-line with actual usage.
Recommendations:
- Engage BI & DB Development teams to do proof of concept reports, and dashboards, which can be created with Power BI Desktop edition at no cost. However, sharing the content with other users is limited.
- Start with the Power BI Pro edition initially, which is more functional than the Desktop edition, but costs significantly less than Premium edition. As authors climb the learning curve for using these new BI tools their needs can be met by adding licenses until we hit the threshold for tier 1 of Power BI Premium. If an existing Office 365 license with Microsoft is at the Enterprise E5 level, then the per user costs could be folded into that licensing model. The Pro edition is cloud only and would not utilize any of your own equipment.
- As report volume increases, an upgrade to Power BI Premium (tiers P1 – P5) is needed. This allows on-cloud Power BI Service expansion to by creating an on-premises Power BI Report Server, which would also serve as a legacy SSRS reports server. This allows use both the cloud and on-premises computing power to author and distribute Power BI Reports and Dashboards. This is a more expensive option to start, but is tiered so that capacity expansion costs are kept in line with actual use.
- Licensing for SQL Server Enterprise Edition with Software Assurance allows companies to fold all the Power BI associated costs into that license model.
Power BI has enough options for scaling up that it is a safe bet for now and in the future. Starting with simple POC reports in the free edition, and then create more advanced workgroups with Power BI Pro. This would allow the BI and DB developers to acclimate to these new tools. They can scale up using Power BI Premium. Ultimately, a sustainable level of use for these tools is reached and the licensing model can be dialed-in so that cost is the least possible. Power BI Premium allows you to utilize some of your own equipment, which is expensive to start with, but may be the better long-term decision because of cost and security reasons. Ultimately it is a matter of scale, costs & security.
Self-Service Reporting platforms has been a difficult proposition for many years. Power BI is the latest in a long line of Microsoft BI tools, and it has benefited from all the current and previous tools. It has been around for 5 years and has become a mature Self-Service Reporting platform. By adopting these new tools now and upgrading your Power BI implementation in tiers, you will provide the best tools, services and authoring skills to the people in your company who can utilize it to its fullest capabilities and make business intelligence available at a reasonable cost.
Appendix 1 - Power BI Versions:
| Power BI Version | Cost | Time Period | Number of users | Power BI Resources | Features |
| Desktop | Free | n/a | n/a | 5GB RAM, 1GB cloud storage | Fully cloud based self-service. Export to PowerPoint, Excel, CSV. Publish to the web in limited formats. |
| Pro | $9.99 | per month | 1 | 10GB RAM, 10GB cloud storage | Fully cloud based self-service. Can collaborate with other Pro users; Fully managed by Microsoft; included with Office 365 Enterprise E5. |
| Embedded | $1/hr+ | Report page renders/per hour | n/a | (See Power BI Embedded chart below) | Fully cloud based self-service. Can embed Web service in SharePoint or 3rd party apps. |
| Premium P1 | $5,000 | per month | 8 v-cores (4 frontend, 4 backend , 25GB RAM, 100TB Storage) | Enterprise BI with advanced data analytics, cloud based and on-premises reporting; allows any user to consume content. | |
| Premium P2 | $10,000 | per month | 16 v-cores (8 frontend, 8 backend , 50GB RAM, 100TB Storage) | Enterprise BI with advanced data analytics, cloud based and on-premises reporting; allows any user to consume content. | |
| Premium P3 | $20,000 | per month | 32 v-cores (16 frontend, 16 backend , 100GB RAM, 100TB Storage) | Enterprise BI with advanced data analytics, cloud based and on-premises reporting; allows any user to consume content. | |
| Enterprise | $21,000 | per 2 core/year | 32 v-cores (16 frontend, 16 backend , 100GB RAM, 100TB Storage) | SQL Server Enterprise Edition with Software Assurance includes Power BI Premium service. |
