

What is the Geometric Mean?
As we discussed in the previous article on calculating the Harmonic mean, we discovered that the calculation of mean may not provide the correct objective when there exists numbers with large variations.
Similar to the Harmonic mean, there is another calculation, named the Geometric Mean. The geometric mean is represented by this formula:
geometric mean = 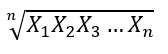
Let us see how the Harmonic mean is calculated for different values, as shown in the following table.
| ID | Values | Mean | Harmonic Mean | Geometric Mean | Observation |
| 1 | 50, 50 | 50 | 50.00 | 50.00 | All means are equal because values are identical |
| 2 | 40, 60 | 50 | 48.00 | 48.99 | Small variation gives almost similar results. |
| 3 | 45, 55 | 50 | 49.50 | 49.75 | Geomatic Mean remains higher than Harmonic Mean |
| 4 | 30, 70 | 50 | 42.00 | 45.83 | Difference becomes more visible |
| 5 | 35, 65 | 50 | 45.50 | 47.70 | Harmonic mean drops faster |
| 6 | 20, 80 | 50 | 32.00 | 40.00 | Large spread causes Harmonic mean to reduce significantly |
You can see from the above table that, even though the arithmetic mean is the same across all six combinations, the geometric mean differs for each pair. The geometric mean decreases as the values become more spread out. When the difference between the value pairs is small, the geometric mean remains closer to the arithmetic mean. However, when the gap between the values increases, the geometric mean becomes lower. This shows that the geometric mean is affected by the balance and proportional relationship between the values, making it useful for measuring growth rates, ratios, and multiplicative changes.
As we can see in the above table, the geometric mean and harmonic mean both decrease when the spread between values increases. However, the harmonic mean decreases more rapidly because it is highly sensitive to smaller values, whereas the geometric mean provides a more balanced measure of proportional change.
The Use Case for the Geometric Mean
Like the harmonic mean, the geometric mean is most commonly used in ranking scenarios. When multiple rankings are done by judges/reviewers, rather than taking the mean, the geometric mean is typically the best option if you want to reduce the weightage on the very small or very large values. Let us see how we can calculate the Geometric mean in Power BI. Please note that there is no built-in functionality in Power BI for Geometric mean.
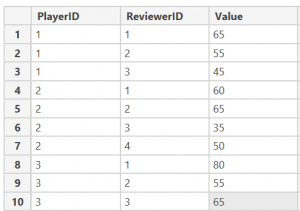
Let us first extract the data into Power BI. The Add Table option can be used in Power BI. The following is the sample dataset. Let us assume the following dataset is for ranking, provided by multiple reviewers for different players.
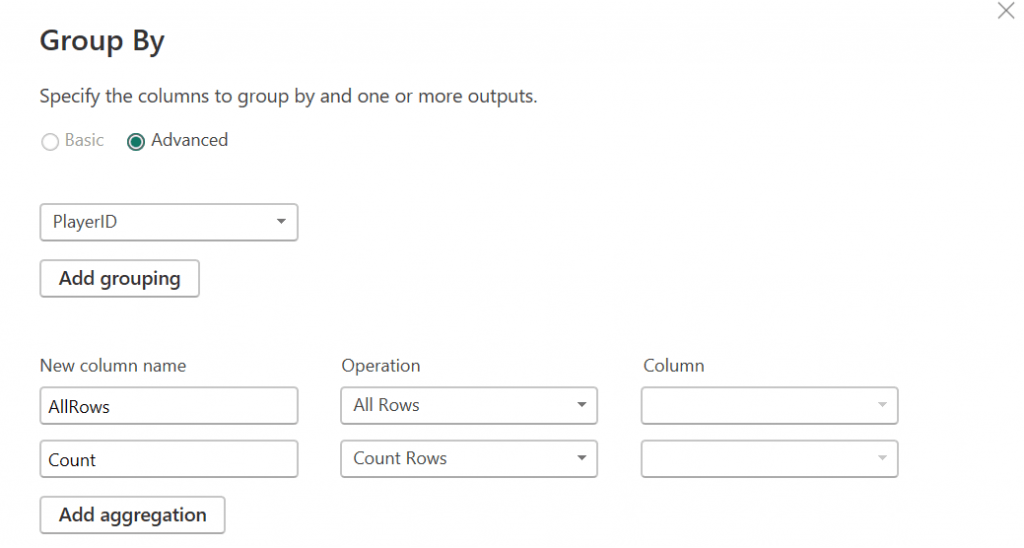
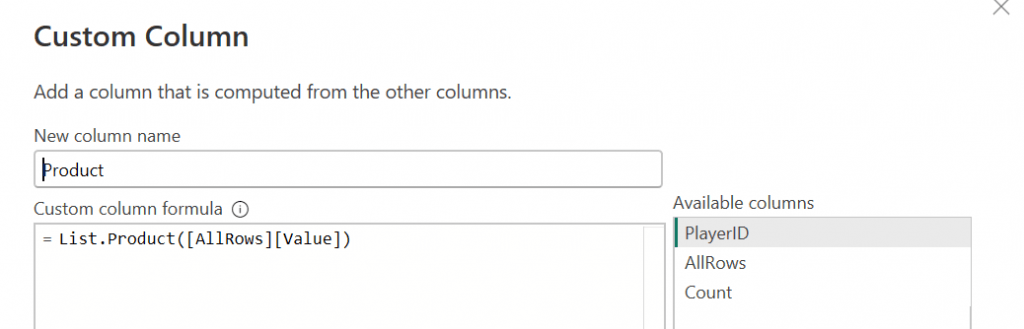
In the Transform, by using the Group By you will be taken to the following screen. In the above screen, two aggregations are created. Then a custom column is added as shown below with a formula, List.Product([AllRows][Value]).
This formula will add a new column with product of the Value column for each PlayerID.
Then another column will be added with the formula, Number.Round(Number.Power([Product],1/[Count]),2).
This will calculate the geometric mean and will be rounded to two decimal points with the Round function.
Finally, data will be shown as below.

This article provides you with simple steps to calculate the geometric mean for a dataset in Power BI. Please remember that this method will not be valid, if there are zero or negative numbers.