

What is Harmonic Mean?
Typically, if we have multiple values, we take their average. However, when these values have large differences, the use of the mean is always questioned. The following is the calculation of the harmonic mean.
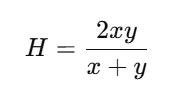
Where x and y are two values.
Let us see how the Harmonic mean is calculated for different values, as shown in the following table.
| ID | Values | Mean | Harmonic Mean |
| 1 | 50, 50 | 50 | 50.00 |
| 2 | 40, 60 | 50 | 48.00 |
| 3 | 45, 55 | 50 | 49.50 |
| 4 | 30, 70 | 50 | 42.00 |
| 5 | 35, 65 | 50 | 45.50 |
| 6 | 20, 80 | 50 | 32.00 |
You can see from the above table that, even though the mean is the same across all six combinations, the harmonic mean differs for each pair. The harmonic mean will be compromised when the values are spread out. If the difference between the value pairs is high, you will get the lower harmonic mean, and vice versa.
Please note that, like the mean, the harmonic mean can also be calculated for multiple values.
The Use Case for Harmonic Mean
The harmonic mean is most commonly used in ranking scenarios. When multiple rankings are done by judges/reviewers, rather than taking the mean, the harmonic mean is typically the best option.
Another typical case for the harmonic mean is when there are multiple evaluations, and you need to select a combination of those parameters. For example, in classification algorithms, we typically use precision and recall as evaluation metrics to select the best model. If we want both parameters considered, we will use the harmonic mean of precision and recall rather than the mean of the two.
Let us see how we can calculate the Harmonic mean in Power BI. Please note that there is no built-in functionality in Power BI.
Calculating the Harmonic Mean
Let us first extract the data into Power BI. I will use the Add Table option in Power BI. Please remember that you can add any other data source.
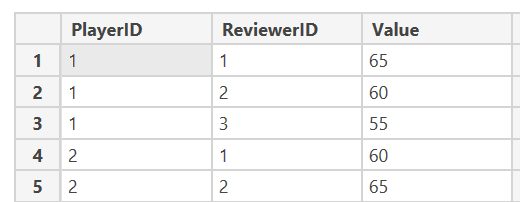
The following is the sample dataset. Let us assume the following dataset is for ranking, provided by multiple reviewers for different players.
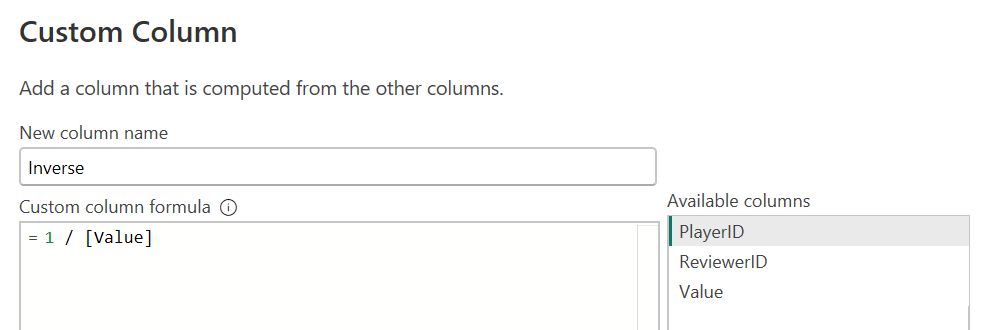
First, we need to get the inverse of the value by adding the column option with the following formula, as shown below.
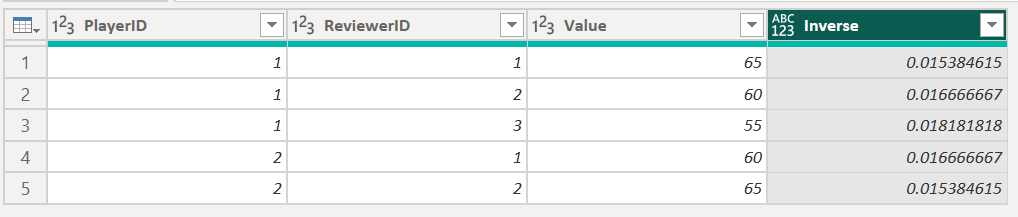
Then the dataset will look like the one below, with the new column Inverse.
Next, we need to select the Group by option as shown below.
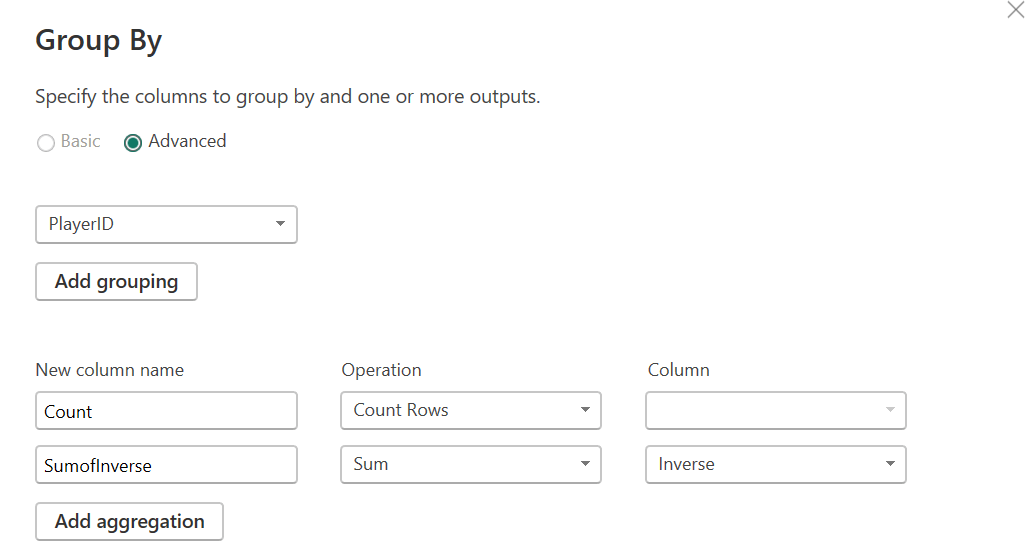
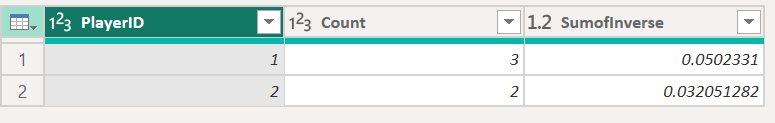
In this, the dataset will be aggregated by PlayerID, with two aggregation columns: Count and the Sum of Inverse. Then the dataset will be as follows.
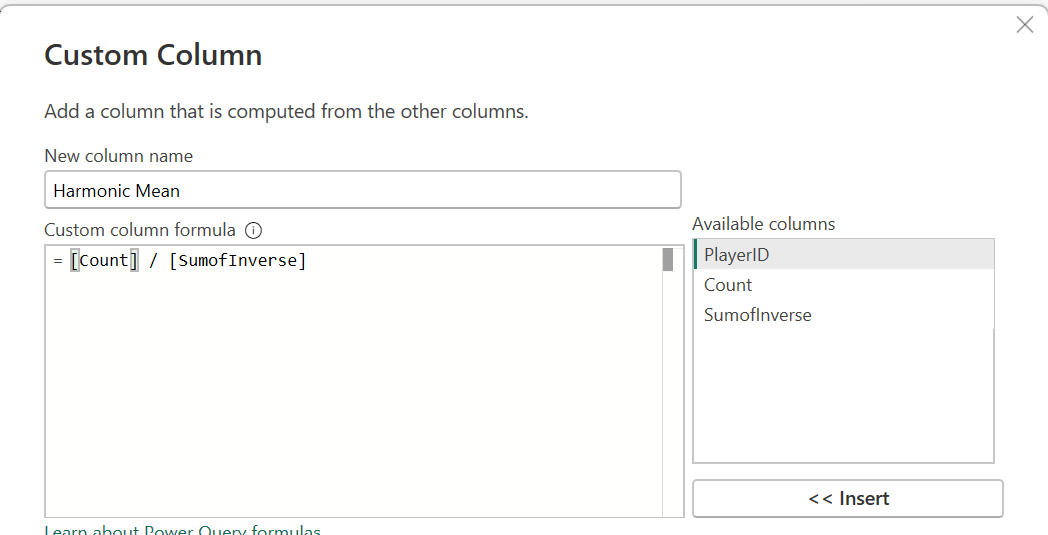
Finally, you need to add another column, Count/ SumofInverse, which will give us the harmonic mean.
Custom Column can be used as shown in the screen below.
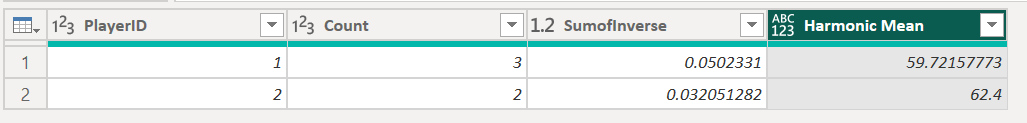
The following will be the final dataset for the harmonic mean for each player.
This article provides you with simple steps to calculate the harmonic mean for a dataset in Power BI.
