

With the retirement of ADS, I decided to take a look at the MSSQL extension for VSCode. This is an alternative to using SSMS for development work. This extension was updated in the fall of 2024, but I hadn't had a reason to use it. I mostly use SSMS, and on occasions ADS, but this was my opportunity to check out the alternative editor. This post looks at installation, connecting to databases, grouping those connections, and running queries.
Note: this tutorial assumes you have SQL Server installed somewhere. This is only a client to connect to an existing instance.
Installation
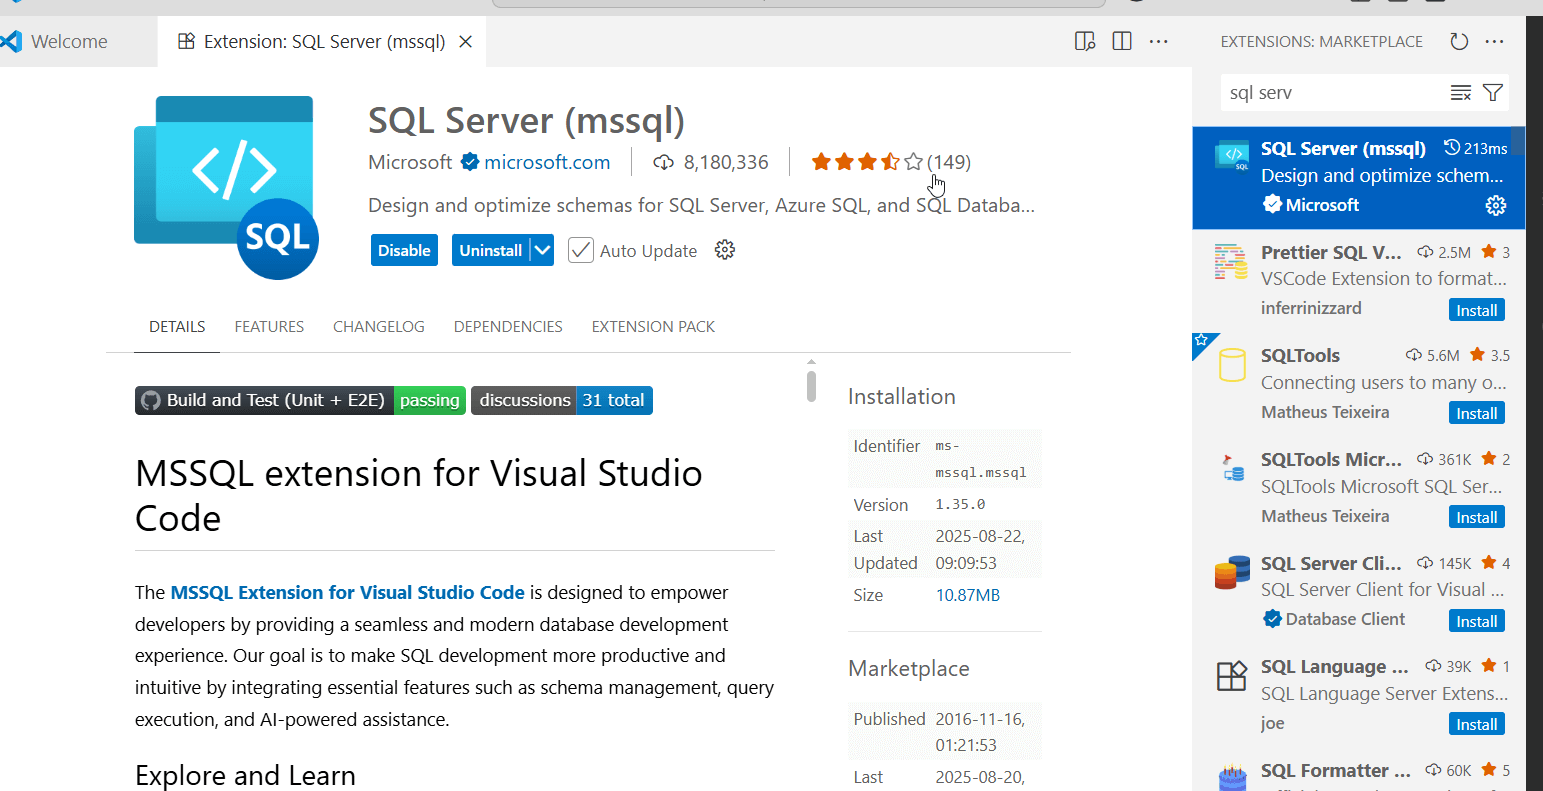
Installation of the extension is like any other one. Search for mssql in the list. You should see this extension published by Microsoft. Choose it and click Install.
Once it's installed, you should see it in the sidebar. If you have a lot of extensions (like me), then it might be under the three dots at the bottom. This is how it often appears for me, despite the fact a few of the extensions above here I rarely use.
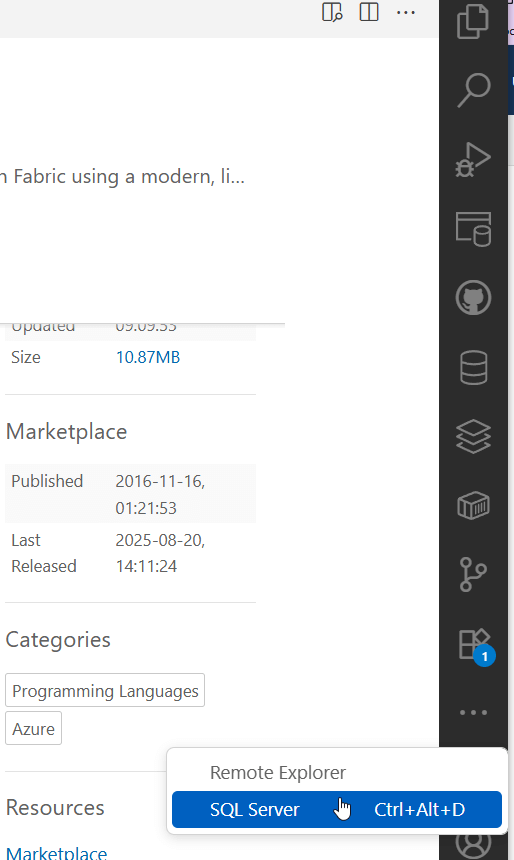
Once it's open, this is the icon you see in the sidebar.

Adding Servers
The first thing you will likely do is add some servers to the extension. This isn't integrated with SSMS, VS, or anything else, so you need to add the instances to which you want to connect. When you open the side blade, you should see something like what is shown below. There aren't any connections, but there are two options under the Connections pane at the top. There is also a Query History pane at the bottom.
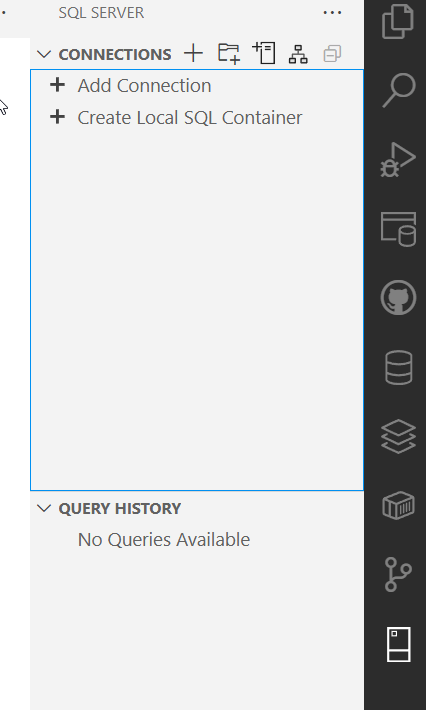
I will use the top item to add connections to servers. The bottom one with containers I'll cover in a future article.
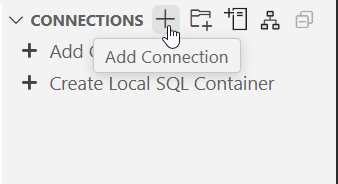
Click the "Add Connection" item, or hover near Connections and click the +. You can see how this appears below.
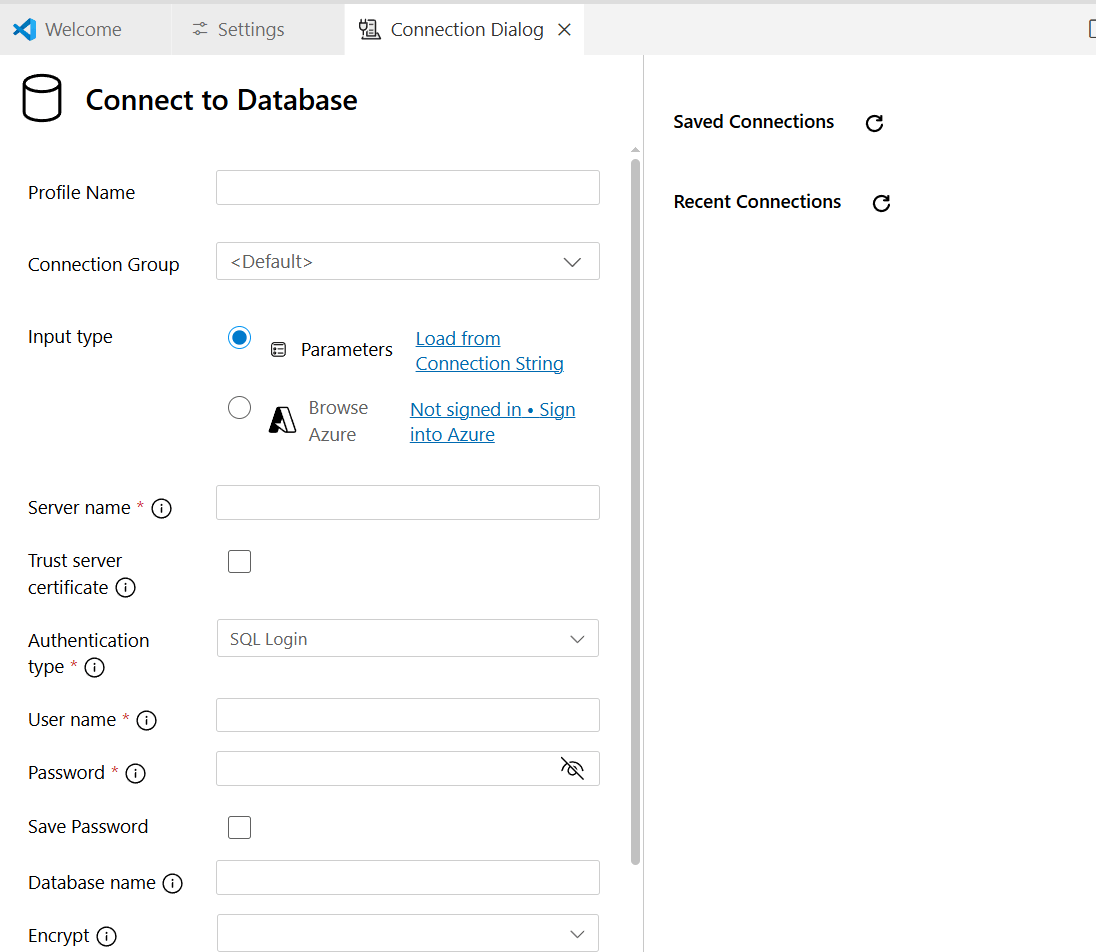
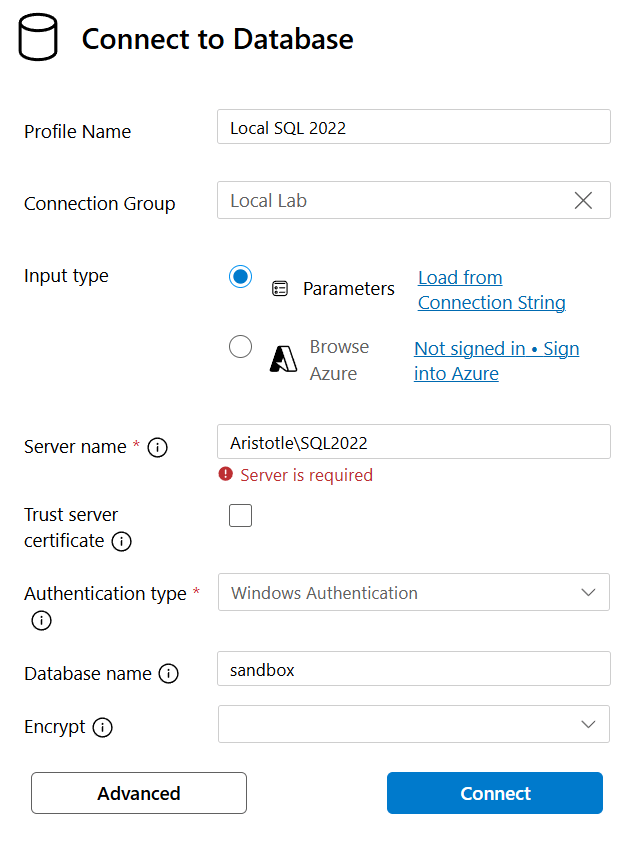
A new dialog opens in the main edit section of VS Code. Here I can add a useful name for the profile to connect to this instance. I also enter (optionally) a group and the rest of the items needed.
I'll fill in the basics for my server, as shown below. This is the minimum to get started, a name, instance, credentials, etc.
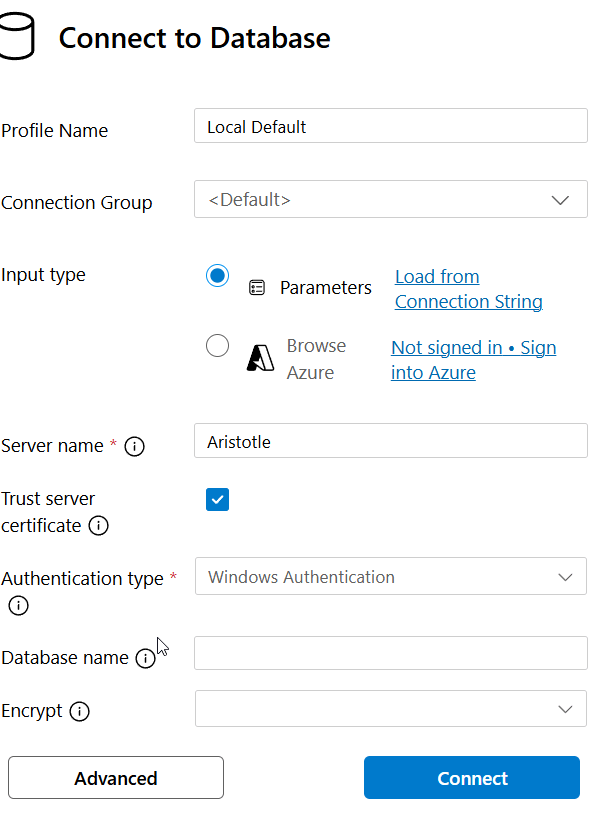
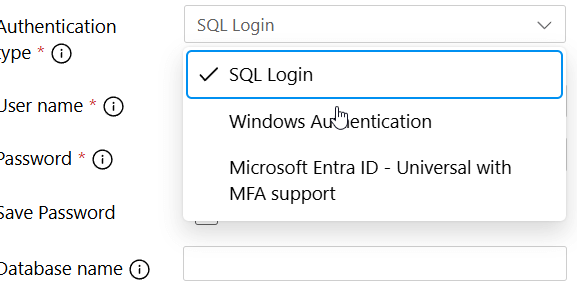
I like that I have not only the integrated and SQL auths, but also MFA with Entra.
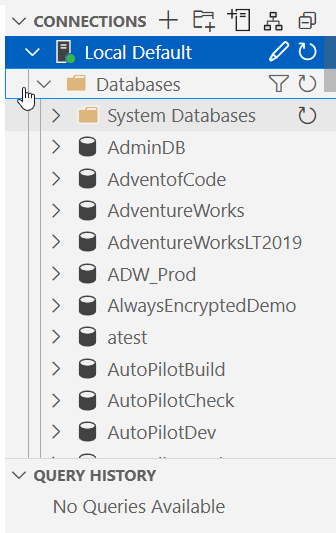
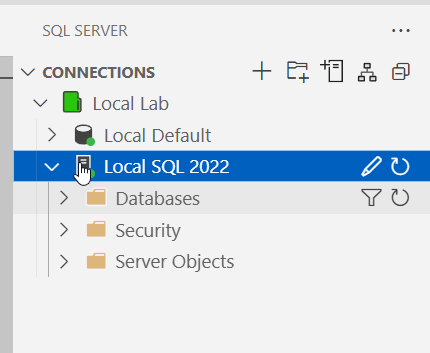
Once I click "Connect", the connection appears in the extension blade. The instance has a green circle icon next to it to show that I've successfully connected. I also see three subfolders for databases, security, and server objects.
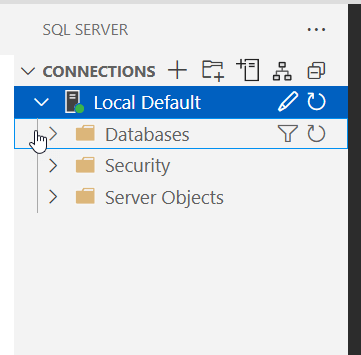
This is similar to the SSMS setup, though with less items. If I expand Databases, I see what I expect.
Likewise, Security has the instance level security objects.
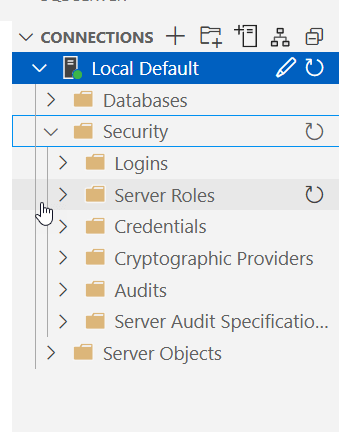
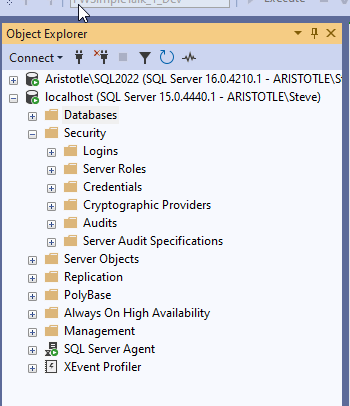
This is the same list as in SSMS
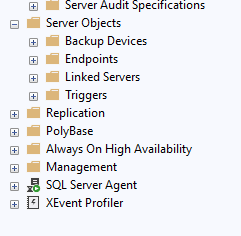
Server Objects are these: Endpoints, Linked Servers, Triggers, and Error Messages.
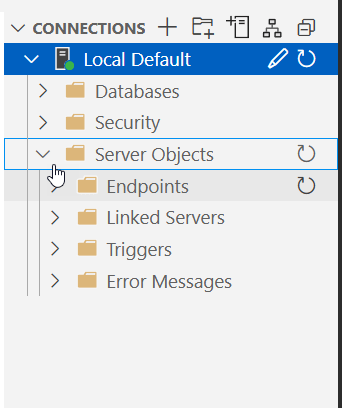
This is different than SSMS, which has Backup Devices and not Error Messages.
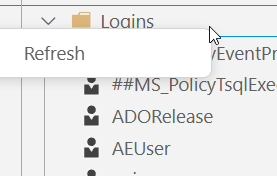
One thing I found interesting is that for most of these objects, if I right click, I only have "Refresh". In SSMS, I have lots of options for most items. This means you need to use code (or SSMS) to change things. This isn't a replacement for SSMS for a DBA or sysadmin. As an example, I right clicked Logins and saw this.
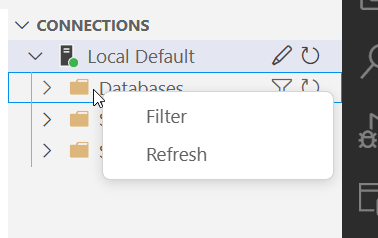
One exception is when I right click Databases, I see a Filter option.
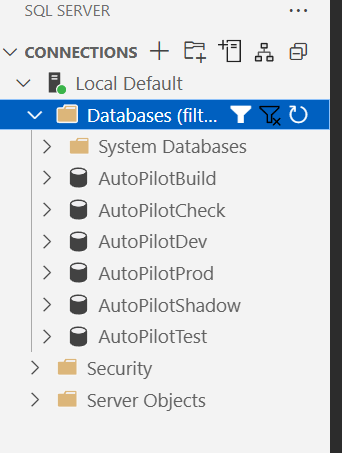
If I choose Filter, I get a dialog in the main pain where I can enter filter criteria. I've used name here, which is what I filter with to show only my "Autopilot" databases.
Another exception is if I right click the profile name. Then I see a lot of options. I have a few extensions installed, like Database Projects, so you might see something lightly different if you haven't got the same extensions.
Grouping Servers
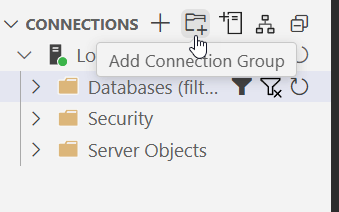
I skipped adding a connection group before, but I find these handy. These are ways of grouping instances together so if you deal with dozens of servers they aren't in one long list. To add a group, I can hover over "Connections" and I see a few icons. The second one is for adding a group.
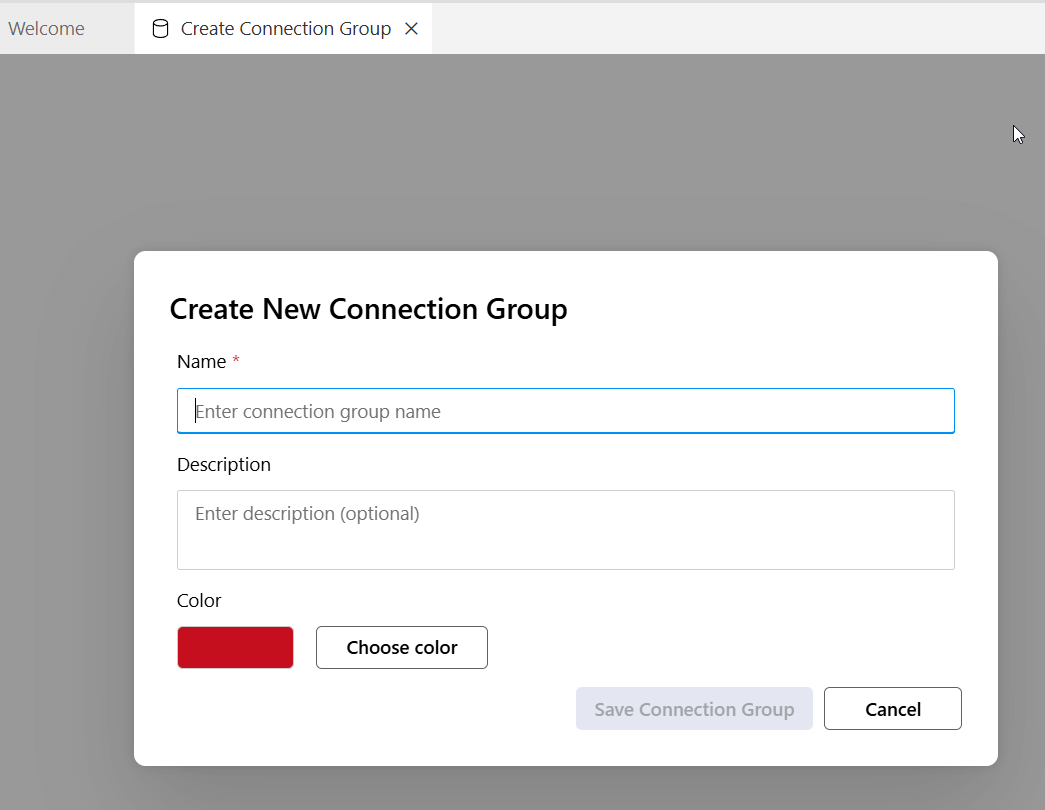
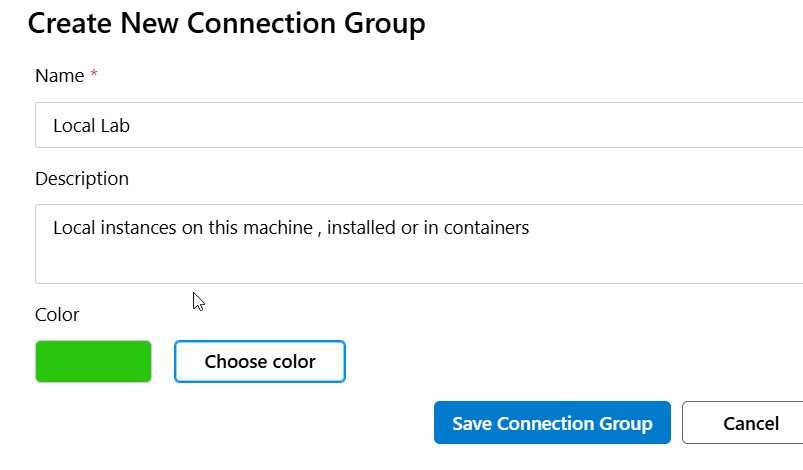
If I click this, I get a Create New Connection Group dialog, as shown here. I entered the name and description. I can optionally choose a color. The default is red, but I tend to like Green for my lab, since then I know I can do more crazy stuff to the servers. Here's the blank dialog.
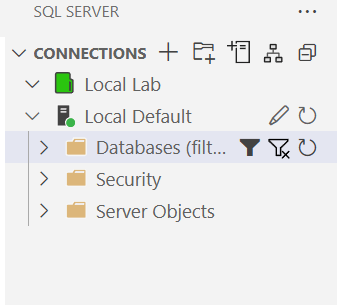
After creating this, I see it in the blade. Note that the instance I added isn't in here.
To see my details, I can right click the group. I have the options to edit or delete this, or add a connection under it.
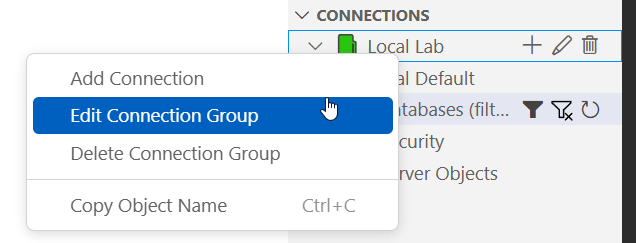
If I choose edit, I see the details I entered before.
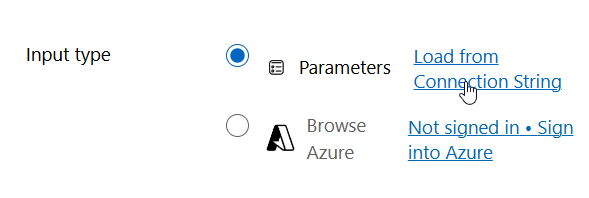
I can also drag my existing connections onto this group in the blade, which I'll do. I'll also right click the group and add a connection. This gives me, as you'd expect, the add connection dialog. I'll add another instance here. This time, I'll choose the "load from connection string" option. This is really nice for developers, who might have connection strings already from an app.
This gives me a dialog popup, where I've pasted a string in.
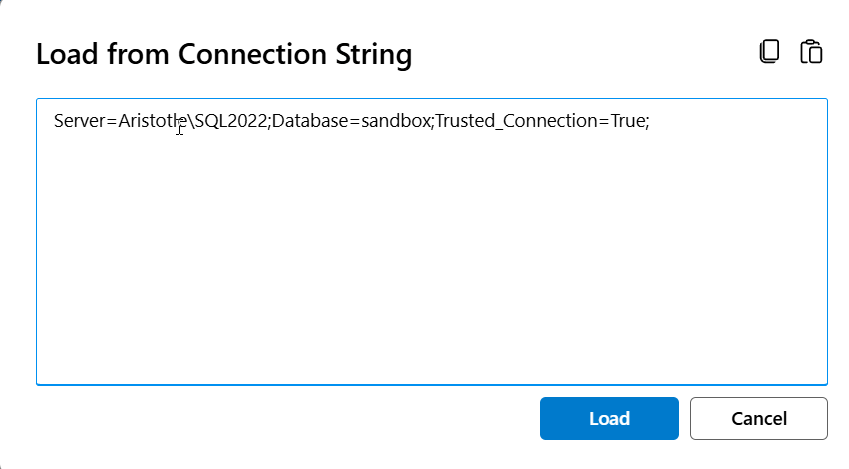
Once I click Load, this closes and I see things set in the connection. Note that the string didn't have "trust server" set, and it isn't checked here.
Once I connect, I see both servers in my group. These use the names I've given them.
You Need a Connection - A Failure
One thing I discovered when trying to add a few more servers is that I can't add a server if I can't connect. For example, I put in a bad password, and I get this login failed error:
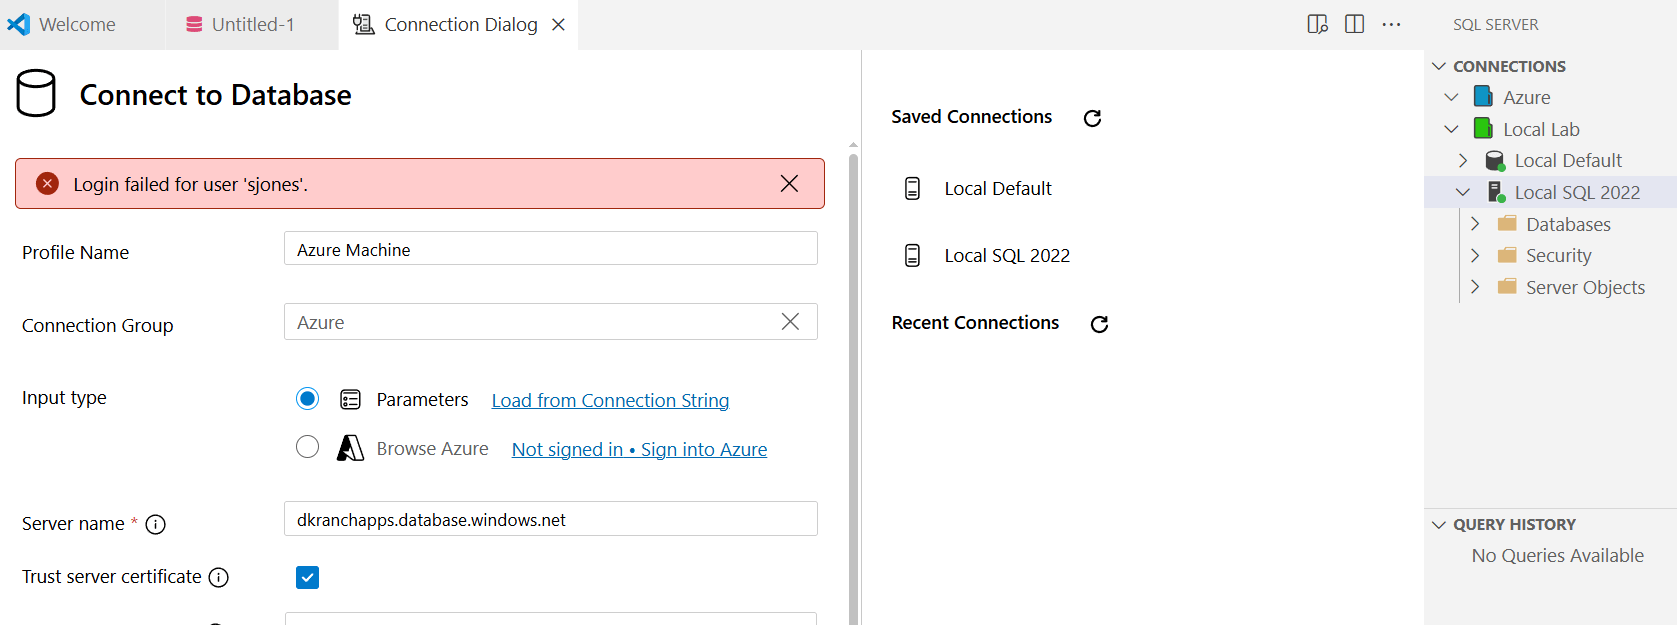
I had done this a few times, but look in the upper right. I had expanded my Azure group, but no server added. While I typically do connect, I might want to save this even if I couldn't connect. I find the inability to add (or edit) this without a connection to be a problem.
Fortunately, I can connect to anything, so I can add my local host again with a new name. Here I've added a few remote servers and some others in groups to see how I might organize things.
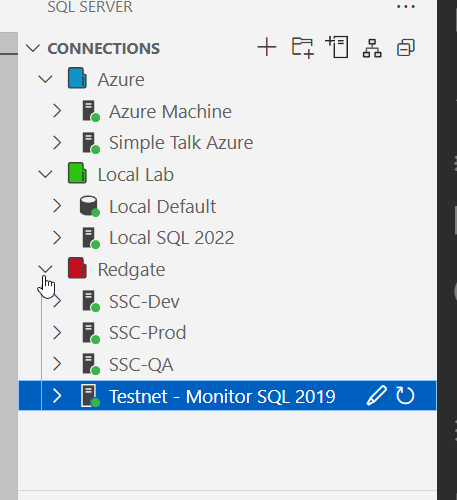
I can easily drag/drop servers between groups to move them as needed. In some environments, this would be very handy for me.
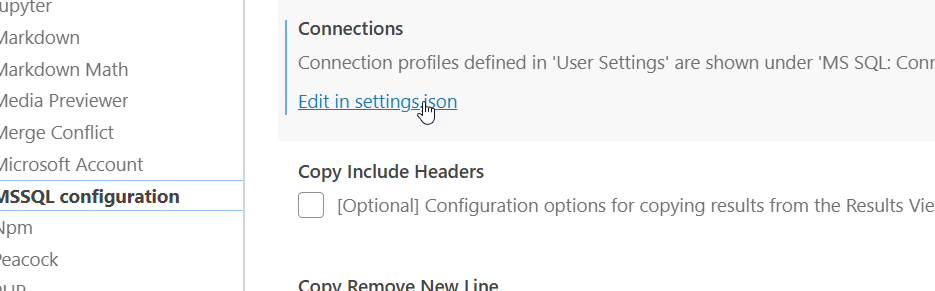
These groups are stored in the settings.jsonf or the edit. In the settings, if I go to Extensions and choose the MSSQL Configuration, I can see this entry.
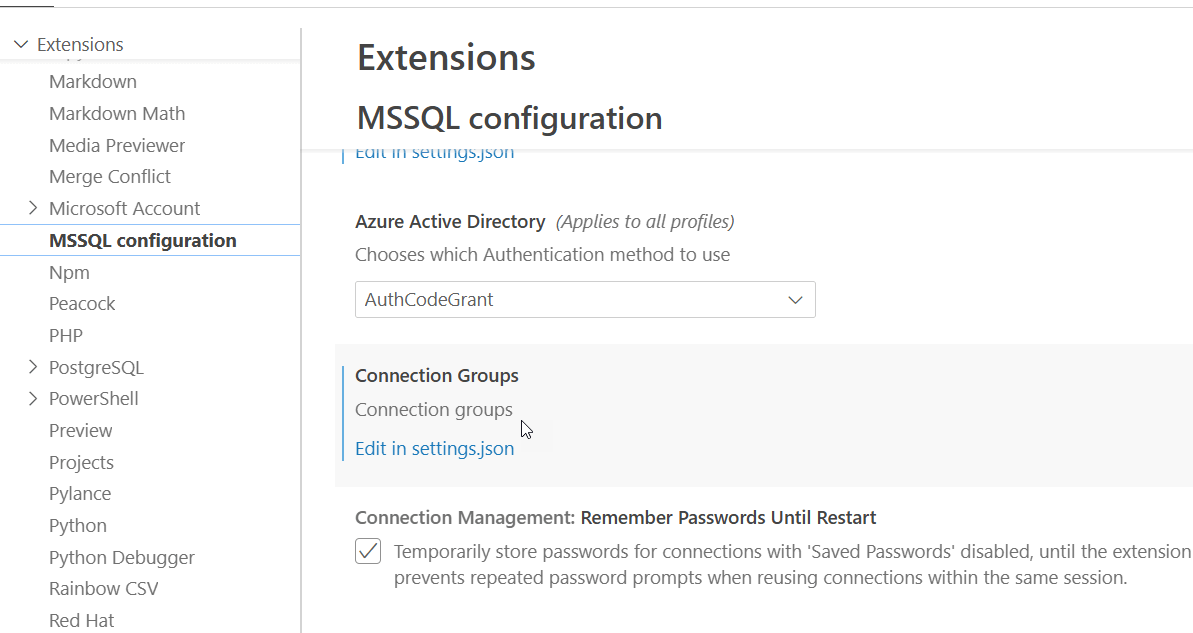
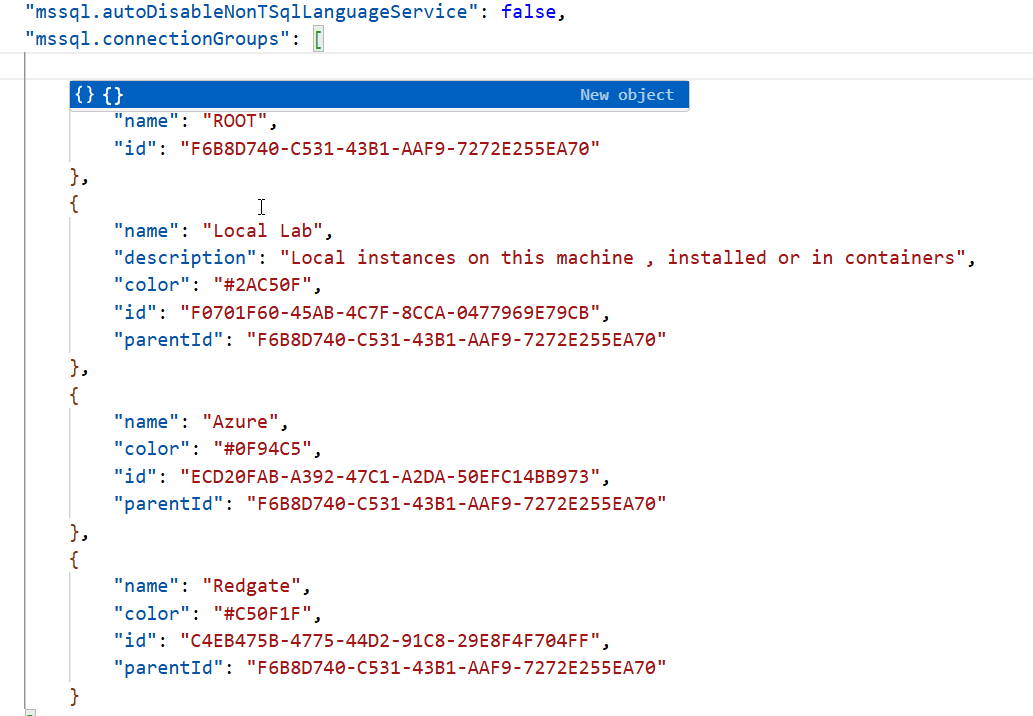
If I click the "Edit in settings.json", I get this view. Note that I only see the groups, not the instances. I could easily copy this from one person to the next, but this doesn't give my team members the list of servers.
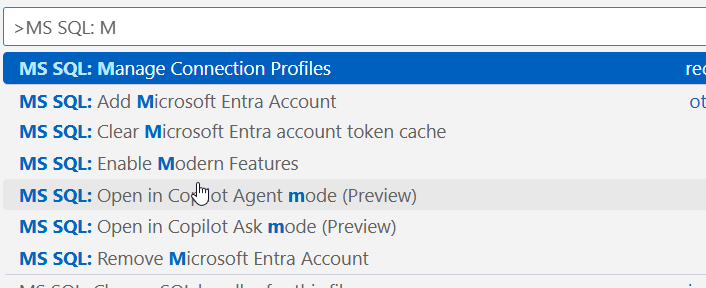
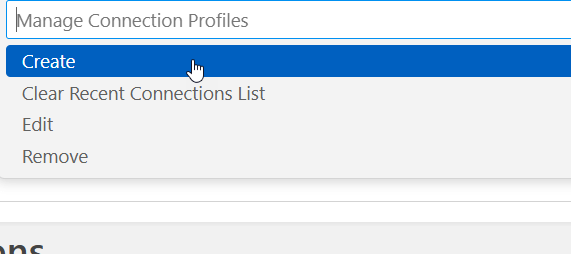
Just below the groups in the extension settings is the Connections item. You can also get this from the command palette and MS SQL: Manage Connection Profiles and choosing edit. You can see the Manage Profiles here:
Then you get the standard create/edit/remove list.
This is how it appears in the settings pane.
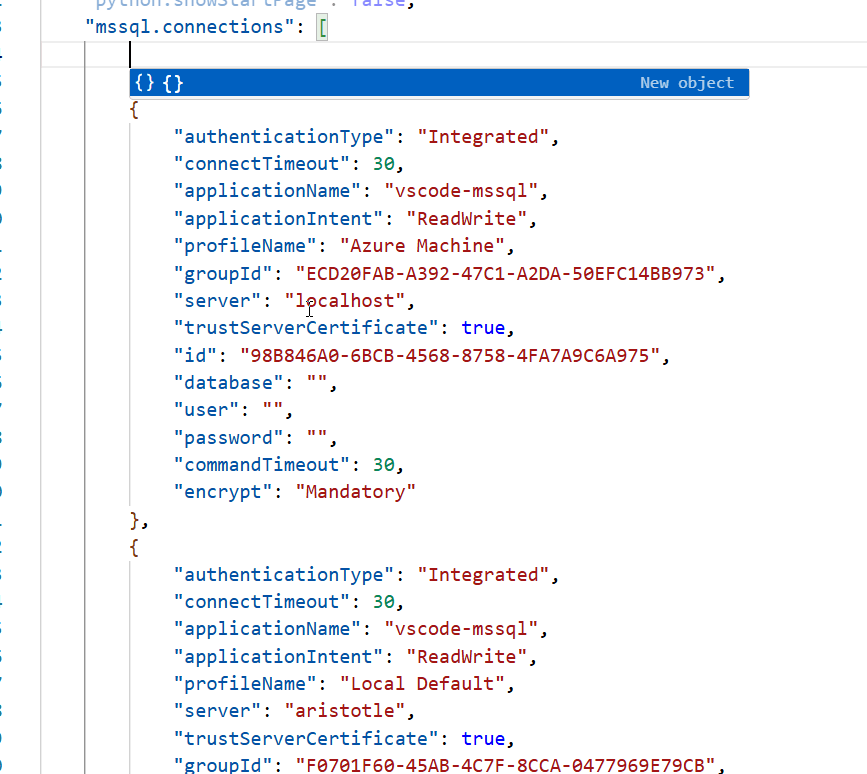
In the settings.json, there is an mssql:connections section where each connection is stored. The "id" value matches the item in the connection groups entry.
Running Queries
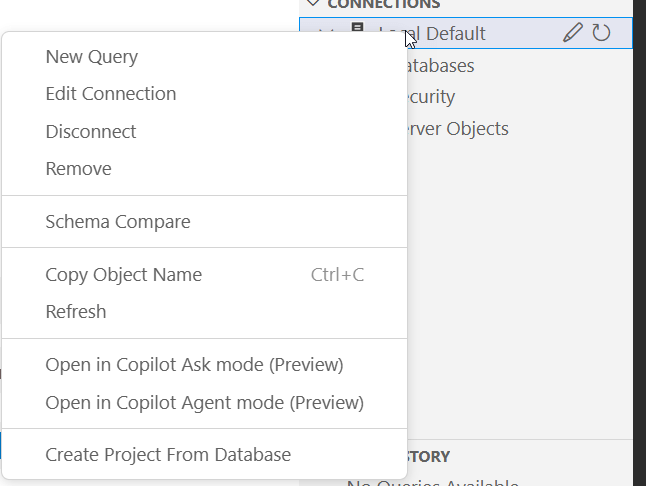
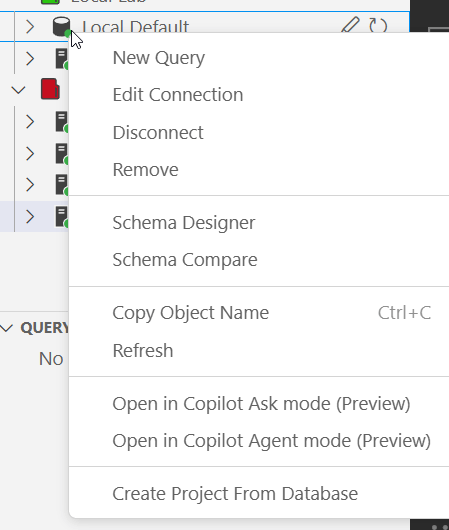
Now that we have connections, let's see how to run a query. If I right click a connection, I get a long list of options. One of these is New Query. You might have more or less items in your right click menu, depending on which extensions you have.
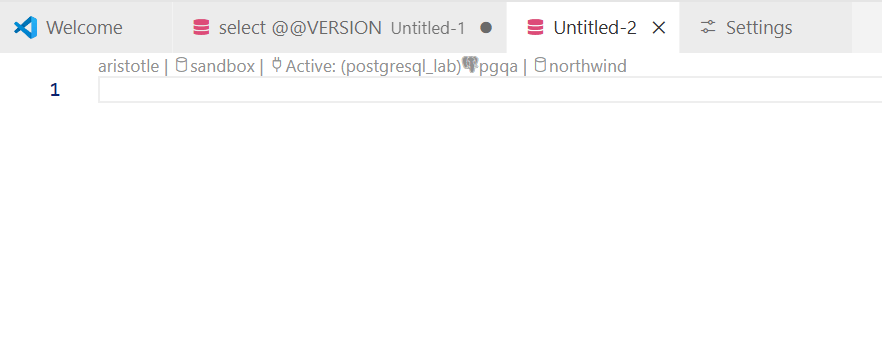
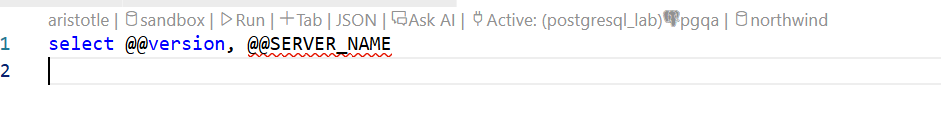
When this opens, I get a mostly blank window, as you see below. What's weird here is I have a MSSQL server (Aristotle), a database (sandbox) an "Active" item, which is a connection from my PostgreSQL extension, and a database (northwind), which is the one for that PostgreSQL Server. I assume this is some default stuff from VS Code and because I have PostgreSQL and SQL Server extensions, the ".sql" type is pulling in both items.
If I type a query, things change slightly. Here I'll add a little code for the server info. Notice that I now have a "run" with some optional items (Tab, JSON and Ask AI).
I didn't notice these, as they are faint, and instead, I looked in the upper right, where I have a series of options for this window in a toolbar. Note, these items blend in with your edit windows. These are the icons in this toolbar.
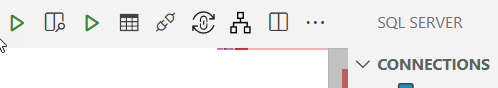
I have two "run" arrows and various other icons. In order, these are:
- Execute without parsing
- open preview to the side
- Execute query
- Reveal Query Result Pane
- Disconnect
- Change Database
- Estimated Plan
- Split Editor Right
- More options
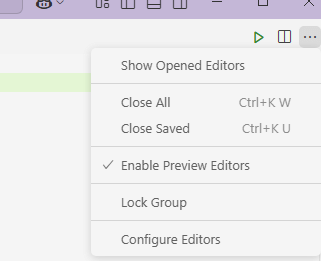
In the more options, I see these items.
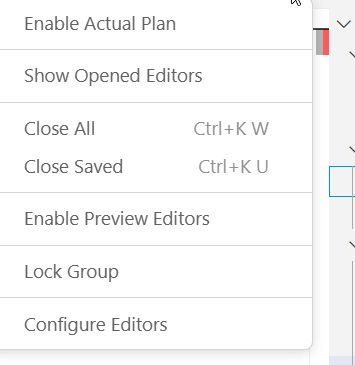
No matter how many windows I have open or how I resize things, this toolbar remains the same.
Not Executing
What I did, and a few friends have done, is click the first run arrow, which is the Execute without parsing. Everyone has gotten something like this:
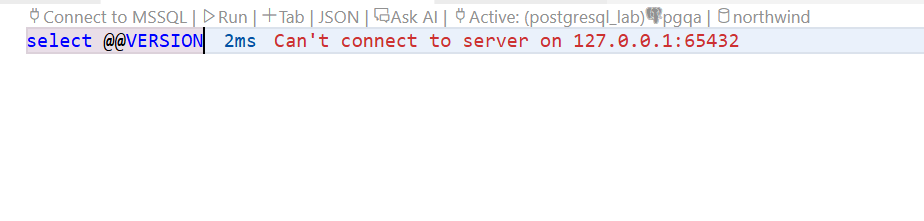
I have an active connection as I can hit the second run arrow and things work. Note the error hasn't disappeared.
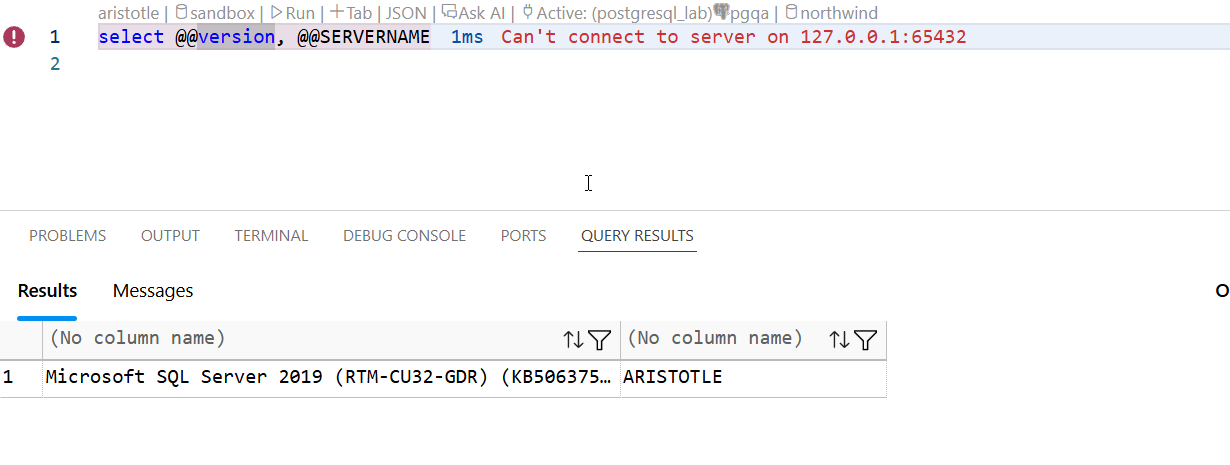
If I click the "run" wording above the code, I get the error as well, so not sure what's broken.
Too Many Weird Options
The way some things work here is a little weird. If I hit the "tab" wording, nothing happens. I don't know what this is supposed to do.
If I hit JSON, I get something very unexpected. Someone wants to get paid.
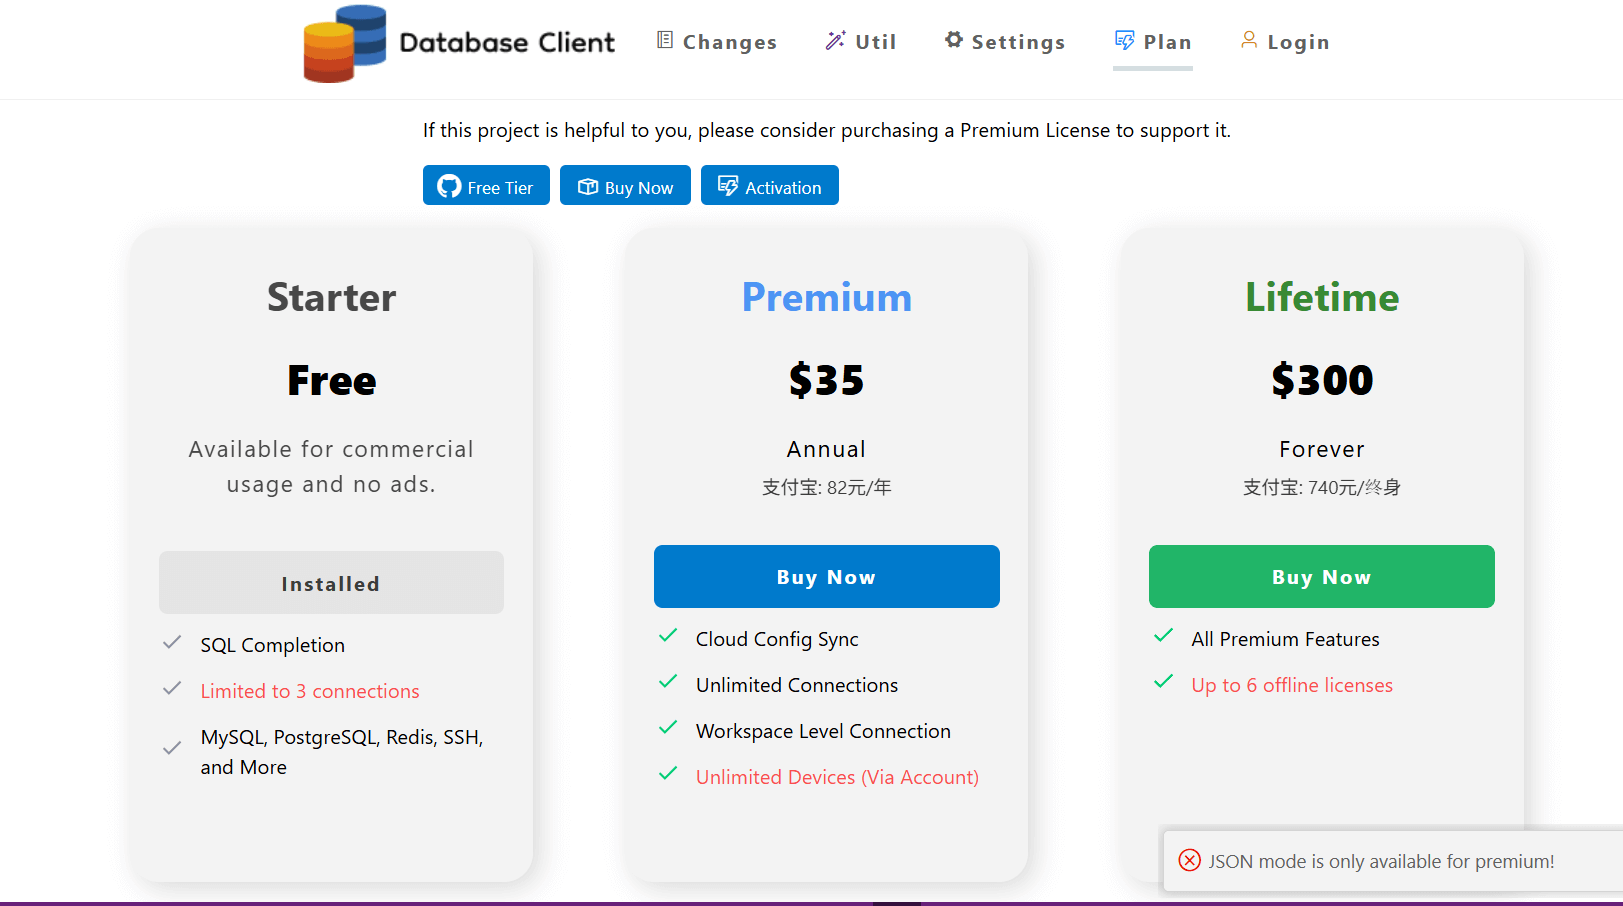
I had no idea what this was.
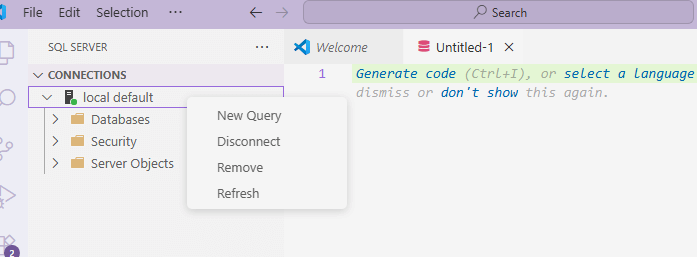
However, I created a new VM and noticed a few things. First, when I right click the server, I see this:
When I enter code, I don't see anything extra added.
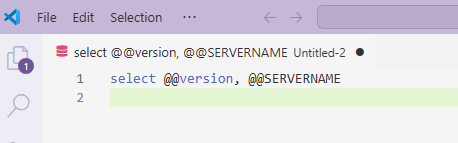
And my top toolbar only has one run arrow and few options.
What I have learned is that extensions in VS Code, including the MSSQL one, can conflict with each other and do some strange things. If nothing else, I urge you to be careful what extensions you use and be aware of what they might change.
Basic Execution
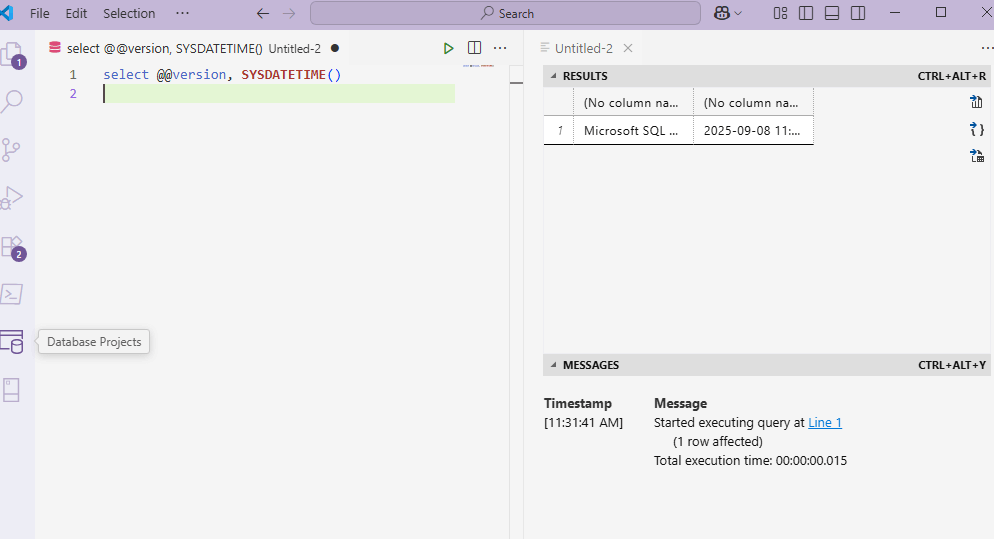
In my new VM, with a very basic VS Code editor, when I click the run button (or click CTRL+Shift+E), I get the results on the right side, with the messages below that. You can see this view below.
At some point I must have moved my results to the bottom. I right clicked the untitled-2 above and did a split and move to bottom. This didn't work, but VS Code crashed. When it opened, I had the query results in the output as a new tab.
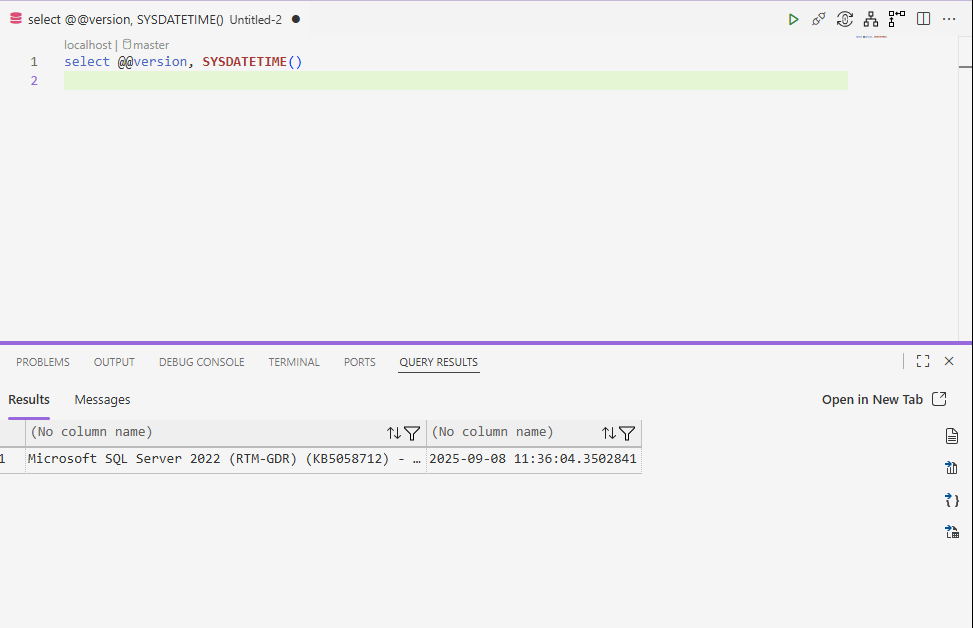
I can't reproduce this, so I would suggest you try what I did and restart VS Code, or Google how to move things. This feels semi-flake in terms of what I can do.
Text Results
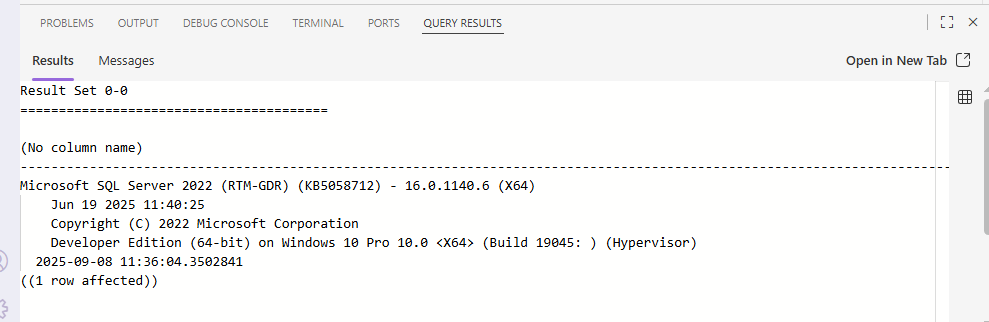
The default is grid results, which is likely what many of us are used to. If you want text results, the top icon on the right (above) that looks like a folder piece of paper does this. Click that and you will see your results moved to text. This happens instantly, so I don't think this is a re-execution of the query. In fact, when I tested with a WAITFOR, the results switch quickly.
The icon on the right, only a single one now, returns to grid results.
CSV Results
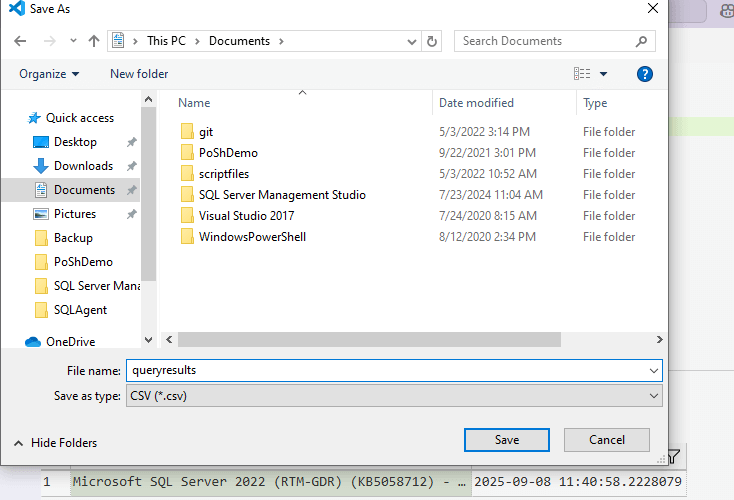
The second icon is for CSV results, which saves your data to a file. Clicking this brings up a file Save As dialog, where you can pick a file.
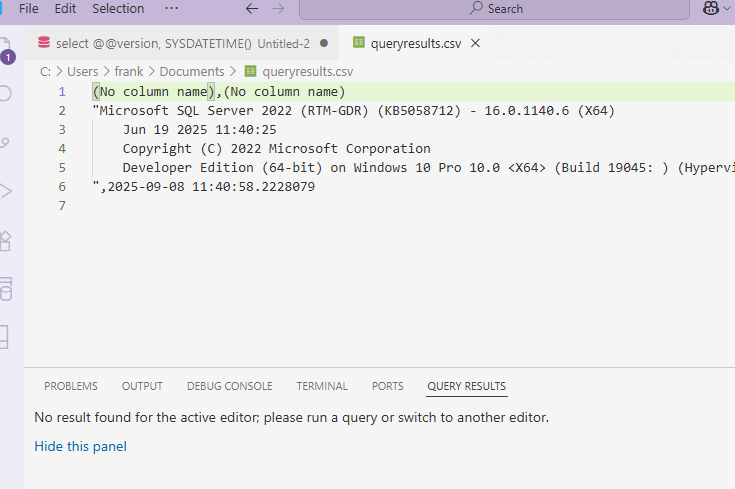
After I click Save, immediately my file is saved and then opened in VS Code. As you can see, this isn't a great example for a CSV, but there is a comma on line 6 for the second column.
JSON Results
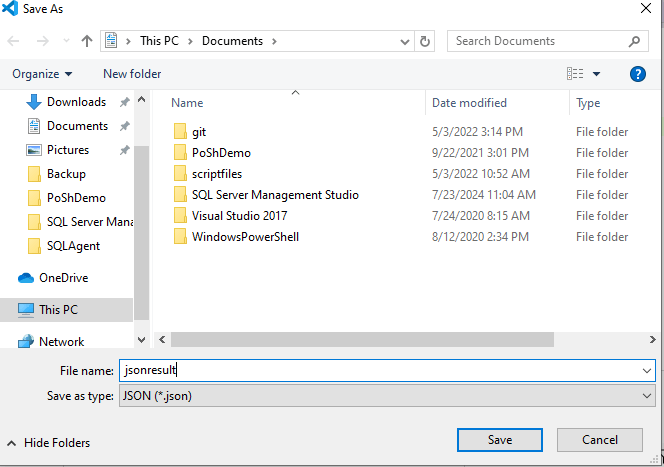
The next icon is for JSON. As with the CSV, I get asked to save a file.
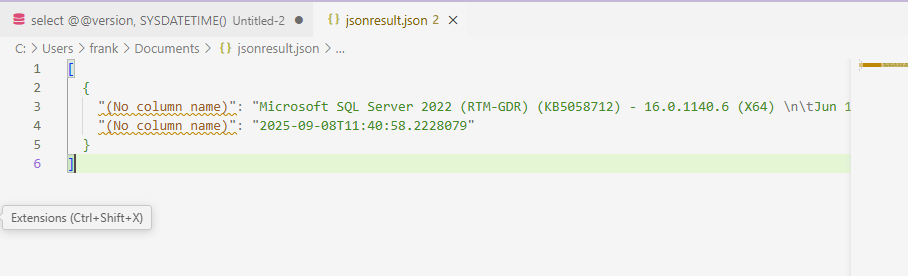
Once I click Save, it opens the JSON file I saved.
Excel
The last icon is for Excel. I get another Save As dialog, but since I don't have Excel, nothing happens. I can see the file below.
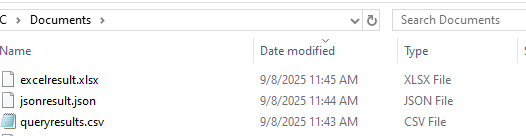
Note: On another machine, I got a message that the file was saved, and then Excel opened.
Not sure I like that.
Summary
This article showed the basics of the MSSQL extension in VS Code. We learned how to get started with this extension, add connections to servers, and then execute queries. Quite a bit of this might be intuitive, which is good, but this doesn't quite work as many might expect after using SSMS for some time.
The immediate opening of results isn't something I love. I can see why they do this, and a lot of times someone might need to look at the file, but often if I've saved this to Excel, it's because I'm sending it off, or I'll use it in another purpose and I don't want to see it. I didn't see a setting to disable this.
A future article will look at a few other features in this extension and some of the settings that you can configure.
