

Introduction
There is a huge difference between writing an SQL statement which works and one which works well and performs well. Sometimes developers are too focused on just writing their SQL to perform the required task, without taking into consideration its performance and most importantly its impact on the SQL Server Instance, i.e. the amount of CPU, IO, and memory resources their SQL is consuming. Thus, they starve other SQL Server processes during the SQL statement execution bringing the whole instance to its knees. This article is intended to provide the SQL developer with a set of easy checks to perform to try and optimize the SQL Statements.
A large number of books and white papers have been written to address SQL Server performance and this article will in no way substitute the depth and knowledge that can be found in these books and white papers. Its intention is to provide a quick check list to aid the developer in identifying any major and obvious bottlenecks that might exist in the SQL code.
Before attempting to solve any performance problem, the right diagnosis tools are needed. Besides using SSMS and the SQL Profiler, SQL Server 2008 comes with a number of DMV which provide a lot of information. In this article I'll be using SSMS and will make reference to a couple of DMVs to help in identifying our SQL bottlenecks.
So where do you start?
My first step is to capture the execution plan. This can either be done using SSMS or the SQL Profiler. For the sake of simplicity, I'll be referring to the execution plan captured from SSMS.
1) Check if you're missing any required table joins. This can easily happen and the output will be a Cartesian join, i.e. the product of the tables, something absolutely not desired. If, for example, the cross join is between two tables with 1000 rows each, the output will be a data set of 1000000 rows! Returning this amount of data will involve reading all the data from physical storage, therefore an increase in I/O, and then loading the data into RAM, specifically the SQL Server data buffer, thus flushing other data pages from the cache.
2) Check if you're missing any required WHERE clause. A missing WHERE clause will return more data than needed.The same repercussions for Step 1 apply here.
3) Check if statistics are being created & updated automatically. You can see this setting in the database properties.
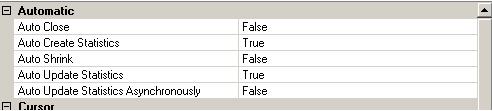
By default on creating a new database, the Auto Create Statistics and Auto Update Statistics are ON. Statistics are used by the optimizer to determine the best execution plan for the submitted query. This white paper does a great job to explain the importance of statistics and their use in effective execution plans. These settings can be checked by right clicking on the database, select Properties and Options.
4) Check if the statistics are up-to-date. Although statistics are automatically created, it is important that they are updated to reflect changes in data. On large tables, although the Auto Update Statistics option is enabled, the statistics can sometimes not reflect the actual data distribution. Basically, by default, statistics on large tables are updated using a random sample of the data. If the data is stored in an ordered state, it's very likely that the data sample does not reflect the actual whole data distribution. Therefore, it is recommended that on heavily updated tables, the statistics are recomputed on a scheduled basis using the Full Scan option. A job can be created and scheduled to run during less busy hours.
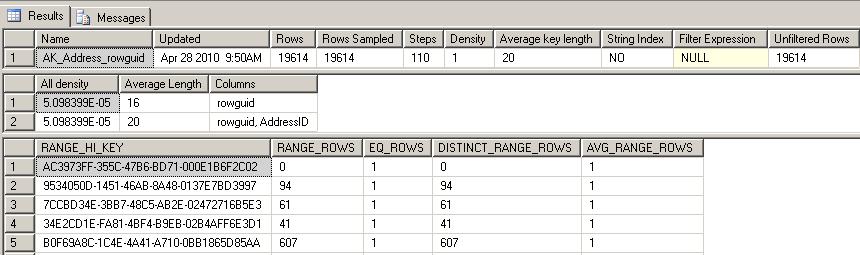
The DBCC SHOW_STATISTICS command can be used to view the last updated date-time, total table rows and the number of rows sampled. In this example, the statistics on AK_Address_rowguid of table Person.Address are displayed.
USE AdventureWorks;
GO
DBCC SHOW_STATISTICS ("Person.Address", AK_Address_rowguid);
GO
and here is the output.
Notice the Updated column and the Rows and Rows Sampled columns.
If you identify that statistics are out of date, the sp_updatestats stored procedure can be used to update all statistics for the current database using the sampling option
Exec sp_updatestats
Or else using the FULLSCAN option. In this case ALL statistics for the Person.Address table are recomputed.
UPDATE STATISTICS Person.Address WITH FULLSCAN
5) Check for any table or Index scans. Using the execution plan, it's easy to identify if the SQL statement is performing any table or index scans. In the majority of cases (assuming that statistics are up to date), this indicates that an index is missing. These three DMVs might prove useful to identify missing indexes:
i) sys.dm_db_missing_index_details
ii) sys.dm_db_missing_index_group_stats
iii) sys.dm_db_missing_index_groups
The following SQL Statement below uses the above DMVs and can be used to identify missing indexes ordered by performance impact.
SELECT avg_total_user_cost,avg_user_impact,user_seeks, user_scans,
ID.equality_columns,ID.inequality_columns,ID.included_columns,ID.statement
FROM sys.dm_db_missing_index_group_stats GS
LEFT OUTER JOIN sys.dm_db_missing_index_groups IG On (IG.index_group_handle = GS.group_handle)
LEFT OUTER JOIN sys.dm_db_missing_index_details ID On (ID.index_handle = IG.index_handle)
ORDER BY avg_total_user_cost * avg_user_impact * (user_seeks + user_scans)DESC
Alternatively, the Database Engine Tuning Advisor can be used to capture this type of information and make recommendations as to what indexes are needed to improve performance.
6) Check for RID Lookups. Again, using the execution plan, it's easy to identify RID Lookups. These cannot always be eliminated, but by making use of covering indexes, RID Lookups can be reduced.
7) Check for any sort operator. If in the execution plan sort operators are identified carrying a large % of the total query cost, then it might make sense to further investigate and basically, I'll consider these three options:
- Modify the underlining tables to create a CLUSTERED index on the required sort columns. There is always a debate on this approach, since it has always been a practice to use either the Identity column or an Integer column as the Primary Key and let SQL Server create a CLUSTERED Index on this Key. However it is worth trying out creating the CLUSTERED index on another column which is not the Primary Key.
- Create an Indexed view on the underlining tables and sort the view by creating a CLUSTERED Index.
- Create a NON CLUSTERED Index on the specified columns and Include all other columns which will be returned.
In another article, I'll expand on these three options and will compare the results to make it easier to decide the best approach in all instances.
9) Check for excessive index fragmentation. Index fragmentation can be easily viewed using the following DMV - sys.dm_db_index_physical_stats. If the fragmentation is greater then 30%, an index rebuilt is recommended, while an index reorganize is enough for fragmentation less then 30%. Index fragmentation increases the I/O required to read the index pages since the index is split across more index pages besides the extra pages which will occupy more space in the data cache, thus taking up more memory.
The following SQL will display a list of tables and indexes sorted by their fragmentation.
Declare @dbSysName;
Set @db = '<DB NAME>';

SELECT CAST(OBJECT_NAME(S.Object_ID, DB_ID(@db)) AS VARCHAR(20)) AS 'Table Name',
 CAST(index_type_desc AS VARCHAR(20)) AS 'Index Type',
 I.Name As 'Index Name',
 avg_fragmentation_in_percent As 'Avg % Fragmentation',
 record_count As 'RecordCount',
 page_count As 'Pages Allocated',
 avg_page_space_used_in_percent As 'Avg % Page Space Used'
FROM sys.dm_db_index_physical_stats (DB_ID(@db),NULL,NULL,NULL,'DETAILED' ) S
LEFT OUTER JOIN sys.indexes I On (I.Object_ID = S.Object_ID and I.Index_ID = S.Index_ID)
AND S.INDEX_ID > 0
ORDER BY avg_fragmentation_in_percent DESC
The following SQL can be used to rebuild all indexes for the specified table;
ALTER INDEX ALL ON <Table Name> REBUILD;
while the following SQL can be used to rebuild a specific index.
ALTER INDEX <Index Name> ON <Table Name> REBUILD;
Alternatively, indexes can be reorganised. The following SQL can be used to reorganise all indexes for the specified table;
ALTER INDEX ALL ON <Table Name> REORGANIZE;
while the following SQL can be used to reorganise a specific index.
ALTER INDEX <Index Name> ON <Table Name> REORGANIZE;
After organizing and/or rebuilding indexes, running the above SQL statement again will confirm the new fragmentation percentage (if any).
8) Check table locks. If the source tables are locked due to DML statements, the query engine may spend time waiting for the locks to get cleared. There are a number of steps to perform to overcome locking problems
- Keep transactions as short as possible. This is the first approach which should be taken.
- Review the transaction isolation level, and consider minimizing locking contention, thus increasing concurrency by changing to 'Read Committed using row versioning' or 'Snapshot'.
- Specify table hints such as READUNCOMMITTED or READPAST on the select statements. Although both of these table hints do increase concurrency, both have disadvantages such as 'dirty reads' when using the READUNCOMMITTED or returning an incomplete data set when using the READPAST and therefore they may not be acceptable to use in all circumstances.
Conclusion
This list in this article is by no means an exhaustive checklist on what needs to be done to improve SQL Queries. Nonetheless they should serve as a starter to quickly identify in most cases any bottlenecks and solve performance problems. As already stated in the introduction, the performance problem may lie deeper than this checklist is able to identify, such as CPU and/or Memory pressure and IO bottlenecks (and the list never ends...) and therefore more reasearch and reading will be neccessary to identify and solve the problem.
