
Introduction
An Analysis Services (SSAS) database contains analytical measures to show a business what it has done in the past as well as indicators of progress or regression. First, a project has to be created to import and process the data. This project can have the business logic for ratios that are beneficial to measure. The projects created in this series depend on a data warehouse that is in a dimensional model structure. Be sure to review the 2nd article in this series for the components needed to follow the stairway series.
This initial project will contain a few dimensions and one fact table including a measure. Results are displayed in Excel Pivot Tables. The Wide World Importers DW database is a typical data mart built on dimensional modeling patterns. The best practice for using Analysis Services is to source data from a dimensional model database. Other data sources outside of a dimensional model can be used so there is not a limitation of dimensional data.
The steps in this article are:
- Create an Analysis Services Tabular Model project
- Import data from World Wide Importers database
- Create a Measure
- Analyze in Excel
Star Schema
The Wide World Importers DW database follows a star schema from the dimensional modeling process. The star schema descriptor comes from a fact table in the center of the data diagram and dimensions as points of the star based on relationships. Figure 1 shows a star drawn over the sales fact and related dimension tables. Of course, you can have another number of dimension tables, but five illustrates the point about the star schema well. The relationship between a fact and a dimension table is built by a single key column that is a surrogate key. The surrogate key is a sequence number that is unique but is not the business key for a row of data.
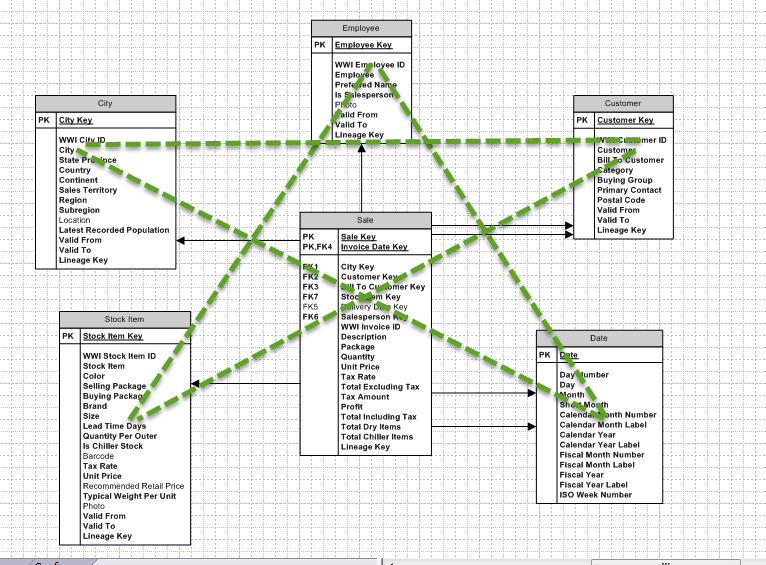
Figure 1 Sales Data Mart Star Schema
Creating a Project
The start of the project is in SQL Server Data Tools (SSDT). The new project is created in a solution in SSDT. Figure 2 shows the folder structure of a solution and project for this example.
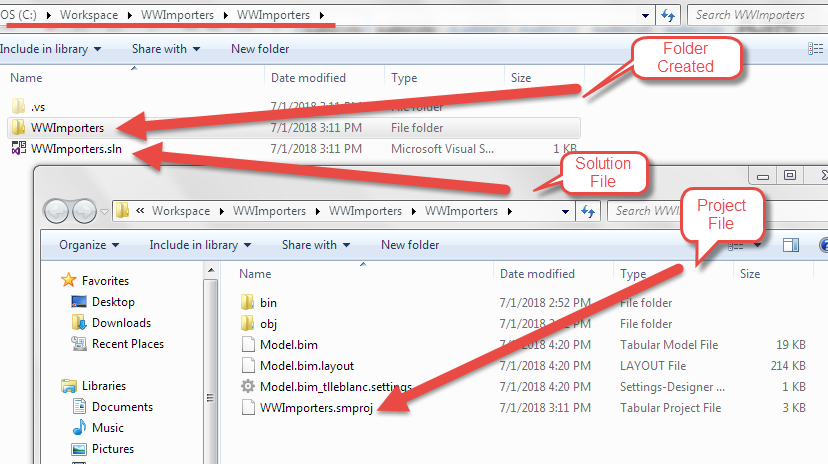
Figure 2 Solution and Project Folder Structure
The first item to plan is where you want the solution, project and model files to exist. The default is usually in the Documents folder under the Visual Studio 2017\Projects path. Creating a folder at the root of the C or other drive might be a better location. If a Source Control is being used, usually this location has already been determined. This example uses C:\Workspace\WWImporters which is linked to TFS.
Figure 3 shows the menu choice for creating a new project in SSDT.

Figure 3 Menu for New Project
The next screen has a lot to do with the creation and location of the solution/project. Figure 4 shows the Analysis Services Tabular project type, name of the solution, project name and file location as well as the Create a directory for solution and Add to Source Control options.
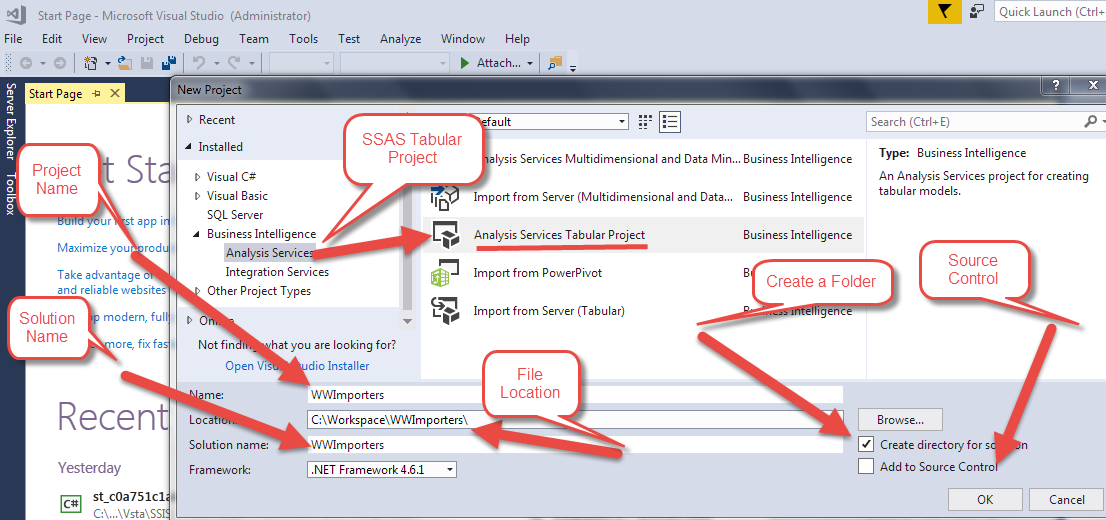
Figure 4 Solution/Project Creation
A project has to exist in a solution, so WWImporters in the name text box will be used for both. Once a solution is created, multiple projects can exist within that solution. The Browse button can be used to select the folder for the project. The Create a directory for solution check box can be used to create a folder for the solution/project if it has not been created. The name of the folder will be the name of the project. If source control is used, check that box as well.
The screen is going to ask where a Workspace database for this project will be maintained. Before 2016, this had to be created with an Analysis Services instance. The September 2016 release of SQL Server Data Tools added an option to use an integrated workspace. Both options create a workspace database to maintain the in-memory version to use as a development database. This works great for seeing errors or success as changes are made.
The workspace server uses an existing Analysis Services installation. The integrated workspace uses a service launched on the client machine to temporally hold the database while SSDT is open with the project. The integrated workspace service is started and stopped by the SSDT environment not by SQL Server Configuration Manager. This is useful for developers that do not have a development server or do not need extra services installed/running on the client machine.
Figure 5 shows selecting the existing Workspace server for development and that the Compatibility level is set for SQL Server 2017 / Azure Analysis Services (1400). The Azure option is only available at this compatibility level or higher

Figure 5 Workspace Database Selection
Once a workspace database is established, the project will have one main file where all the work is done. This file is named model.bim. Be sure the solution explorer is visible after the project is open as shown in Figure 6.

Figure 6 Model.bim opened with Solution Explorer
Figure 6 shows the solution explorer selected in the upper right tab. The Tabular Model Explorer is open initially, but the solution explorer needs to be selected if a property for the project or model.bim file needs to be changed. The Tabular Model Explorer is used to easily navigate to certain objects developed in the project. This new explorer was a welcomed edition with SSDT 17.x.
To Import tables, select the Model menu choice and then select Import From Data Source… as shown in Figure 7

Figure 7 Import Data
This example will use the WideWorldImportersDW database and import the sales fact and related dimension tables. Figure 8 shows selecting the Database option in the Get Data interface and then selecting SQL Server database as the type of data source.

Figure 8 Select SQL Server Database Option from Get Data
After clicking Connect, the next prompts ask for Server and Database names. Server, including the instance name, is required but Database name is not. The Get Data interface will search the server for existing databases and place them in a list for selecting if no Database name is entered. Figure 9 shows selecting an existing server and database name.

Figure 9 Server and Database for Get Data
The Credential window (Figure 10) will appear and this example will use Impersonate Service Account for connecting to the source data. This is a best practice for using connection credentials when using SQL Server database tables. See the second article in this series for more information about using a Service Account. Click OK if a screen appears about being unable to connect with an encrypted connection.

Figure 10 Credential Screen
Check the box next to Fact.Sale plus dimensions City, Customer, Date, Employee, and Stock Item. Clicking the load button as shown in Figure 11 will import the data into the model. The Data Processing screen will appear showing the progress or an error. You can click on the error link next to the table if there were problems. Click close after finished importing.
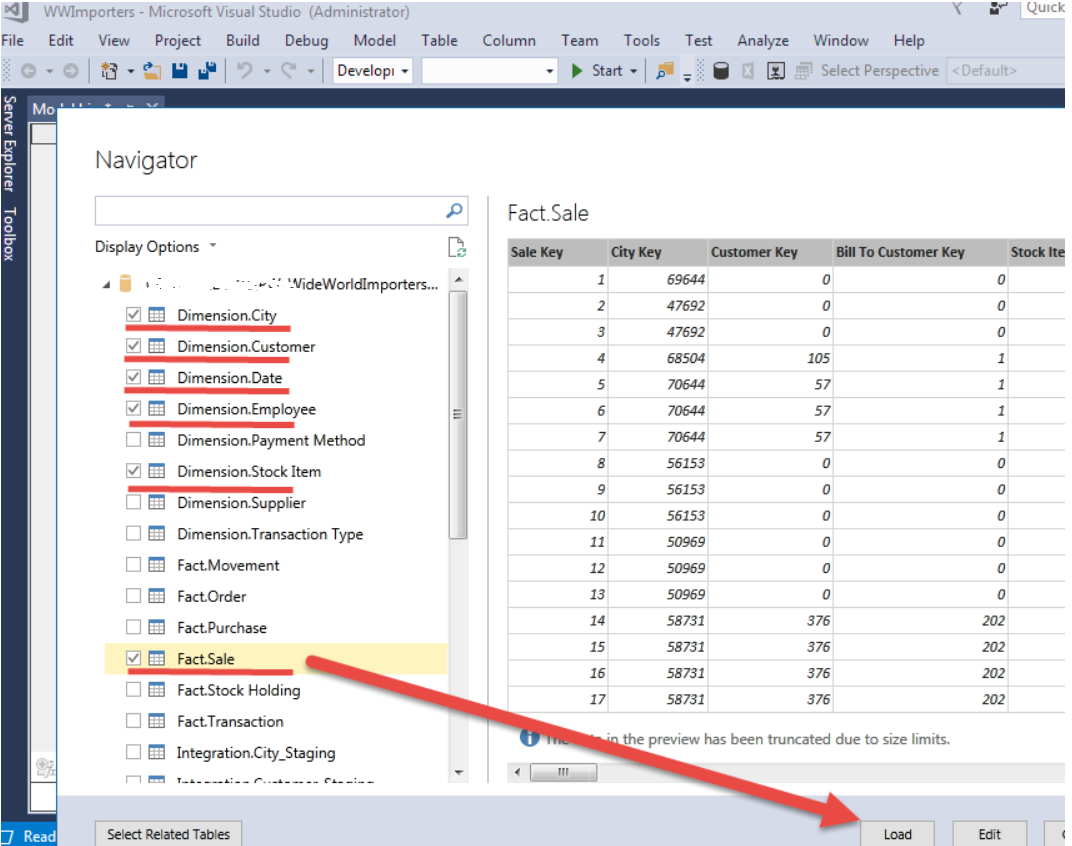
Figure 11 Importing Fact and Dimension tables
Microsoft provides a great interface to Excel PivotTables for previewing a Tabular Model. It is used in this context as the default viewer for the analytical database. The project needs one measure to Analyze in Excel. First, rename the Fact Sales table by right-clicking on the Fact Sales tab and selecting Rename (Figure 12). Rename the table to Sales.
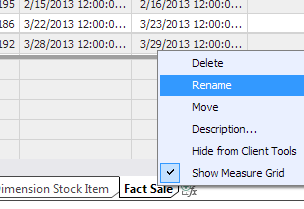
Figure 12 Renaming a Table in Model
To add a measure, make sure focus is in a blank cell below the Sales table data. Enter the following Measure in the cell:
Total Sales := SUM( Sales[Total Including Tax])
IntelliSense will help you with the syntax. Figure 13 shows changing the property Format to Currency for reporting.
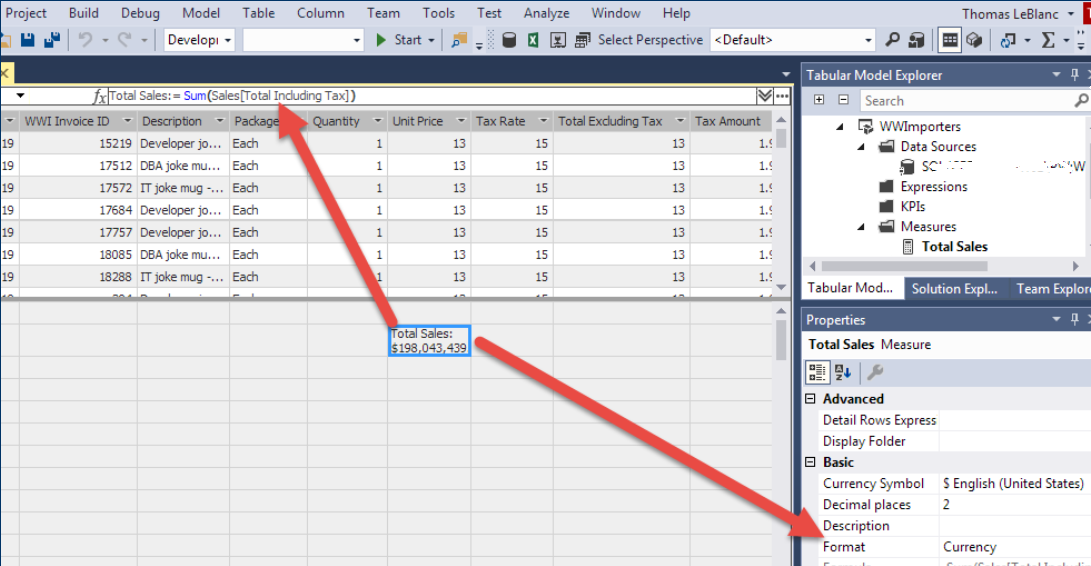
Figure 13 Total Sales Measure
Analyze in Excel (Figure 14) can be run through the Model menu choice or the Excel icon in the toolbar. Click Ok when prompted for user name, role, perspective and culture.
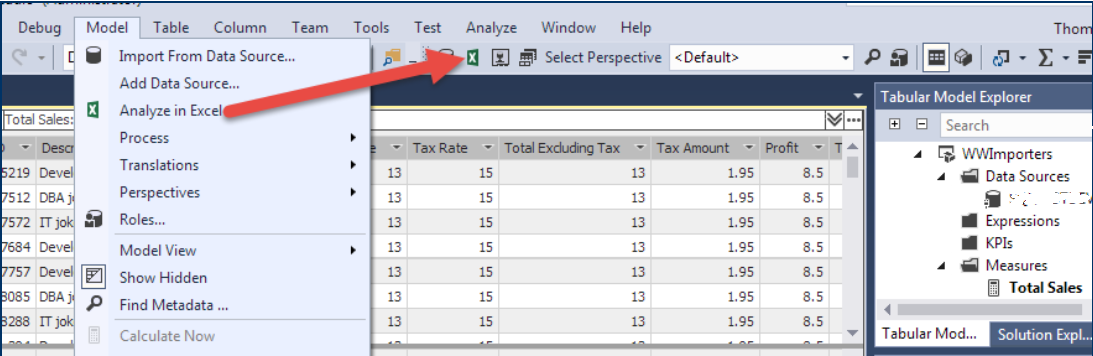
Figure 14 Analyze in Excel
When Excel opens, a pivot table will be created waiting for column, row and value selections. The value needs to be the measure Total Sales which is at the top of the PivotTable Fields list. The slicing can be any other column like City for rows and Calendar Year for columns (Figure 15).
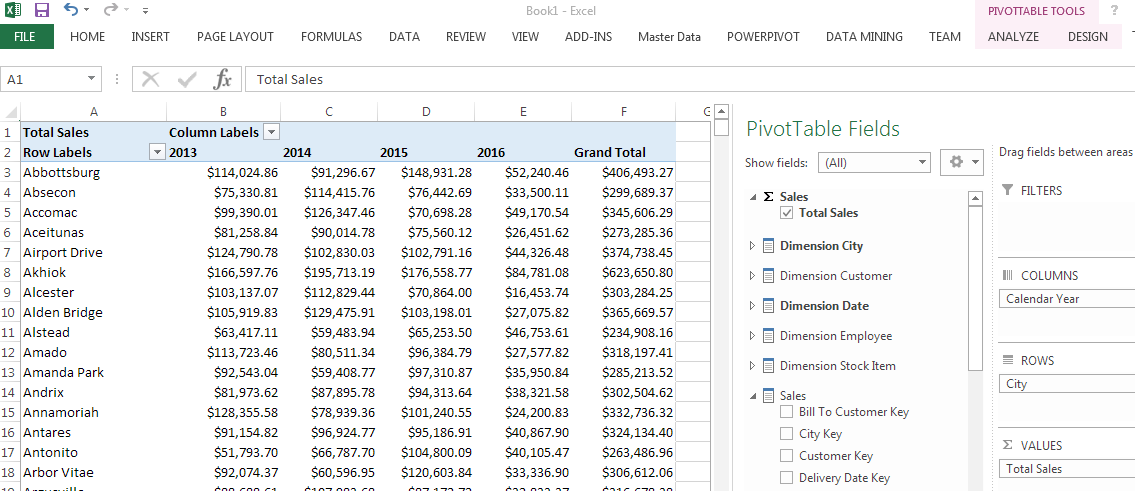
Figure 15 Analyze in Excel
Summary
This article showed a simple project to quickly get to a PivotTable in Excel. This is very powerful analyses after just creating a new Analysis Services project. The location and other properties must be selected as well as a workspace database. The view and connection in Excel is on this workspace database and not a deployed database. The dimensional model expedited the creation of this tabular model by containing measures in the fact table and slicer columns in the dimension tables. More work needs to be done to clean up the model, but the initial model has been started.