
Over the course of Level 1 and Level 2 of this stairway, we created some simple Extended Event sessions that were analogous to a typical SQL Trace configuration. In so doing, we encountered many of the basic components of the Extended Events engine, including events, predicates, actions, and targets.
In this level, we're going to dig a little deeper into the Extended Events engine, its architecture, and fundamental components. It will give you a deeper understanding of why, in general, an Extended Events session is inherently lower in overhead than an equivalent SQL Trace. We'll also investigate how to design our event sessions to minimize any unnecessary overhead during event data collection, even when we need to create relatively complex event sessions to investigate difficult performance problems.
Event data collection cycle
Events in Extended Events (XE) occur at various points in the code execution path of the SQL Server process, each event occurs when an executing task encounters that particular point in the code. For example, there are events for the start or completion of the execution of a stored procedure, the occurrence of a deadlock, an automatic update to statistics, and the acquisition or release of a lock.
When an executing task encounters one of these events, control passes very briefly, we hope, from that task's execution thread to the XE engine, which must, for each active event session that subscribes to that event:
- Collect the base payload data for that event
- Evaluate the predicate, which may require it to collect additional data
- Collect any actions if the predicate evaluates to true
- Dispatch the event data directly to any synchronous targets, or to the intermediate memory buffers to wait for dispatch to any asynchronous targets
Once all the data is collected, control returns to the task execution thread. The Microsoft Engineering team designed the new XE engine from the ground up, as re-writing the existing trace architecture would have been too costly. The XE engine is designed to minimize the performance impact of the event collection process, i.e. to minimize the time a task execution thread has to cede control in order for the XE engine to collect event data.
We discussed briefly in Level 1 a few of the manifestations of this effort to minimize overhead, including:
- The minimal number of event data columns each event collects in its 'default payload' (compared to all columns being collected for an event in Trace, and then discarded if not part of the Trace definition)
- Early predicate evaluation to avoid unnecessary data collection
- The availability of advanced 'pre-aggregating’ targets that can sometimes dramatically reduce the amount of data the engine would otherwise need to collect
However, there is still a lot that we need to consider when creating event sessions to ensure that our diagnostic tracing does not affect SQL Server performance, including choosing only the events and actions that are strictly necessary, learning how to use and design efficient predicates, and intelligent selection of a target for the event session. To better understand better the impact these choices can have, we're going to explore the various components of the Extended Events architecture in more detail.
The Extended Events Engine Architecture
The XE engine, which is part of SQLOS, is simply a collection of objects and services used to create the event session, manage it, and process the event data captured. The components mentioned previously, specifically events, actions, predicates, and targets, are not part of the core engine. These objects, along with types and maps, exist in packages, which reside within the various SQL Server modules, i.e. executables or DLLs. These modules (e.g. sqlos.dll, sqldk.dll, sqlservr.exe) are registered with the extended events engine when an instance starts, and the engine then interacts with the packages to make available the different events, actions, predicates, targets, maps, and types.
Modules and Packages
The packages are loaded into the XE engine to provide the different XE objects that we use when defining event sessions. Listing 1 will show us which packages exist, and list the modules from which they're loaded, run the following query.
SELECT  [p].[name] AS [Module] ,
        [p].[description] AS [Description] ,
        [m].[name] AS [ModulePath]
FROM    [sys].[dm_xe_packages] [p]
        JOIN [sys].[dm_os_loaded_modules] [m]
        ON [p].[module_address] = [m].[base_address];
GO
Listing 1
Running this query in the latest SQL Server 2016 release (build 13.00.2149.0) yields 13 different packages; to provide perspective, SQL Server 2008 RTM only had four. Listing 2 reveals which events are loaded by each package.
SELECT  [xo].[name] AS [EventName] ,
        [xo].[description] AS [EventDescription] ,
        [xp].[name] AS [Package]
FROM    [sys].[dm_xe_objects] [xo]
        JOIN [sys].[dm_xe_packages] [xp]
        ON [xo].[package_guid] = [xp].[guid]
WHERE   [xo].[object_type] = N'event'
ORDER BY [xo].[name];
GO
Listing 2
Events
The fundamental component of Extended Events is the events themselves. We can create an event session without any actions, predicates, or even targets, but it must have at least one event.
SQL Server 2016 CU1 offers 1303 different events, organized by channel. The four channels are Admin, Operational, Analytic, and Debug. You don't need to remember which event belongs to which channel, but be aware that events for only the first three channels are displayed by default in the UI. The Debug events are not displayed in the UI unless you enable that channel, and there is no way to have it enabled by default. When you query the sys.dm_xe_objects view, all events for all channels are listed.
When you add an event to an event session, whenever that event session is running, and that specific event is encountered, control passes to the Extended Events engine so it can capture the event data, as described earlier.
The first thing that happens when an event call occurs is the collection of a default set of elements for each event defined in the event session. This is the default payload for each event. The default payload is a minimal set of columns that are most relevant to the event, and the payloads vary from event to event. By collecting only a select number of fields for an event, there’s a reduction in overhead with Extended Events when compared to Trace. In Trace, all the fields for an event for were captured, and then those not configured for the Trace definition were discarded.
Listing 3 will get a list of the data elements captured by default for an event; in this example, the sql_statement_completed event.
SELECT  [object_name] AS [EventName] ,
        [name] AS [ElementName] ,
        [column_id] AS [ColumnID] ,
        [type_name] AS [ElementType] ,
        [column_type] AS [ColumnType] ,
        [capabilities_desc] AS [Capability] ,
        [description] AS [ElementDescription]
FROM    [sys].[dm_xe_object_columns]
WHERE   [object_name] = N'sql_statement_completed'
        AND [column_type] <> 'readonly';
GO
Listing 3
You can also view this information through the UI, as we saw in Level 2, by selecting the event within the Events pane, and viewing the Event Fields. The elements in the default payload cannot be customized, with slight exception. In the output from the query in Listing 3, the collect_statement and collect_parameterized_plan_handle elements have a ColumnType of customizable. When looking at the sql_statement_completed event in the UI, you might have noticed that in the output that those two elements have checkbox to the left of the field name.
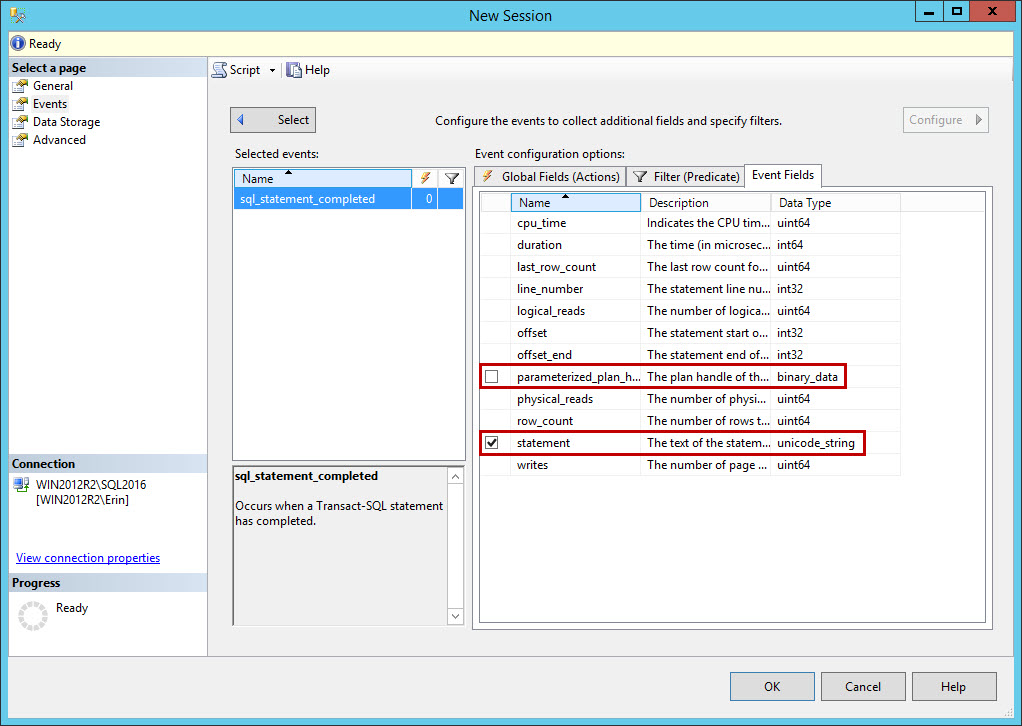
Figure 1
The event fields (a.k.a. data columns) with a ColumnType of customizable are optional event fields. We can capture them as part of the default payload, but we can also choose to not collect them. Often these are fields that may be of interest for collection, but they might be redundant (e.g. in the case of object_name and object_id).
While the capture of events with Extended Events has inherently lower overhead than Trace, there are still events that can introduce significant performance overhead in Extended Events. The showplan events are noteworthy: query_post_compliation_showplan, query_post_execution_showplan, and query_pre_execution_showplan. In fact, there is a warning within the description of these events, as shown in Figure 2.
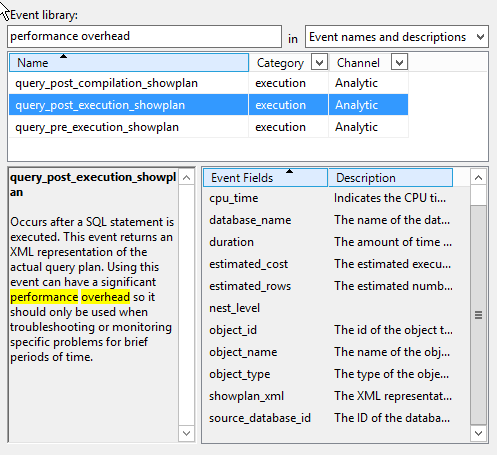
Figure 2
The showplan events have a significant cost, even with well-defined predicates, because the showplan_xml field is part of the default payload. Therefore, before predicate evaluation even occurs, the query’s plan has to be retrieved, which is an expensive operation.
Actions
If we need to collect additional event data columns, beyond those included in the base payload, or if we want another operation to occur as a side-effect of the event firing, we need to specify this explicitly by adding the appropriate actions to our event session.
As soon as an event call occurs, the XE engine captures the event's base payload (including any optional data columns that are enabled). It then evaluates the predicates defined for the event session (discussion shortly). Only if all of the predicates for an event evaluate to true will the event fire, and only at this point will any actions be executed, and the additional event data collected. Again, this is all part of the design to minimize data collection overhead.
Listing 4 returns the available actions.
SELECT  [xp].[name] AS [Package] ,
        [xo].[name] AS [Action] ,
        [xo].[description] AS [Description]
FROM    [sys].[dm_xe_packages] AS [xp]
        JOIN [sys].[dm_xe_objects] AS [xo]
        ON [xp].[guid] = [xo].package_guid
WHERE   ( [xp].[capabilities] IS NULL
          OR [xp].[capabilities] & 1 = 0
        )
        AND ( [xo].[capabilities] IS NULL
              OR [xo].[capabilities] & 1 = 0
            )
        AND [xo].[object_type] = 'action';
GO
Listing 4
The UI lists these actions in the Global Fields (Actions) tab. You can add the actions returned by Listing 4 to any event, but certain elements may not be available when the event fires. For example, the query_plan_hash cannot be collected for the sp_statement_starting event. Actions allow us to gather useful additional data for an event, but there is a cost to consider. The default payload data is part of the event, so when the event fires that data is already available. For any occurrence of the event for which all predicates evaluate to true, actions are executed synchronously. This means the XE engine has to collect that data, or execute some other action, on the task execution thread. Depending on the action or actions collected, this could impact performance. For example, adding an action such as database_id introduces less overhead than an action like tsql_stack, which has to unwind the entire stack for a query. Depending on the frequency of execution, and the query itself (for example, if it uses something like a user-defined function), the tsql_stack action could affect task execution. In addition, actions increase the amount of data captured for an event, and some actions require more storage than others (e.g. the callstack action would require a lot more storage than cpu_id). This is something to remember when configuring the event session options, as you can specify the maximum size for an event. If you configure the maximum size too small, then you will not be able to capture the event.
Some actions perform an additional operation, such as collecting information about the state of the event, or collecting a memory dump, when they execute. These side-effecting actions, such as memory dumps or debug breaks, should not be used in typical event sessions. There are extremely specific cases where they may be used in a production environment, but if you are not clear on what they are and how to properly configure the event session, it is not recommended to use them. If you want to see what they do (as in, you really want to force a memory dump as part of an event's execution) then try it in a test environment. You do not want to bring down your production environment because of an event session configured with a memory dump or debug break.
Predicates
Predicates establish the conditions under which an event will fire, and predicates in Extended Events offer us significantly more powerful and fine-grained filtering capabilities than were available in SQL Trace.
Within Trace, when a filter was set up, it applied to all events in the Trace. In XE, we can define different predicates for each event. In SQL Trace, there was no ability to configure AND/OR conditions for the predicate. In XE, this is the critical capability that allows us to 'short circuit' event execution as soon as possible in the event firing process, returning control as soon as possible to the task execution thread. Further, because predicate evaluation occurs immediately after the default payload is collected, actions will only be collected if the predicate evaluates to true. This is another area where XE shines over Trace, as again all columns for an event were collected in Trace and then unselected columns were discarded after the predicate was evaluated.
Listing 5 shows a very simple predicate condition, which stipulates that our event session will collect the sp_statement_completed event, but only if the associated statement performs more than 10,000 logical reads. For any statement that completes having performed less than that number, the event execution short circuits immediately, without executing any actions.
CREATE EVENT SESSION [MyEventSession] ON SERVER
ADD EVENT sqlserver.sp_statement_completed (  SET collect_object_name = ( 1 ) ,
                                              collect_statement = ( 1 )
    ACTION ( sqlserver.client_app_name, sqlserver.database_name )
    WHERE ( [logical_reads] >= ( 10000 ) ) );
GO
Listing 5
We can use Boolean expressions to create ' logical blocks' of predicate conditions. These logical blocks are critical, because as soon as any condition in a block of predicates evaluates to false, then evaluation stops and the event will not fire.
Listing 6 adds another predicate with an AND in between, creating two logical blocks. Now, in order for the event to fire, the number of logical_reads has to be greater than 10,000, and the duration has to be greater than one second (1000000 microseconds).
CREATE EVENT SESSION [MyEventSession] ON SERVER
ADD EVENT sqlserver.sp_statement_completed (  SET collect_object_name = ( 1 ) ,
                                              collect_statement = ( 1 )
    ACTION ( sqlserver.client_app_name, sqlserver.database_name )
    WHERE ( [logical_reads] >= ( 10000 )
            AND [duration] >= ( 1000000 )
          ) );
GO
Listing 6
The duration predicate can be either milliseconds or microseconds, and can be verified for each event with the following query:
SELECT
   [object_name] AS [Event],
   [name] AS [Column],
   [description] AS [Description]
FROM  [sys].[dm_xe_object_columns]
WHERE [name] = 'duration'
ORDER BY [object_name];
Listing 7
If either of these predicates is false, the event will not fire, which is why the order of the predicates is important. In the example above, logical_reads is first, which means that if a query does not consume more than 10,000 reads, the evaluation short-circuits immediately. The code doesn't even check whether or not the duration was greater than one second. What if the order of the predicates was reversed? If duration > 1000 is first, then any statement in a stored procedure that completes in less than 1000 ms (1 second) evaluates to false and event execution will short circuit, even if logical_reads are greater than 10,000. Predicate order is important because the earlier a predicate evaluates to false, and thus short-circuits, the less work the engine has to do, and the lower the overhead. If the majority of my statements take less than 1 second, then it may be appropriate to put duration first in the predicate definition, because the majority of events will immediately evaluate to false.
In the previous example, we defined predicates on event fields that were part of the default payload for the event. However, we can also define predicates for global fields. In this case the XE engine has to collect that additional data in order to evaluate the predicate condition. It executes the collection synchronously, on the task execution thread, as discussed previously. Having captured the data, it evaluates the predicate. If it evaluates to false, then the event data collection terminates. If it evaluates to true, then any actions are executed and the event data is dispatched to either its target or to the intermediate memory buffers.
We can illustrate this further with the sample code in Listing 8.
CREATE EVENT SESSION [MyEventSession] ON SERVER
ADD EVENT sqlserver.sp_statement_completed (  SET collect_object_name = ( 1 ) ,
                                              collect_statement = ( 1 )
    ACTION ( sqlserver.client_app_name, sqlserver.database_name )
    WHERE ( [sqlserver].[database_id] = ( 7 )
            AND [logical_reads] >= ( 10000 )
            AND [duration] >= ( 1000 )
          ) );
GO
Listing 8
The database_id action is first, so the associated condition will be evaluated first. The XE engine collects database_id data column and event firing only continues if that value is 7. If most of my statements do not come from database_id of 7, having this predicate evaluated first is not most efficient.
Maps
Writing predicate conditions in T-SQL requires an understanding of maps. A map exists to relate the common or well-known name for a value to an alternate format, stored within the engine.
For example, consider the wait_info event, which captures information about waits within SQL Server. If you want to capture wait information about WRITELOG waits with a duration greater than one second, you would add the wait_info event to the event session, then configure a predicate on wait_type of WRITELOG. This is straight-forward in the UI, with SQL Server 2012 and higher, as it displays the wait_type values with their common names. However, if you want to write the event session using just T-SQL, or you're concerned about the maximum character limit for predicates (3000 characters), then you need to know the map to the WRITELOG integer format.
To find this information, use the sys.dm_xe_map_values DMV, as shown in Listing 9.
SELECT  [xmv].[name] ,
        [xmv].[map_key] ,
        [xmv].[map_value]
FROM    sys.dm_xe_map_values [xmv]
        JOIN sys.dm_xe_packages [xp]
        ON [xmv].[object_package_guid] = [xp].[guid]
WHERE   [xmv].[name] = N'wait_types';
GO
Listing 9
This query returns the map_key and its map_value for all wait_types. For the WRITELOG wait_type, the map_key is 181 in SQL Server 2016. Therefore, we can create an event session that captures WRITELOG waits greater than one second in duration using the code in Listing 10.
CREATE EVENT SESSION [Capture WRITELOG Waits] ON SERVER
ADD EVENT sqlos.wait_info (
    WHERE ( ( [wait_type] = ( 181) )
            AND ( [duration] >= ( 1000 ) )
          ) )
ADD TARGET package0.event_file ( SET filename = N'C:\temp\WaitInfo' );
GO
Listing 10
If you are creating complex and lengthy predicates, then using the map_key may be more efficient than using the map_value (WRITELOG, in this case). The map_key values can, and do, change between SQL Server versions and sometimes after service packs or cumulative updates. As such, it is important to always verify the map_key value after any upgrade.
Targets
Having configured the event session with the appropriate events, actions, and predicates, we will generally select the target for the event session data. A target is an event consumer; it is the final destination for event data. Targets can consume events synchronously, i.e. on the same thread that raises the event, or asynchronously. There are six targets available in extended events:
- event_file target – a basic file system target analogous to the trace file in SQL Trace, where data persists on disk after the event session is stopped
- ring_buffer target – basic in-memory storage location that does FIFO collection
- event_counter target – in-memory target that counts the frequency of occurrence of each of the events in the event session
- histogram target – an in-memory target that produces a histogram of event occurrence based on a single data column or action that is common to all events, or a column or action for a specific event
- pair_matching target – in-memory target that matches beginning and ending events, and only keeps events that have no pair (e.g. a begin transaction event that has no matching commit transaction event)
There is also an Event Tracing for Windows (ETW) target that is used by the Microsoft team for advance diagnostics, which we will not cover in this stairway.
The event_file and ring_buffer targets are both asynchronous and capture all event information in raw format. The event_counter target is synchronous and only captures how many times an event fires, based on its predicates.
The histogram and pair-matching targets are both asynchronous targets and also do not store raw event data, but rather store data that is aggregated in some way, based on the target configuration.
Event_file
The event_file target exists on disk and events are written to it while the event session is active. The data persists after the event session has ended, and so can be reviewed later on for analysis. The event data is stored in binary format, and is materialized as XML when displayed in the UI (or when queried via the engine using the sys.fn_xe_file_target_read_file function).
In SQL Server 2008 and 2008R2, event_file data was stored in two files, one which held the data and the other which held the metadata. In 2012 and higher, only one file is created with the .xel extension. When the engine creates the file target, it appends an integer to the filename which represents the number of seconds between January 1, 1700 and the time the event session starts. This ensures that a unique filename is generated every time the session starts. When configuring the event_file target, a maximum file size should be set, as well as the maximum number of rollover files (as was done when saving Trace data out to a file).
Ring_buffer
The ring_buffer target exists in memory, and stores events based on a first-in first-out methodology (FIFO). Configure the ring_buffer to have a maximum size in MB, and have a maximum number of events it will hold. Understand that depending on the size of the event(s), which is determined by the default payload and any configured actions, the number of events to keep may not fit in the memory allocated. When the ring_buffer is full, older events are aged out to make room for new ones. XQuery must be used to see what events have been collected in the ring_buffer, as data is stored in binary format. Repeated querying can display different data, depending on the frequency of events and the amount of memory allocated. In addition, all data that exists in the ring_buffer may not be displayed due to a known issue with sys.dm_xe_session_targets DMV which doesn't render more than 4MB of data (for more detail please see Jonathan's post, Why I hate the ring_buffer target in Extended Events). For this reason, and because the ring_buffer data is removed once the event session stops, the ring_buffer is not a good option for comprehensive or extended data analysis.
Event_counter
The event_counter target is synchronous and only captures how many times an event fires, based on its predicates. This target is memory-resident, and when the event session stops, the target (and its data) is removed. This target is typically used to verify that you are using the proper event in the event session (trouble-shooting event session configuration). It’s also helpful if you are unsure of a workload for an instance; using this target can help you understand how frequently an event will fire based on the predicate constructed.
Histogram
The histogram target was known as the bucketizer in the 2008 and 2008R2 releases, because it groups (or buckets) based on a selected element. For example, if you want to understand why statements were recompiling in your environment, you could use the event session definition in Listing 11.
CREATE EVENT SESSION [Capture WRITELOG Waits] ON SERVER
ADD EVENT sqlos.wait_info (
    WHERE ( ( [wait_type] = ( 181 ) )
            AND ( [duration] >= ( 1000 ) )
          ) )
ADD TARGET package0.event_file ( SET filename = N'C:\temp\WaitInfo' );
GO

CREATE EVENT SESSION [TrackRecompiles] ON SERVER
ADD EVENT sqlserver.sql_statement_recompile (  SET collect_object_name = ( 1 ) ,
                                               collect_statement = ( 1 )
    WHERE ( [sqlserver].[is_system] = ( 0 ) ) )
ADD TARGET package0.histogram (  SET filtering_event_name = N'sqlserver.sql_statement_recompile' ,
                                 slots = ( 11 ) ,
                                 source = N'recompile_cause' ,
                                 source_type = ( 0 ) )
WITH ( MAX_MEMORY = 4096 KB ,
        EVENT_RETENTION_MODE = ALLOW_SINGLE_EVENT_LOSS ,
        MAX_DISPATCH_LATENCY = 30 SECONDS ,
        MAX_EVENT_SIZE = 0 KB ,
        MEMORY_PARTITION_MODE = NONE ,
        TRACK_CAUSALITY = OFF ,
        STARTUP_STATE = OFF );
GO
Listing 11
The output in the UI will list the recompile_cause (numeric value) for each non-system recompile event and a count of the number of times it has fired. Once the event session is stopped, the data is removed. One limitation of the histogram target is that you can only group on one element. In the aforementioned scenario, it might be useful to also see which object is recompiling using object_id. If you wanted to group on two or more elements, you would have to capture event information in the event_file target or ring_buffer target, and then parse it manually. In addition, the histogram target has a limit of 256 distinct buckets. In Listing 10, we allocated 11 slots for the target, as there are currently 11 different recompile reasons for the event. Behind the scenes, the XE engine rounds the slot value up to the next power of two (16 in this case) for performance reasons, so there are truly only eight different slot counts that the engine will generate. When configuring the event session it is necessary to enter a bucket count higher than what you anticipate. If you do not allocate enough buckets for the distinct values which may be generated, then once the allocated buckets are filled, any values which do not fit an existing grouping will not be captured.
Pair_matching
The pair_matching target requires two events – a beginning and an end event – that you pair together based on fields that match between the two. When a begin event does not have a matching end event, it is written to the target. Events can be matched on one or more elements, and the elements to use for matching are critical to ensure that events are not missed, or captured incorrectly. Further, there are some cases where the 'begin' and 'end' events do not always have a one-to-one relationship. As an example, with the lock acquired and lock released events, the relationship is not one-to-one when lock escalation occurs.
A common use of the pair_matching target is troubleshooting timeouts and attention issues, using the sql_statement_starting and sql_statement_completed events. Note that matching is not done just on session_id, but also on tsql_stack, as these two together determine the uniqueness of the matched events.
CREATE EVENT SESSION [Find_Unmatched_Statements] ON SERVER
ADD EVENT sqlserver.sql_statement_starting (
    ACTION ( sqlserver.session_id, sqlserver.tsql_stack ) ),
ADD EVENT sqlserver.sql_statement_completed (
    ACTION ( sqlserver.session_id, sqlserver.tsql_stack ) )
ADD TARGET package0.pair_matching  (  SET begin_event = N'sqlserver.sql_statement_starting' ,
        begin_matching_actions = N'sqlserver.session_id, sqlserver.tsql_stack' ,
        end_event = N'sqlserver.sql_statement_completed' ,
        end_matching_actions = N'sqlserver.session_id, sqlserver.tsql_stack' ,
        respond_to_memory_pressure = ( 0 )
 )
WITH (  MAX_MEMORY = 4096 KB ,
        EVENT_RETENTION_MODE = ALLOW_SINGLE_EVENT_LOSS ,
        MAX_DISPATCH_LATENCY = 30 SECONDS ,
        MAX_EVENT_SIZE = 0 KB ,
        MEMORY_PARTITION_MODE = NONE ,
        TRACK_CAUSALITY = OFF ,
        STARTUP_STATE = OFF );
GO
Listing 12
Event and action information for the non-matched event is written to the memory target, which can be viewed in the UI or using TSQL to query the target. When the event session ends, the data will be dropped.
Summary
This level reviewed the main object that comprise our event sessions, including the events, actions, predicates, and targets, and with this basic foundation you can begin creating event sessions that extend beyond what you're used to doing with Trace.
The variety of available targets, along with the ability to create complex predicates, and different predicates for different events, allows new troubleshooting options, and more events to further diagnose issues and understand how SQL Server works.
Microsoft completely rewrote the XE architecture to make it highly extensible, and as low-impact as possible. A proper understanding of the XE architecture helps in the design of efficient event sessions that work within this architecture to generate low overhead, even for complex tuning tasks.
When writing event sessions, bear in mind the following:
- Don't add events unless you really need that data
- Don't add unnecessary actions
- Use predicate short circuiting to minimize data collection overhead, especially when collecting a lot of events, when using events that are likely to fire very frequently, or where the capturing events have inherently high overhead
- Choose your target wisely – consider both your analysis needs (e.g. using an aggregate target to let XE do the work for you) and the need to retain data long-term
Finally, remember that Extended Events is not just a replacement Trace. It does replace almost all functionality provided by Trace (minus the audit functionality, which is now in the Audit feature), and it also provides the ability to troubleshoot issues in a completely new way. Extended Events is a completely new method for capturing diagnostic data from SQL Server.