Level 1 described how to create a trace definition in Profiler, run it as a server-side trace in order to create the actual trace file on the server, and then convert the trace definition for that file into an Extended Events CREATE EVENT SESSION script, using Jonathan Kehayias' sp_SQLskills_ConvertTraceToExtendedEvents stored procedure.
Hopefully, it served as a useful bridge between what you already know about SQL Trace, and what you need to know in order to get started with Extended Events. Of course, it also provided an efficient route to start converting your existing library of traces over to Extended Events.
However, what about when we need to create a new extended events session, from scratch? Yes, we can define the event session in T-SQL, but with SQL Server 2012 and later, we have a UI fully integrated into SSMS, which allows us to define event sessions, start and stop them, as well as consume and analyze the target data directly in the SSMS UI.
In this Level, we'll walk through the basics of using the New Session dialog in the UI to create a new event session, define its events, actions and predicates, and establish a target for the session in which to collect the event data.
Getting Started in the UI
In SQL Server 2008 and 2008R2, there is no built-in UI for extended events. If you're using these versions, you will either have to define event sessions using T-SQL, or install Jonathan Kehayias' SSMS add-in (http://extendedeventmanager.codeplex.com/). If you use 2012 Management Studio, you can connect to an earlier version of SQL Server, but for 2008 and 2008R2 instances you will not see the extended events UI. Jonathan did create a separate installation of his add-in specifically for SSMS 2012, which provides a minimalistic UI for use when connecting to a 2008 or 2008R2 instance.
The lack of a UI in SQL Server 2008 and 2008R2 also meant that we had to write T-SQL and XQuery to digest the event data. However, fortunately, the SQL Server 2012 UI can read event file targets generated in 2008 and 2008R2, so it's worth installing SSMS 2012 and using the UI for event data analysis.
For the remainder of this stairway, I assume you're using the UI in SQL Server 2012 or higher. To access the extended events UI in SSMS, expand the instance, and within Object Explorer, navigate Management | Extended Events, and expand Sessions to see a list of event sessions that exist for the instance.
If you worked through Level 1, then you should see two built-in Extended Events sessions, AlwaysOn_health and system_health (we'll cover these in a later level), plus our custom-built XE_ReadsFilter_Trace session.
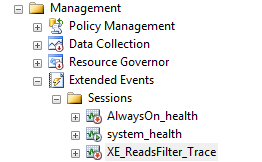
Figure 1: Viewing event sessions in the SSMS UI
As we noted in Level 1, one of the benefits of Extended Events is that event session definitions are saved in the server metadata, and so persist across instance restarts by default, whereas trace definitions do not; we had to implement a custom stored procedure to recreate traces after a restart.
We can also have multiple event sessions created, but not active. While this was possible with trace, it was not often used, presumably because the name for the output file was hard-coded into the trace definition, and if we wanted to stop and later re-start the trace, we had to ensure the output file was deleted before restarting the trace, or configure the trace to allow file rollover. Extended Events addresses this problem, as we'll see later in this level, in the Data Storage Page: Defining a target section.
Right-click on the XE_ReadsFilter_Trace session and select Script Session as | CREATE TO | New Query Editor Window to script out the session definition to a query window, as shown in Listing 1. The code is functionally identical to the code generated by the sp_SQLskills_ConvertTraceToExtendedEvents stored procedure in Level 1. However, you'll notice a few small differences in the script. Firstly, the scripted definition SQL Server stores no longer contains code comments mapping the Extended Events data columns back to their equivalent SQL Trace data columns.
Secondly, SQL Server incudes at the end of the script a WITH clause followed by some additional session-level options that we've not seen before (we'll be covering them in the next level). All the session option values are the defaults, which is the reason the trace-conversion stored procedure, in Level 1, did not need to include them in the generated script.
CREATE EVENT SESSION [XE_ReadsFilter_Trace] ON SERVER
ADD EVENT sqlserver.rpc_completed (
    ACTION ( sqlserver.client_app_name
    , sqlserver.database_id
    , sqlserver.server_instance_name
    , sqlserver.session_id
   )
    WHERE
   ( logical_reads >= 10000 ) ),
ADD EVENT sqlserver.sql_statement_completed (
    ACTION ( sqlserver.client_app_name
    , sqlserver.database_id
    , sqlserver.server_instance_name
    , sqlserver.session_id
   )
    WHERE
   ( logical_reads >= 10000 ) )
ADD TARGET package0.event_file (  SET filename = 'C:\temp\XE_ReadsFilter_Trace.xel' ,
                                  max_file_size = ( 5 ) ,
                                  max_rollover_files = ( 1 ) )
WITH (  MAX_MEMORY = 4096 KB ,
        EVENT_RETENTION_MODE = ALLOW_SINGLE_EVENT_LOSS ,
        MAX_DISPATCH_LATENCY = 30 SECONDS ,
        MAX_EVENT_SIZE = 0 KB ,
        MEMORY_PARTITION_MODE = NONE ,
        TRACK_CAUSALITY = OFF ,
        STARTUP_STATE = OFF )
GO
Listing 1: Scripting out the existing XE_ReadsFilter_Trace event session
We're now going to use the UI to create a new event session with the same events, actions and properties as our existing XE_ReadsFilter_Trace session, but a different name. At the end of the process, I'll relate what we've achieved in the UI to the T-SQL definition of the event session, generated by SQL Server.
Creating a new Event Session in the UI
We can create event sessions using either the New Session Wizard, or the New Session dialog. However, the Wizard provides only a subset of the options that exist in the New Session dialog, and therefore is not typically used. Therefore, we're going to focus exclusively on the New Session dialog.
To create a new Extended Events session, simply right-click the Sessions folder and select New Session.... The New Session dialog has four session property pages, General, Events, Data Storage and Advanced, and we start on the General page.
General session properties
On the General page of the Session Properties dialog, we enter a name for the event session and enable a few other event session options so that the event session starts running as soon as we create it, and we can use the live data viewer to see the event data, as it is generated.
Enter a name for the session, such as HighReadQueries to differentiate this session from the one we created in Level 1, as event session name must be unique.
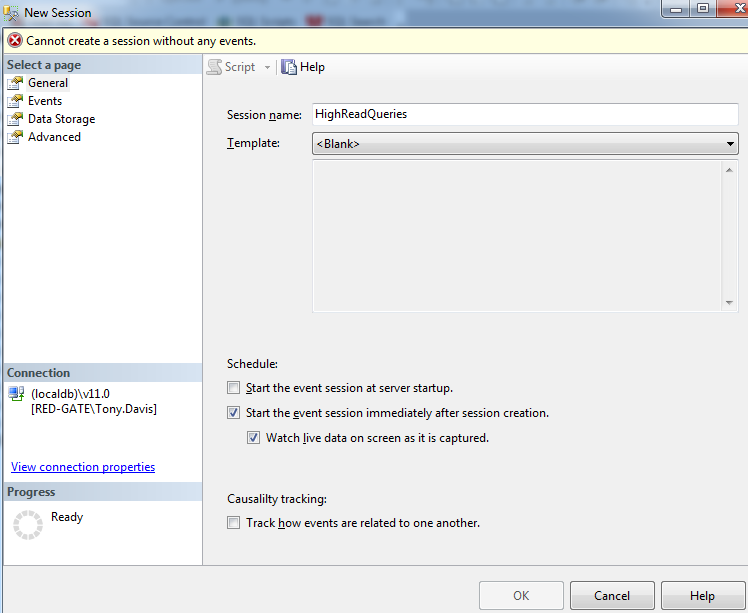
Figure 2: The General properties page of the New Session dialog
If you can't see the Causality tracking (or should I say "Causalilty tracking"; the spelling mistake is raised as a Connect item!) option, an advanced option that we won't cover until a later level, it may be that you've minimized the size of the dialog. In a correctly-designed UI, there would be scroll bar to indicate that you can't see the whole screen!
Events page
The next step is to add some events to our session. Switch to the Events page, where we can select the events we want to track, and configure them, setting the appropriate actions and predicates.
Adding events
In order to create an event session, we must add at least one event. In this example, we want to add two events, sqlserver.sql_statement_completed and sqlserver.rpc_completed. One thing I really like about the Events page is the ability to search the events library. I would bet that many of you have lost minutes...hours...days...scrolling through the list of the 180 events in Profiler, looking for the one you need. This is no longer an issue with the extended events UI, as we have the ability to search the event name and description, event fields, or all of them.
Enter completed into the Event library search box and the dialog dynamically filters the list down from hundreds of events to less than 15.
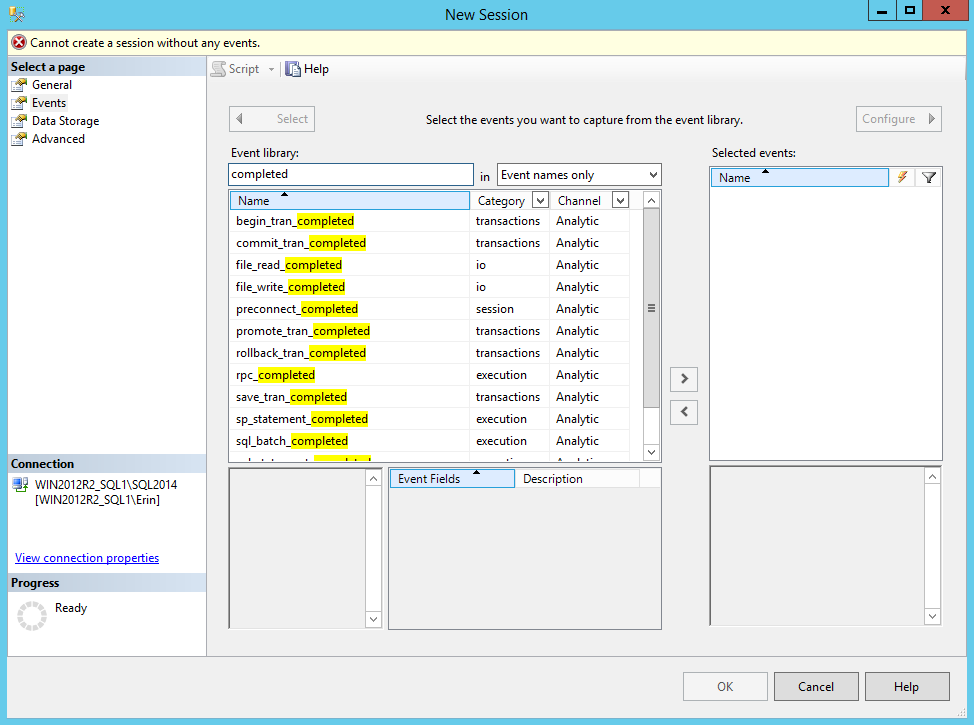
Figure 3: Handy event name filtering when searching the event library
Notice the Category/Channel categorization for the events, which is based on Keyword/Channel classification system used by Event Tracing for Windows (ETW). We won't discuss this further until a later level.
We're not seeing all the "_completed" events here as, by default, the UI does not show debug channel events. Select the drop down next to Channel, and you will see that Debug is not enabled. If you were to enable it, you'd see a few more _completed events appear in the list. Debug events are for internal use by Microsoft, during product development. Some expert users may use them for advanced troubleshooting, or to understand better how some internal feature o SQL Server works. However, Microsoft does not support their use in this way, nor guarantee their behavior, and these events may be removed or changed from release to release.
Double click the rpc_completed and sql_statement_completed events so they appear in the Selected events: pane, and then click the Configure button to add actions and predicates to these events.
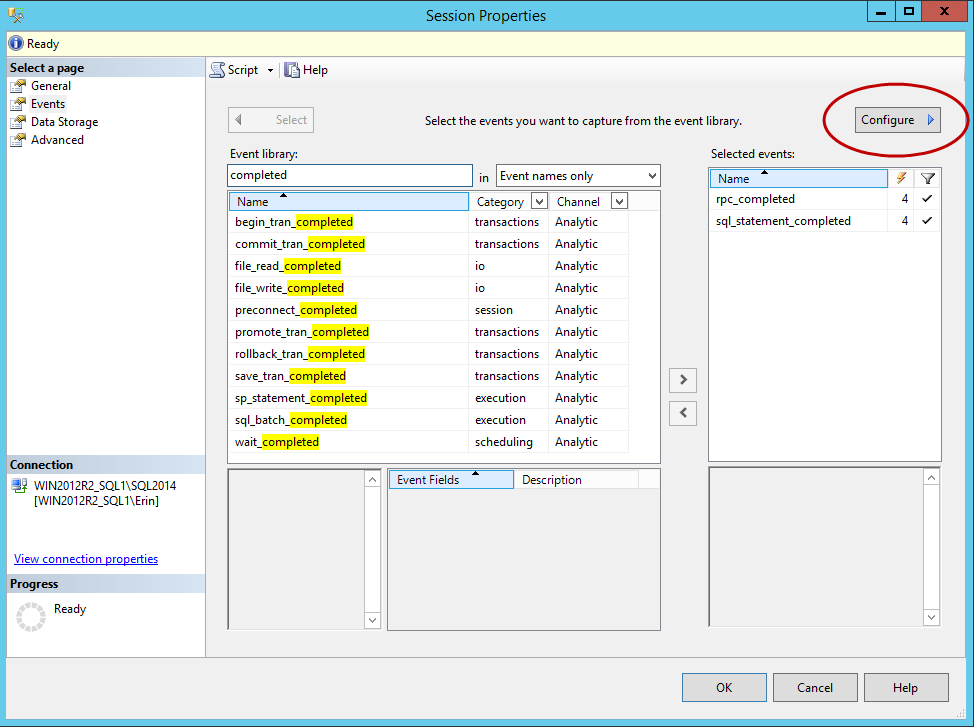
Figure 4: Adding events to the event session
This is the only part of the New Session dialog that I don't like: the configuration for the events doesn't fit on one pane, so the Configure button changes the pane to display action and predicate options. Confession: when I click the Configure button, I like to make a little "vooop" sound, and it's now something I do by habit, even during demos to a live audience!
Configuring Events
The event configuration options consist of three tabs, Global Fields (Actions), Filter (Predicate) and Event Fields, and we'll start with the latter.
The default payload (Event Fields)
The Event Fields tab shows the event fields (data columns) that form the default payload for an event.
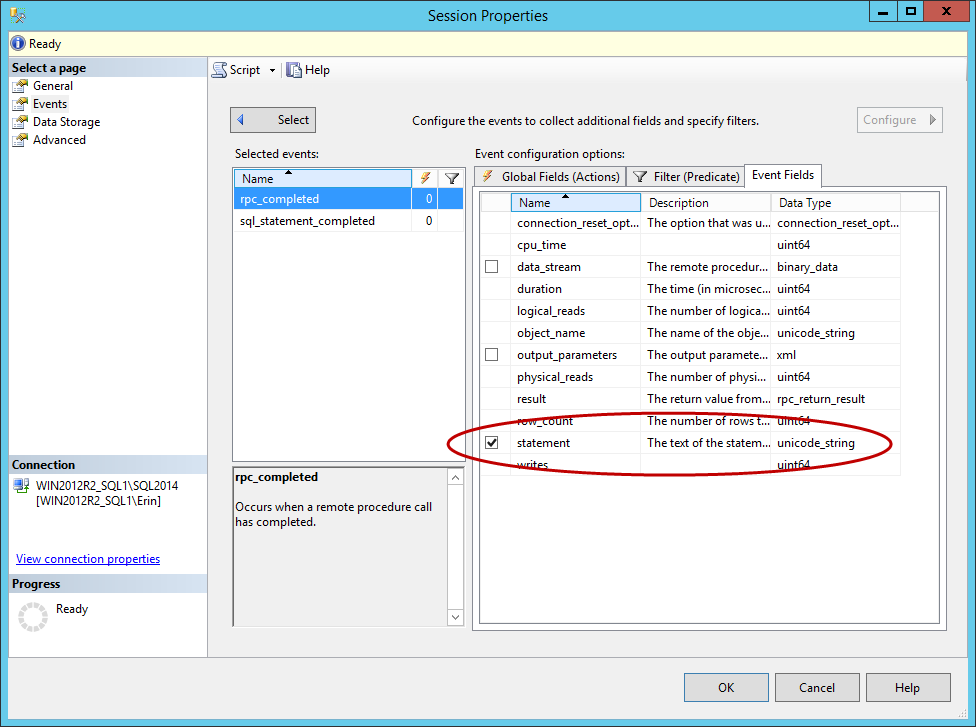
Figure 5: The default payload for an event
Toggle between the two events and you'll see that different events capture different data by default. Most of these fields cannot be removed from collection, but the ones with checkboxes are optional. For example, for rpc_completed events the statement field is optional, but will be collected by default, whereas the output_parameters field is optional and not collected by default.
Leave the Event Fields tab untouched so that both events collect their normal, default payload.
Adding actions
Let's now add the required actions to our two events, using the Global Fields (Actions) tab. Actions are also called global fields, because these fields are not specific to any individual event.
To add an action to an event, just check the box next to its name. To add an action to multiple events, highlight both events on the left and then check the action. In this case, we need to add client_app_name, database_id, server_instance_name, and session_id as actions for both events.
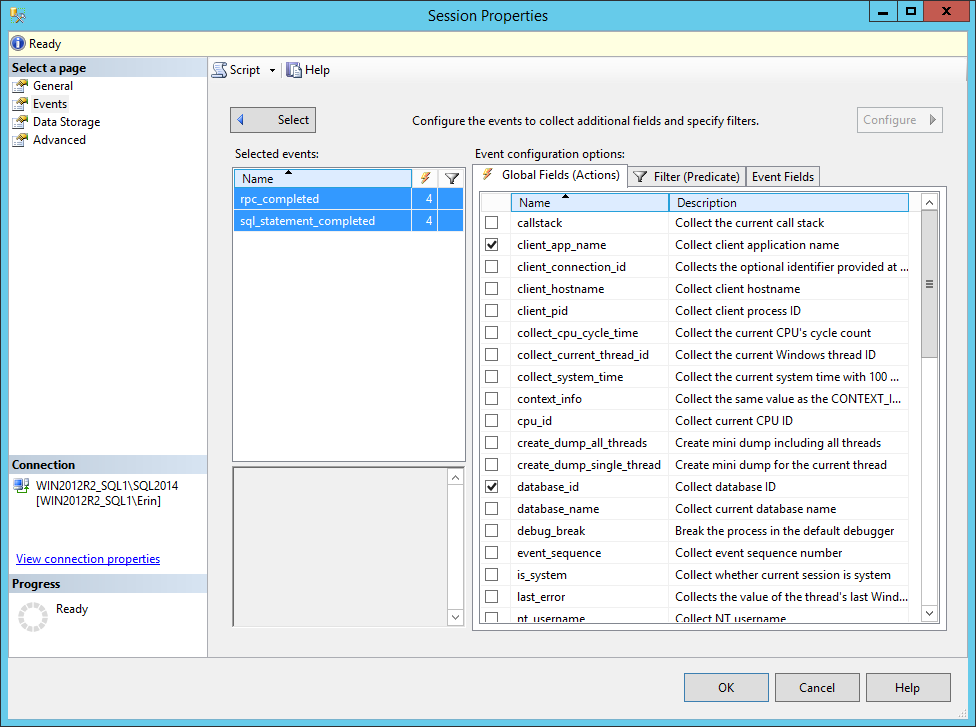
Figure 6: Adding actions to events
The aforementioned actions are fairly benign in the sense that the fields collected simply provide additional details about the event. Extended Events also provides some actions that have side-effects, known as side-effecting actions. For example, the debug_break action causes a debug break to occur when the event fires, and the create_dump_all_threads, and create_dump_single_thread causes SQL Server to write out the memory for all threads, or just the executing thread, respectively. The engine executes these action on the same thread and so these actions can dramatically affect performance and should be used with caution, as we will further discuss in the next level.
Setting filters (predicates)
Finally, we select the Filter (Predicate) tab to configure any predicates. With only a few exceptions, you should configure a predicate for every event, in order to 'short-circuit' event evaluation, and prevent the Extended Events engine from collecting unnecessary data, and therefore causing unnecessary overhead. Predicate configuration and short-circuit logic is extremely important, and we will cover it in detail in the next level.
For this example, highlight both events, and from the Field drop-down select logical_reads, change the operator to greater than or equal to (>=), and enter a Value of 10000. With this configuration, our event session only captures SQL Statement or stored procedure executions that cause more than 10,000 logical reads.
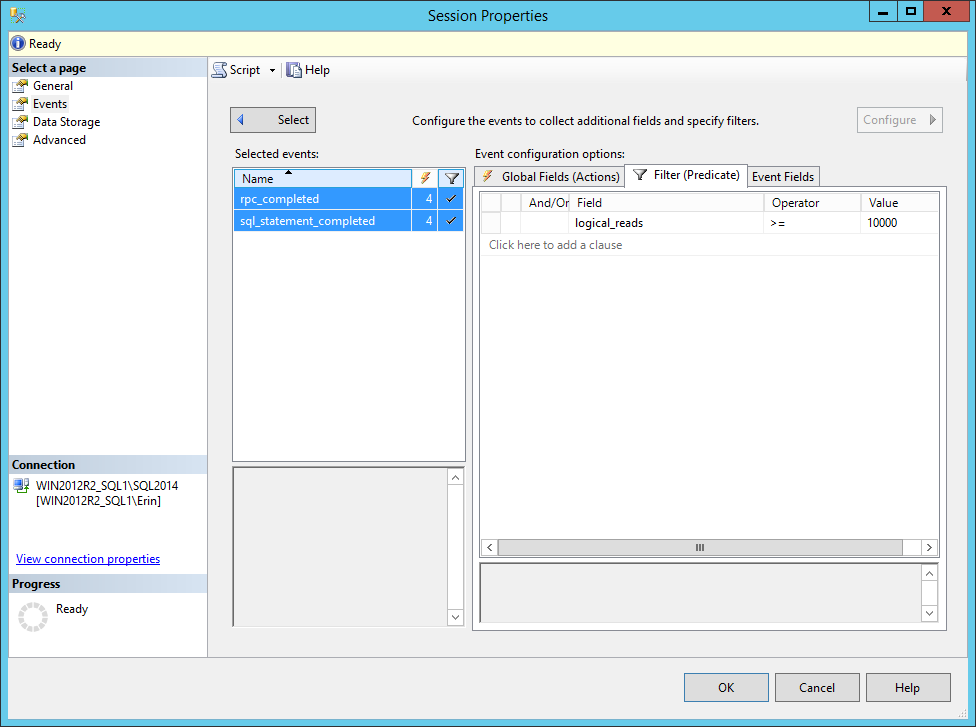
Figure 7: Adding a predicate
This multi-select functionality, to add the same predicate to both events, limited the available predicates to global fields, and to those fields that are common to both events. Depending on the events selected, not all fields may be available. For example, if we had added the error_reported event, and selected all three events, we would not see logical_reads as a predicate option, as shown Figure 8.
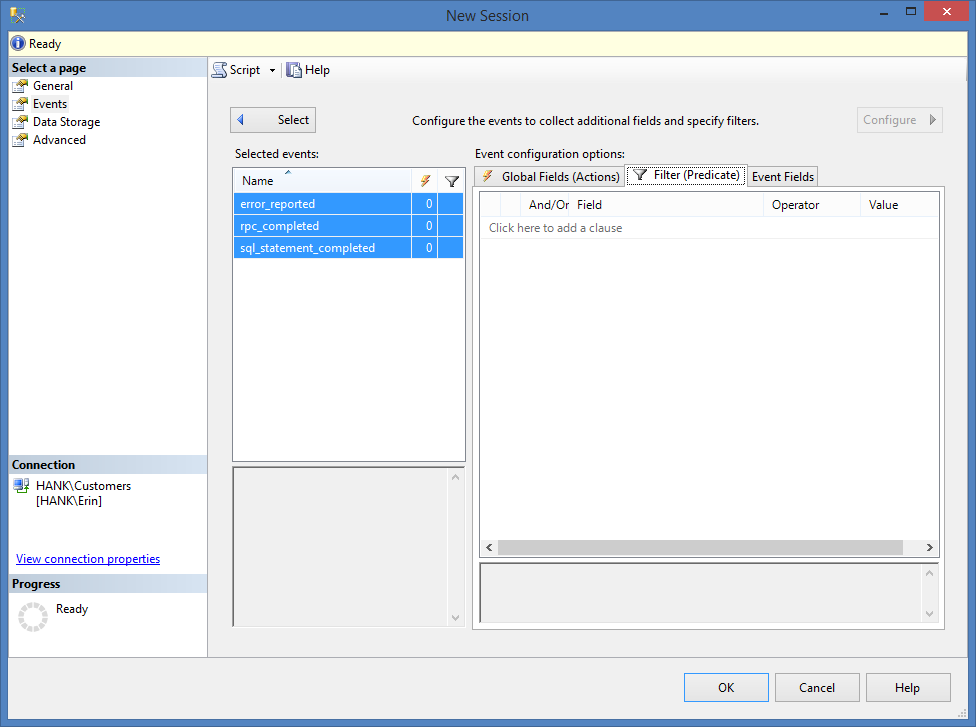
Figure 8: Adding a predicate to multiple events at the same time
In this example, we configured the same predicate for both events, but we also have the flexibility to configure different predicates for each event, something that was never possible in SQL Trace.
At this point in the event session configuration, you can select OK to create the event session because we've added at least one event, and that is the only prerequisite. It is not required that we define a target for an event session, and there are select cases where this target-less configuration is appropriate. For example, if we configure the error_reported event with the side-effecting action create_dump_single_thread, there is no need to have a target as the data we want (a dump file) will be created by the action when the specific error occurs.
In this example, however, we want to configure a target for the session, so let's skip over to the Data Storage page.
Data Storage Page: Defining a target
Select the Data Storage page and for the target Type select event_file. At the end of the File name on server dialog, select Browse… and enter a location to write the output file. There are small changes in the event_file target between versions. In the 2008 and 2008R2 releases, configuration required specifying two files, one for the log data (i.e. the actual event data) and one for metadata (describing what is in the log file, so that the events and actions could be properly parsed). In SQL Server 2012 and higher, only one file is used.
In SQL Server 2012, the full path to the log folder for SQL Server was listed in the UI (e.g. C:\Program Files\Microsoft SQL Server\MSSQL12.SQL2014\MSSQL\Log); in SQL Server 2014 just a file name is provided, but SQL Server still uses the log folder location by default.
The maximum number of characters allowed for the file name is 260, and in our example, we'll use C:\temp\HighReadQueries. It is not necessary to include the file extension (.xel) for the output file.
The extended events engine appends _0_ and an integer (the number of milliseconds between January 1, 1600 and the date/time the file is created) to the end of the filename in order to guarantee that file names are always unique. This is very different from Trace, where the filename is defined in the trace definition, as we discussed earlier.
The event_file target offers the option to set a maximum size for the file in MB, and allows multiple rollover files. If you do not specify a maximum file size, the file will grow until it fills up the drive.
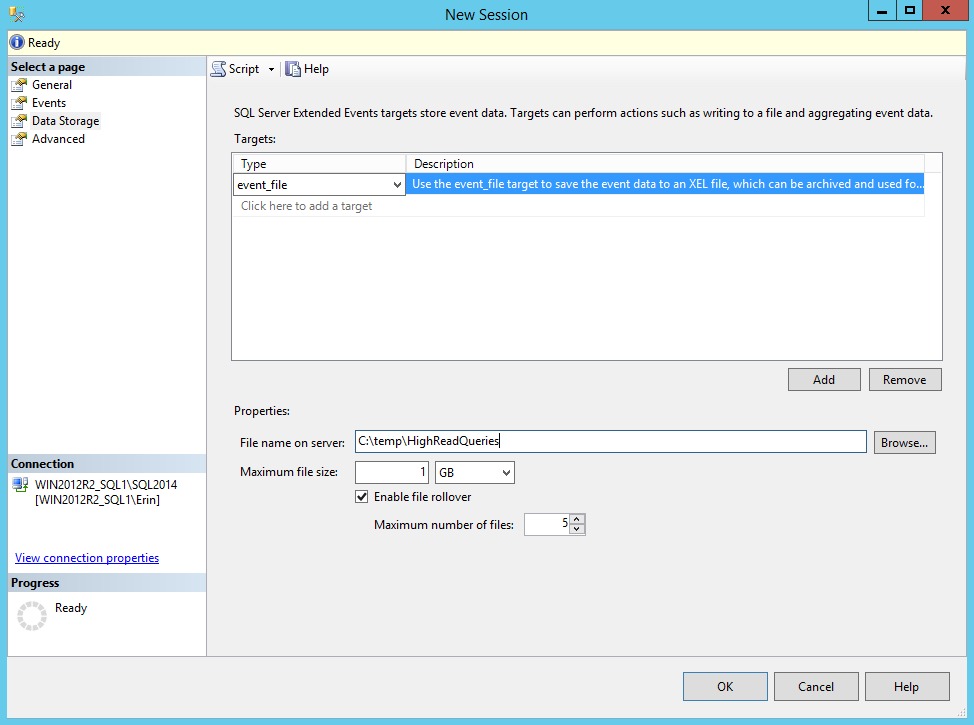
Figure 9: Selecting and configuring a target
Advanced Session Options
On the Advanced page, we can set some additional, advanced session options. We're going to cover these options in detail in the next level, so we won't go over them here. In any case, for consistency with the event session we created in Level 1, we want to leave all of the session-level options at their default values.
The event session DDL
Select OK to create the session, and it will now appear under the Extended Events | Sessions folder, and it is active, because on the General pane we checked Start the event session immediately after session creation. To generate the T-SQL script for the event session, select the Script button in the UI before selecting OK, or after the session is created you can right-click on the new HighReadQueries event session and script out the session definition to a query window. In Listing 2, I've added comments relating each section of the DDL to the work we did in each of the windows of the New Session dialog.
/*Create the session, named as specified on the General page*/CREATE EVENT SESSION [HighReadQueries] ON SERVER
/*Add and configure events, actions and predicates, as specified on the Events page*/ADD EVENT sqlserver.rpc_completed (
    ACTION ( sqlserver.client_app_name,
      sqlserver.database_id,
      sqlserver.server_instance_name,
      sqlserver.session_id )
    WHERE ( [logical_reads] >= ( 10000 ) ) ),
ADD EVENT sqlserver.sql_statement_completed (
    ACTION ( sqlserver.client_app_name,
      sqlserver.database_id,
      sqlserver.server_instance_name,
      sqlserver.session_id )
    WHERE ( [logical_reads] >= ( 10000 ) ) )
/*Add and configure a target, as specified on the Data Storage page*/ADD TARGET package0.event_file ( SET filename = N'C:\temp\HighReadQueries' )
/* Set Session-level options, specified on the General and Advanced pages*/WITH ( MAX_MEMORY = 4096 KB ,
        EVENT_RETENTION_MODE = ALLOW_SINGLE_EVENT_LOSS ,
        MAX_DISPATCH_LATENCY = 30 SECONDS ,
        MAX_EVENT_SIZE = 0 KB ,
        MEMORY_PARTITION_MODE = NONE ,
        TRACK_CAUSALITY = OFF ,
        STARTUP_STATE = ON );
GO
Listing 2: The event session DDL for HighReadQueries
This code is almost identical to the code we saw in Listing 1, for our previous XE_ReadsFilter_Trace session.
In addition to having the session start immediately, we also selected the option Watch live data on the screen as it is captured. Within SSMS a new window opens to display events captured by the event session, just as we could do with the Profiler UI. An improvement here is that if the overhead from viewing the live data starts to affect system performance, the viewer will disconnect automatically (which was not possible with Profiler).
Summary
Having completed this level, you should be familiar enough with extended events to create a basic session through the SSMS UI that captures information for one or more events, collects a select number of actions, uses a simple predicate and writes it to a file. Such configuration is similar, if not the same, to what you would do in Profiler or Trace to capture information.
In the next level we will dive into the fundamentals of extended events so you can begin to move on from basic data collection to advanced configuration and capture.