The objective of this post is to introduce the new feature in SQL Server 2016 called Live Query Statistics. This option is very useful in troubleshooting and performance tuning because it helps to pinpoint the problematic area in a query by providing detailed information.
We need to Include Actual Execution Plan and write code to see how query is processed as well as how much IO and time it took to complete the processing. What the Query Processor is doing is not visible to us; we only see the end result. To see what happens at the back end, what actions SQL Server is performing currently, the time spent on each operator, and the flow of the query, we need to use a new feature called Live Query Stats in SQL SERVER 2016.
In order to demonstrate this feature, I have installed SQL Server 2016 CTP 2 on Windows 8. SQL Server 2016 is compatible only on Windows 8 or higher versions. I have created a test database with a table and few records
First, a simple select query is executed. We have selected Include Actual Execution Plan and code to show time taken to complete the query . Below is the query.
Select firstname, secondname, email from dbo.testenvironment
Group by mailaddress, firstname, email, secondname
Order by firstname
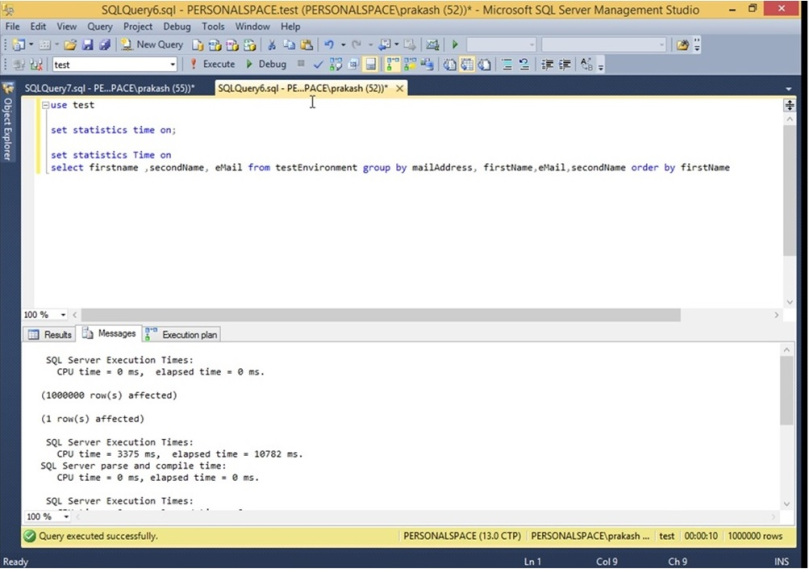
From the above image you can see the cpu time and total time taken to process the query. The query took 10782 ms to fetch 1000000 records.
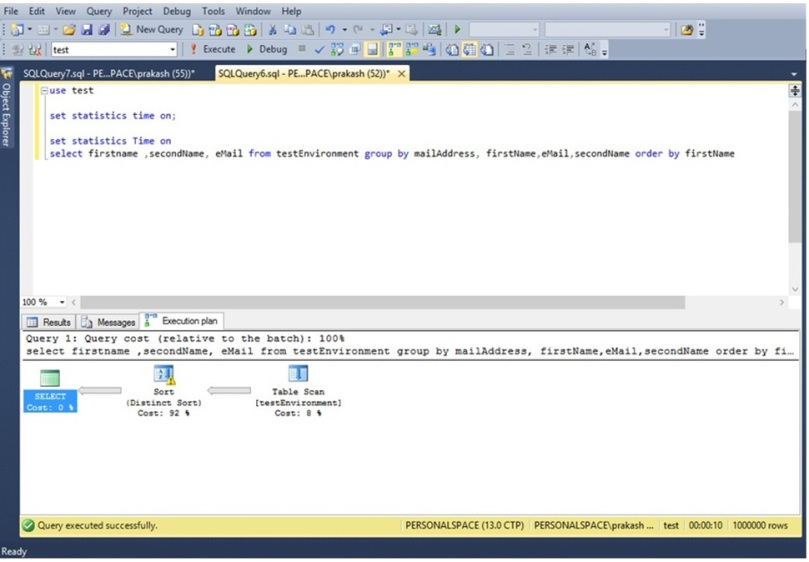
The below image shows the actual execution plan with cost of each operator.
The above information seems to be quite sufficient but the new feature LIVE QUERY STATS gives lot more information of query processing.
In order to see the functionality of live query stats, This time we enable the option to INCLUDE LIVE QUERY STATS by clicking on the INCLUDE LIVE QUERY STATISTICS button, which is right next to the INCLUDE ACTUAL EXECUTION plan, Then we execute the same SELECT statement.
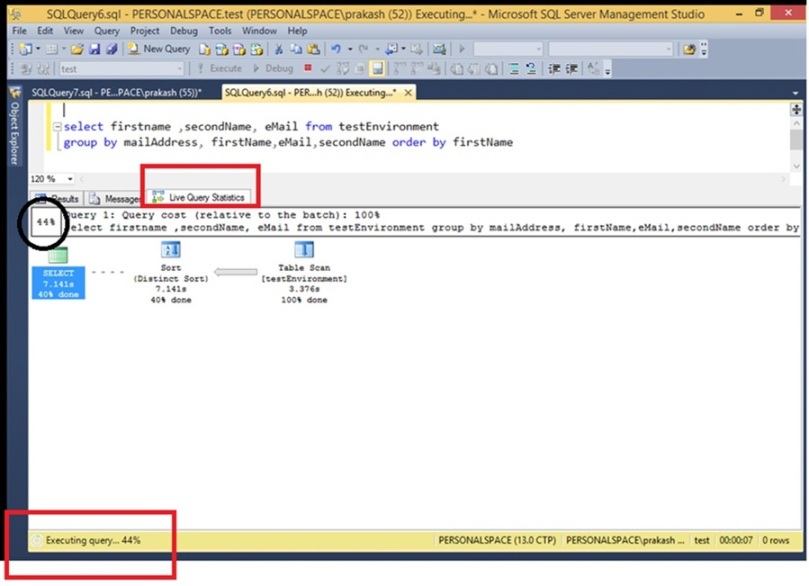
Once we execute the query, new tab appears along side the tabs of results and messages called as Live Query Statistics which shows the live information. This information is updated as statement runs . From the below image , we can see that query is 44% completed, data scan is 100% done and SQL sorting is 40% completed.
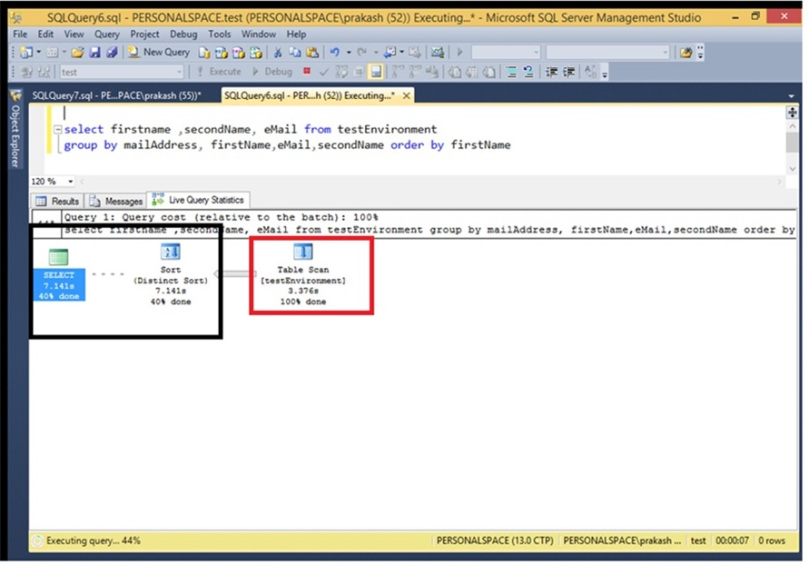
We also see the time taken by each operator. In below image you can see that SQL server took 3.376s to do 100% table scan and 7.141s to complete 40% of distinct sort. Current transaction flow is shown with dotted line and completed transaction with continuous lines.
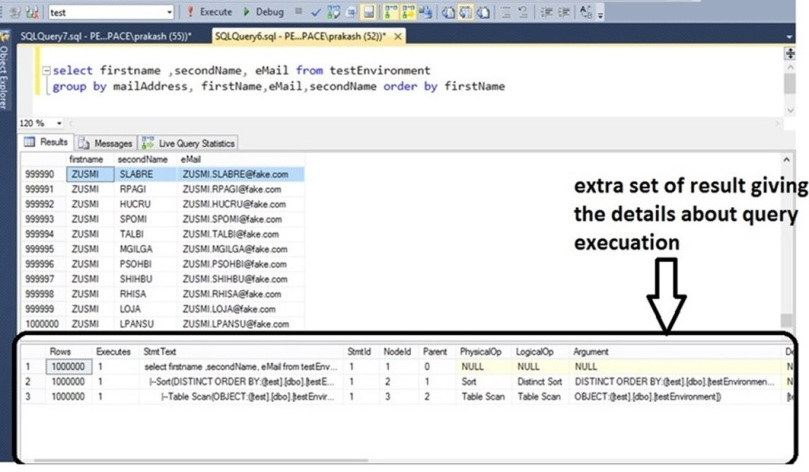
Once query is executed completely another result set pops up with additional information. In this example we have 3 operators namely select, sort and table scan. There is a one row per operator providing detail information about that operator. The information includes type of operation , physical operator and corresponding logical operator, estimated values of I/O,CPU and Row, total sub tree cost ,estimated executions and output list.
This additional information is quite useful while analyzing and testing the performance of query as it helps in pin pointing the painful area. One can decide the part of a query to work on to improve the performance or to troubleshoot by checking this information.
This feature can be used in SQL Server 2014 too, but then one need to run the query using SQL server 2016’s SSMS.
The thing to consider while using this feature is that it will impact the performance of executing query as it will show live details and that’s an additional work processor has to do.


