This past Saturday August 13th I presented two sessions at SQL Saturday #79 hosted by the South Florida SQL Server User Group (SFSSUG) (Webpage | LinkedIn| Twitter). The first presentation was at 11:00am titled “So, What is BI Semantic Model and why should you care?” and the second one was at 3:00pm titled “Designing and Optimizing Analysis Services Hierarchies.” I had an amazing time chatting with some old friends that made it to South Florida all the way from Charlotte, NC, Atlanta, GA and several other Florida cities like Jacksonville, Pensacola, Orlando, and Tampa.
The Driving Adventure
It was an adventure to get there as I decided to make the 4-hour drive from Tampa, FL (about 500 miles round-trip) early in the morning. My original plan was to start my drive around 4:30am but due to being jet lagged from my midnight flight the day before, I woke up until I snoozed the alarm for the 3rd time around 6:30am. That gave me a 30 minute window to get there on time for my 11am session.
The Event
The event was well put together by it’s organizers and volunteers. The food was great and included a mix of Mexican goodies. The Nova Southeastern University Carl DeSantis Building was a great venue. I really liked the central atrium where everybody converged in between sessions and was more than ideal for having lunch and event wrap-up. Great choice of venue & food!
The Attendees
One Mountain Dew + a 5-hour energy bottle and a speeding ticket later, I managed to get there with 20 minutes to spare. My first session titled What is BI Semantic Model and why should you care? started on time and was packed. It was literally standing room only. I had a great time with the audience. They were very engaged and asked both technical and philosophical questions. A couple speakers and friends attended such as my “tweep” (tweeter peep) Phillip Rosen (LinkedIn | Twitter) whom I got to know him in person for the first time. Also, the amazing Data Mining expert and newly minted Microsoft MVP Mark Tabladillo, Ph.D. (Blog | LinkedIn | Twitter) with whom I exchanged a couple of good jokes and funny moments during the presentation. The most memorable being the conception of the term “Bingle” which is the abbreviation of Bing and Google.
Sanjay Soni, Microsoft TSP
One of the attendees was Sanjay Soni (LinkedIn), Microsoft’s new Data and BI Platform Technology Solution Professional (TSP) for the Greater Southeast District (Florida). Sanjay introduced himself after the presentation and was very kind to provide very positive feedback for my BISM presentation. We spent some time chatting about opportunities to co-present and network some more. I’m very excited to assist Sanjay as much as I can in his new role in Florida. I encourage for you to network with Sanjay as he is a very friendly and approachable guy. You will see him very soon at a user group or event near you!
At the end of my session several other attendees came up to introduce themselves personally. There were so many I almost ran out of business cards. I appreciate when attendees take a moment to chat with me after my sessions and get the opportunity to listen to their feedback and kind words. I feel truly honored to have been able to present to such a great crowd.
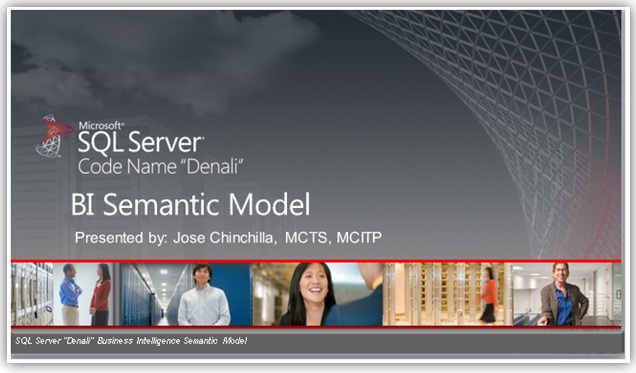
So, What is BI Semantic Model and why should you care?
In this presentation, I did an overview of the new Business Intelligence Semantic Model (BISM) and the new “flavor” of the Analysis Services Engine that Microsoft will release with SQL Server Codename Denali. I explained about the new focus on “Personal BI” with the PowerPivot add-in for Excel, “Workgroup BI” with PowerPivot for SharePoint and “Enterprise BI” with Analysis Services UDM and Tabular mode. I showcased the free PowerPivot add-in for Excel 2010 and later demonstrated how easily a PowerPivot workbook can now be turned into an enterprise grade Tabular database using the new Business Intelligence Development Studio in SQL Server Codename Denali and how simple it is to deploy them.
You can download the slides here or by clicking on the picture above.
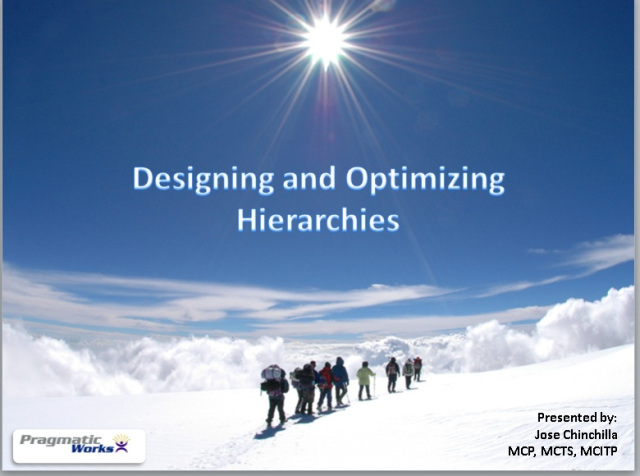
Designing and Optimizing Analysis Services Hierarchies
On my second presentation Designing and Optimizing Analysis Services Hierarchies I also had a great time interacting with the attendees. The session was designed as an intermediate session but changed it a little bit to more beginner level from the results of my skillset level audience survey. I had great questions and participation from the attendees.
You can download the slides here or by clicking the picture above.
Thanks to everyone who attended my sessions and to the organizers and volunteers that made SQL Saturday #79 a success!


