

Introduction
During a recent engagement, a customer complained of severe performance degradation on the from end of a web-based application lasting more than a month. The exact issue could not be identified and was baffling to all layers of support - application, network, database - because the teams had gone to extreme lengths to provide adequate capacity at all layers of the service to ensure there were not bottlenecks. The server had a massive amount of CPU and RAM, far greater than the largest database on the instance. However, the performance problem was still there. End users found the application extremely slow and the application administrator oberved a significant amount of requests queueing on the system.
Initial Diagnosis
The performance tuning approach we used to attempt to isolate the problem was the good old Waits and Queues method. Querying sys.dm_os_wait_stats, sys.dm_exec_requests, and sys.dm_exec_sessions gave us an indication of a number of top events, including CXPACKET, ASYNC_NETWORK_IO and LCK_M_IX.

Fig. 1 Day One Top Wait Events
Our first strategy was to eliminate the easy kills in the top wait events and possibly isolate the real cause of the problem. After making some changes to configurations, such as the MAXDOP and Cost Threshold, and even reducing the Virtual Log File count, we managed to change the wait event profile to that shown in Fig. 2.
I should mention that because of the severe occurence of locks, we even considered using Snapshot Isolation until it became obvious that the primary blocker, a reader as you may have guessed, was often queueing behind a session waiting on ASYNC_NETWORK_IO. This new point of view exposed to us the reality that though we were seeing a lot of LCK_M_IX waits when looking at the view sys.dm_exec_requests, the true dominant wait event was ASYNC_NETWORK_IO
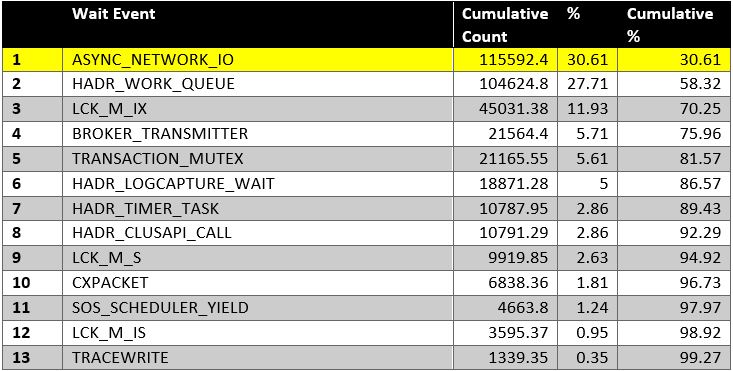
Fig. 2 Day Two Top Wait Events
Digging Deeper
Microsoft documentation describes the ASYNC_NETWORK_IO wait event as "Occurs on network writes when the task is blocked behind the network. Verify that the client is processing data from the server." Further R&D from a variety of sources indicated that this wait event is more likely to occur when an application fails to process result sets from the database fast enough. Quite a number of opinions stated that it was unlikely the the wait event was actually caused by network issues.
The RBAR concept also showed up in our research - Row By Agonizing Row - meaning the application was probaby designed such that it would fetch a large result set and then start process ing each row one by one and would not acknowledge to SQL Server that it had received the result set.
From a network point of view, capacity-wise, the environment was very well endowed. The Network Interface Cards were a set of four redundant 1GBps cards configured as a team. Based on checks from PerfMon counters, the bandwidth was not being maxed out and ping tests looked OK.
Hitting Bullseye
Considering the RBAR theory, we did go back and forth with the application developer for a while trying to find out where the bottleneck was, but we did not find one because there was not one. On testing with a separate client, good old SQL Server Management Studio, we were able to establish that the problem could not be from the application. Using the Include Client Statistics feature on SQL Server Management Studio, we were able to establish that the Client Processing Time was very significant, even outside of the application server.
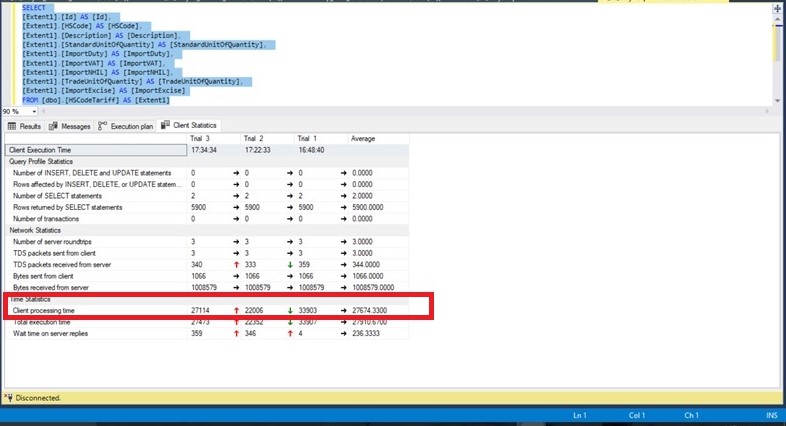
Fig. 3 Client Processing Time
We further dug into the issue by breaking down the teamed NICs and running tests right in the server room. Eventually we isolated the issue to a problematic NIC or NIC configuration. Breaking the teaming configuration solved the problem, and this showed up very clearly in the wait statistics.
Breaking it down to the details, here are the steps we took to isolate the problem:
- We isolated the external network by connecting directly to the same layer 3 switch on which the database server was connected and found the client-side processing time of the sample query show in Fig. 3 was still at about 30 seconds.
- We isolated the switch by connecting directly to the server with a crossover cable and found the client-side execution time of this sample query still at about 30 seconds.
- We removed three out of four NICs from the Network Bridge Teaming configured on the database server and found the client-side execution time of this sample query still at about 30 seconds.
- We removed the working NIC from the Network Bridge Teaming configuration on the database server and found the client-side execution time of this sample query dropped to less than 1 second.
- We returned to the user LAN and confirmed the client-side execution time of this sample query remained at less than 1 second. In addition, the ASYNC_NETWORK_IO wait events for all but disappeared.
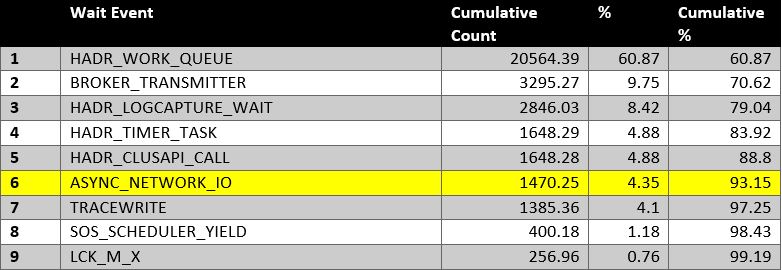
Fig. 4 Day Three Top Wait Events
Conclusion
It is very easy to overlook the obvious when troubleshooting in IT. This may happen if we are inclined to lean on certain stereotypes when dealing with problems. When dealing with an issue professionaly, it is important to make decisions and conclusions based on empirical data taken from the system. This is just about the surest way to arive at a proper resolution.
You will also notice that skills outside of the database arena are often needed to be effective at solving problems in complex environments. Without a good knowledge of the big picture, it is easy to be misled by reports from colleagues in other layers of the stack, such as system admins, application admins, network admins, storage admins etc.
References
https://www.sqlshack.com/reducing-sql-server-async_network_io-wait-type/
http://dataidol.com/davebally/2016/02/28/my-favourite-wait-state-async_network_io/
https://msdn.microsoft.com/en-us/library/ms179355.aspx
https://docs.microsoft.com/en-us/dotnet/framework/data/adonet/sql/snapshot-isolation-in-sql-server
