

Introduction
In our TB-scale production system, a few queries had MAXDOP 4 hardcoded into them. The goal was to improve reporting performance. Instead, CPU usage spiked and the entire server slowed down—even simple queries were affected.
This article explains how MAXDOP works, what SQL Server considers when deciding to use parallelism, and why the wrong setting can hurt more than help. We’ll walk through real tests, show what happens under load, and explore how tuning parallelism without understanding it can cause serious problems.
What Went Wrong: MAXDOP Misuse in Production
We found that application developers had started adding OPTION Maxdop 4 inside SQL queries. The intent was to improve report speed. The result?
CPU-hungry queries grabbed all logical processors. Other sessions began stalling or slowing down. Even lightweight selects were impacted. It wasn’t just one query—it became systemic.
Understanding When SQL Server Goes Parallel
SQL Server uses a cost-based optimizer to determine whether a query should run in parallel. This decision depends primarily on the estimated subtree cost of the query. If the cost is greater than the value set in the cost threshold for parallelism configuration, SQL Server considers generating a parallel execution plan.
By default, this threshold is set to 5. If a query’s estimated cost exceeds that value, the optimizer evaluates whether using multiple threads would be beneficial. The estimated cost is calculated during compilation and reflects the overall resource usage expected for the query.
If you raise the threshold to 50 or 100, SQL Server simply uses that new number as the minimum cutoff. Any query with an estimated cost above that value becomes a candidate for parallel execution. The optimizer does not block parallelism above the threshold — it uses it to decide when to start considering it.
This setting helps reduce unnecessary parallelism on smaller queries, especially in busy systems. But it's not the only factor in play. SQL Server still takes into account system load, query structure, and available CPUs when choosing the final execution plan.
How to Configure MAXDOP
MAXDOP can be configured at the server level through SSMS or T-SQL. The below T-SQL query could be used for configuring maxdop:
EXEC sp_configure 'show advanced options', 1;
RECONFIGURE;
EXEC sp_configure 'max degree of parallelism', 4;
RECONFIGURE;
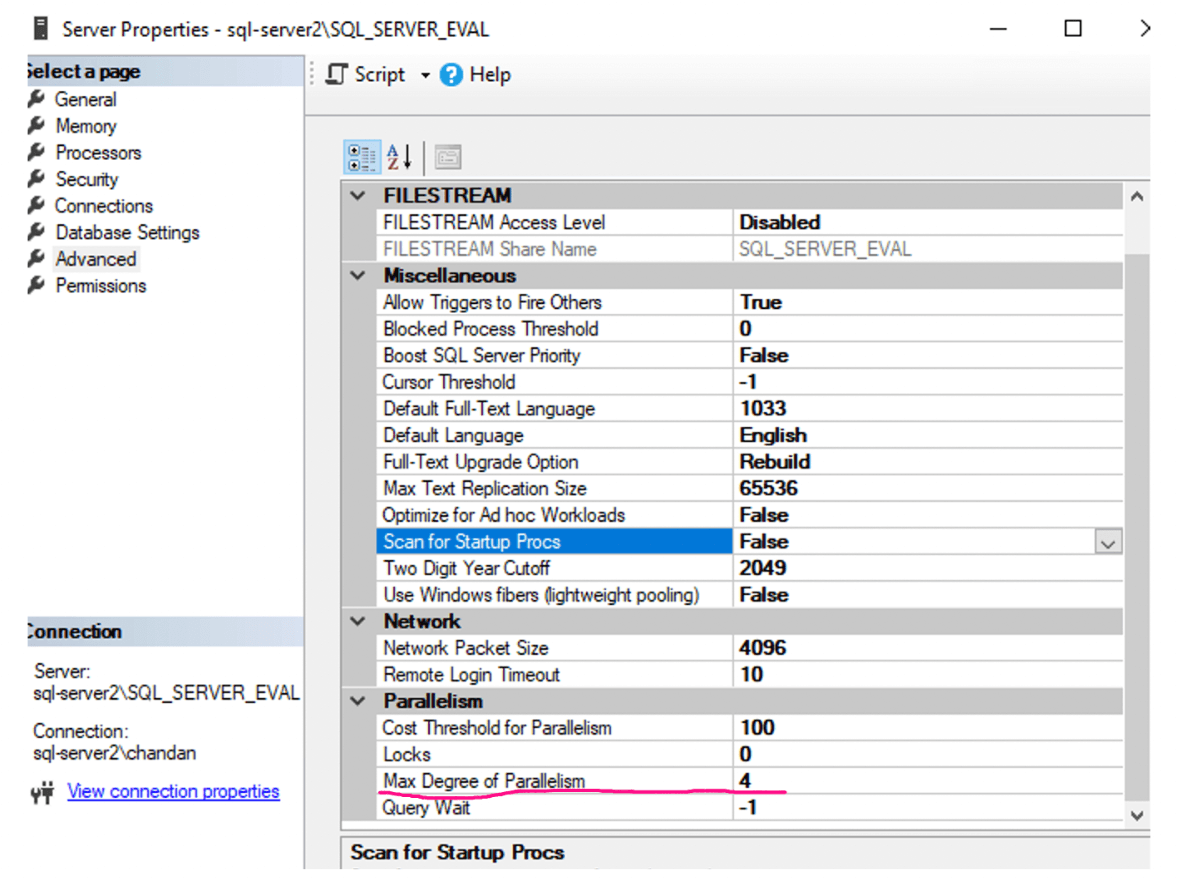
To do it in SSMS, right-click the server, go to Properties -> Advanced, and set the value for "Max Degree of Parallelism."
Populating Data for Testing a Parallel Workload
This script prepares the foundation for workload simulation by creating a table with 500,000 rows of varied, semi-randomized data. Each column is intentionally structured to mimic a real-world reporting environment: titles and content rotate through different SQL topics, categories and authors cycle across multiple types to introduce dimensional variety, and dates are distributed across a full calendar year to support time-based filtering.
While the actual workload simulation—through parallel query execution—comes in the next section, this setup ensures the underlying dataset has enough size and complexity to trigger realistic execution plans, including those that benefit from parallelism and cost threshold tuning.
Testing Query Performance With Different MAXDOP Settings
We ran a CPU-bound query involving joins and a computation-heavy expression. This is the kind of query often seen in reporting or analytical dashboards. We executed same query with different maxdop settings 1,2 and 4:
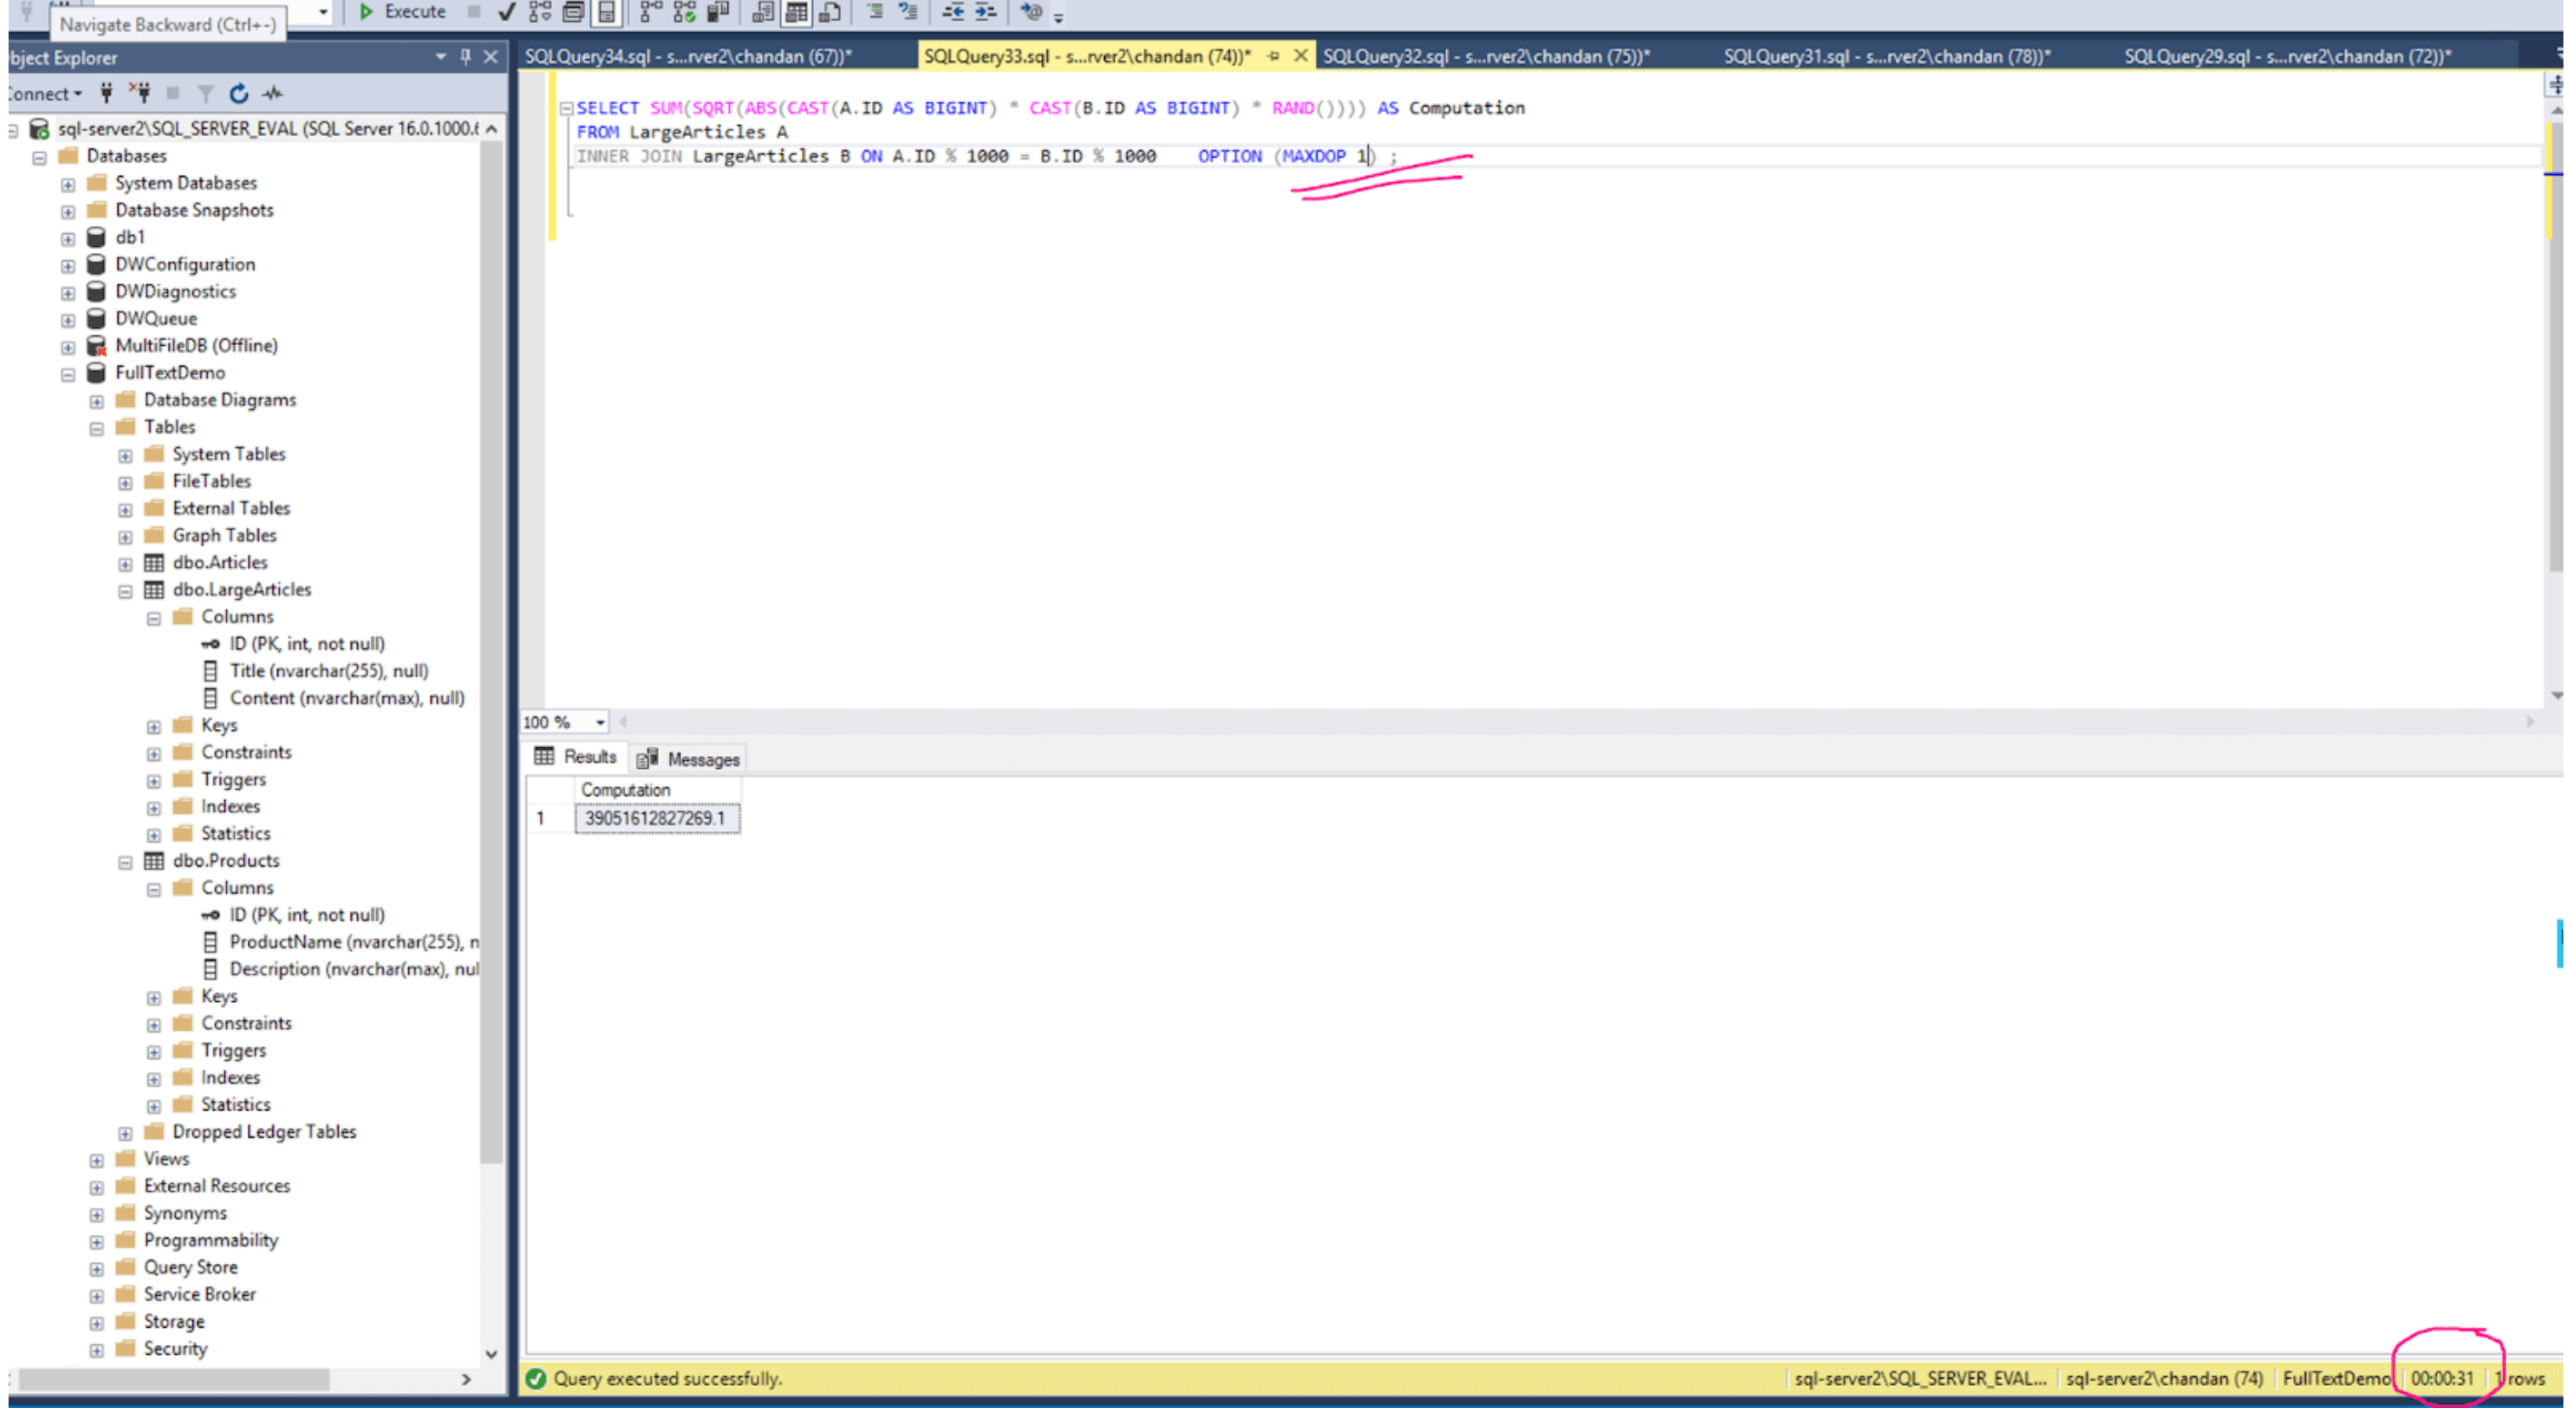
SELECT SUM(SQRT(ABS(CAST(A.ID AS BIGINT) * CAST(B.ID AS BIGINT) * RAND()))) AS Computation
FROM LargeArticles A
INNER JOIN LargeArticles B ON A.ID % 1000 = B.ID % 1000
OPTION (MAXDOP X); -- Replace X with 1, 2, or 4
Execution times showed expected results:
| MAXDOP | Time (seconds) |
|---|---|
| 1 | 31 |
| 2 | 22 |
| 4 | 17 |
We executed the same query using different MAXDOP settings—1, 2, and 4—to observe how SQL Server distributes work across multiple CPU cores(Refer above table for time taken against each MAXDOP setting). With MAXDOP 1, the query ran single-threaded and took 31 seconds. Increasing MAXDOP to 2 reduced execution time to 22 seconds, and MAXDOP 4 further brought it down to 17 seconds.
The screenshot below shows the actual query execution and elapsed time for the MAXDOP 1 case. The times for MAXDOP 2 and 4 were captured similarly and are summarized in the results table.
Observing the Impact on Other Queries
Next, while the above heavy query with maxdop ran in one session, we launched a simple query in another session:
Under normal conditions, this query returns ~459,071 rows quickly. But with the cross-join query running under MAXDOP 4 in the background, this SELECT started taking 13 seconds. Refer the screenshot below
| Background MAXDOP | SELECT * Time |
|---|---|
| 1 | 3 seconds |
| 2 | 4 seconds |
| 4 | 13 seconds |
MAXDOP 4 boosted one query but starved everything else of CPU. This is the invisible danger of parallelism—greedy queries can block the critical ones from executing smoothly.
Testing Under Concurrency
After analyzing how a single MAXDOP-heavy query affects other workloads, we wanted to test what happens when multiple sessions run the same CPU-intensive query using different MAXDOP settings. This would show how well SQL Server handles concurrency when all queries are demanding parallel execution.
We simulated two scenarios: one with four sessions and another with six. Each session executed the same cross join query shown in the workload above and all sessions in each test used the same MAXDOP value—either 1, 2, or 4. This setup reflects what happens on a busy system where several users or jobs hit the database at once.
Performance Results
For this test, the SQL Server instance was running on a VM with 4 logical CPU cores. That hardware limit played a direct role in how each query performed under load.
When all four sessions began executing simultaneously with MAXDOP 1, each query used a single core. Since all cores were occupied evenly, the system was able to schedule queries reasonably well. Execution times ranged from 58 to 87 seconds, showing some natural variation, but nothing extreme.
When we increased MAXDOP to 2, each query requested two CPU cores. This meant that only two queries could run in true parallel at any given time, while the others had to wait for cores to become available. As a result, the first few sessions completed quickly, in around 37 to 43 seconds. But the remaining ones took longer—closer to 68 and 70 seconds—as they had to wait their turn. The system was effectively cycling between two active queries and two waiting ones.
Under MAXDOP 4, each query demanded all 4 cores, leaving no room for concurrency. Only one session could run at a time. As a result, the first session finished quickly at around 38 seconds, the second slightly slower, and so on. The last session had to wait the longest, finishing at over 70 seconds. Despite fast single-query performance, the overall experience suffered because other sessions were completely starved of CPU.
| Execution time for each Session(In seconds) | ||||
| Maxdop Setting on each session | Session 1 | Session 2 | Session 3 | Session 4 |
| 1 | 58 | 59 | 60 | 87 |
| 2 | 37 | 43 | 68 | 70 |
| 4 | 38 | 41 | 70 | 71 |
In the six-session test, the 4-core CPU limit became even more obvious. At MAXDOP 1, all sessions could still run simultaneously, one core each, but saturation led to escalating times. The first two finished in about 74 seconds, while the last few stretched well beyond two minutes. The system simply couldn't juggle six demanding queries at once without queueing.
MAXDOP 2 further strained the environment. With each query requiring two cores, only two or sometimes three sessions could run in parallel. The rest had to wait. Execution times started around 39 seconds but quickly climbed past 100 seconds as sessions competed for limited CPU resources.
With MAXDOP 4, the server reached a bottleneck. Only one query at a time could execute, consuming all cores. This serialized the workload entirely. The first two sessions completed in around 40 seconds, but the rest backed up behind them. Later sessions experienced significant delays, exceeding 100 seconds each.
| Execution time for each Session(In seconds) | ||||||
| Maxdop Setting on each session | Session 1 | Session 2 | Session 3 | Session 4 | Session 5 | Session 6 |
| 1 | 74 | 74 | 145 | 146 | 176 | 185 |
| 2 | 39 | 61 | 65 | 94 | 97 | 109 |
| 4 | 39 | 41 | 77 | 80 | 107 | 110 |
Tune Before You Parallelize
Before tweaking MAXDOP settings, it's crucial to ask: Is the query itself well-tuned?
We often rush to solve slow queries by increasing parallelism. But many performance issues can be fixed through basic tuning steps—without touching MAXDOP.
In our case, the reporting query initially ran in around 20 seconds. To improve it, developers added OPTION (MAXDOP 4), which brought the time down—but at the cost of CPU contention across the system.
Later, we revisited the query to fix it the right way. After analyzing the execution plan, we found a missing non-clustered index on the filter column, outdated statistics on a large table, and a function in the WHERE clause that blocked index usage. Once we addressed these issues, the query dropped to just 1 second—without any MAXDOP hint.
This isn’t unusual. SQL Server's optimiser makes better decisions when up-to-date statistics and indexes are in place. Sometimes, the optimiser chooses a parallel plan automatically, but sometimes it doesn’t need to—because the query is already efficient. Adding a MAXDOP hint to a poorly tuned query only masks the problem. Worse, it consumes more CPU than necessary, hurting other queries on the system.
Always start by checking execution plans, updating stats and indexing properly. Once the query is as efficient as it can be, then test MAXDOP settings if needed. You might find that you don't need it at all.
Conclusion
It all began with a reporting query in our production that took over 30 seconds to run. Developers tried to fix it by adding OPTION MAXDOP(4). That made the query faster—but it quietly degraded the rest of the system. CPU usage spiked, and even lightweight queries slowed down. What seemed like an optimisation for one query turned into a bottleneck for everything else.
To investigate further, we recreated the scenario in our test environment, using a large test dataset that resembled a real reporting workload. We ran CPU-intensive queries under different MAXDOP settings—1, 2, and 4—and observed their behaviour with four and six concurrent sessions. The server had 4 logical CPU cores, so the MAXDOP setting directly controlled how many sessions could run in parallel.
With MAXDOP 1, each session used one core, allowing all four sessions to run concurrently. This setup offered the best concurrency, though individual queries were slower. At MAXDOP 2, each session required two cores, so only two could run at a time. The first two finished quickly, while the rest had to wait. With MAXDOP 4, each query consumed all four cores, meaning only one session could run at once. This serialized the workload entirely—fast for the first query, frustratingly slow for the rest.
But perhaps the most valuable insight was this: before touching MAXDOP, fix the query. In our case, adding a missing index and updating statistics reduced execution time from 20 seconds to just 1. No MAXDOP hint was needed.
Parallelism is powerful, but it comes with risk. If misused, it doesn't just waste CPU—it steals it from everything else. Always start with tuning. Then, test MAXDOP carefully, keeping your hardware limits and workload patterns in mind. What helps one query might hurt your system.
Reference
Configure the max degree of parallelism Server Configuration Option - https://learn.microsoft.com/en-us/sql/database-engine/configure-windows/configure-the-max-degree-of-parallelism-server-configuration-option
