

Introduction
The process that writes the dirty pages from the system memory (RAM) to the disk is called the checkpoint process. Dirty pages consist of the data and log pages as well as the information for the transaction log. Detailed information about the checkpoint can be found here.
This article's purpose is to pay attention on the indirect checkpoint that was introduced with the SQL Server 2012 version. It combines designs from previous checkpoint implementations, which you can find in the reference Indirect Checkpoint Default of the “It Just Runs Faster” series. The indirect checkpoint is an automatic type of checkpoint. It’s executed in background on equal time intervals predefined with the TARGET_RECOVERY_TIME option of the database's properties. Citing the aforementioned reference
“Indirect checkpoint is the recommended configuration, especially on systems with large memory footprints and default for databases created in SQL Server 2016”
informs that it’s becoming the default for the SQL Server 2016 databases.
Analysis and Changes for Target Recovery Time
The reference helps you understand the Target Recovery Time (Seconds) option. You can find the option for a database in the database's Properties window under Options as well as in the Create New database window, under the Options (Figure 1).

Figure 1. Target Recovery Time (Seconds) option set to 60 by default in a Create new database window in SQL Server 2016.
For example the same Create new database window in SQL Server 2014/2012 looks like in Figure 2. Note the highlighted value here is different from the one in the previous window, and with a default value of zero (0).
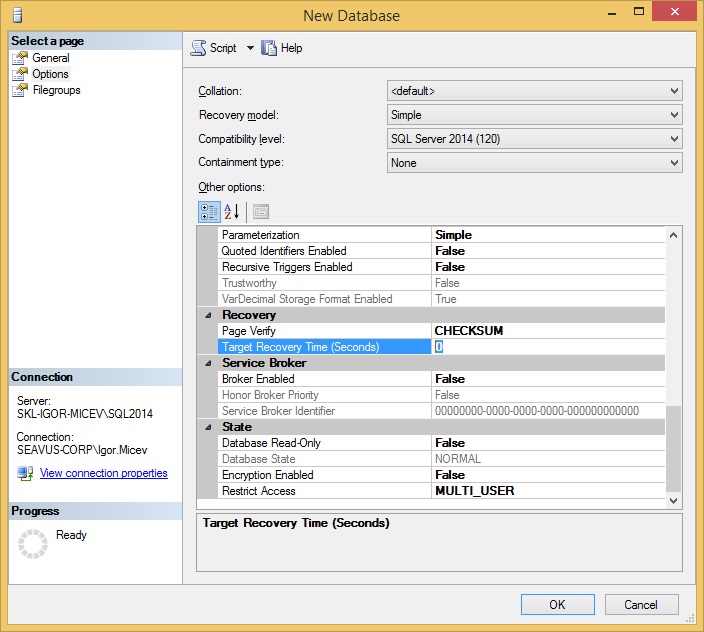
Figure 2. Target Recovery Time (Seconds) option set to 0 by default in a Create new database window in SQL Server 2014.
If the Target Recovery Time (Seconds) is set to zero (0), it means that the database uses automatic checkpoint. By setting a value greater than zero (0), the new, indirect checkpoint will be used. In other words, the setting value for TARGET_RECOVERY_TIME from Figure 1 (highlighted value 60) will use the indirect checkpoint. If it’s set to 0, it’s going to use the server level configuration 'recovery interval (min)' set in the sys.configurations view.
If in Figure 1, TARGET_RECOVERY_TIME is set to zero (0), then the indirect checkpoint will be replaced with the automatic checkpoint. Following the same analogy, if in Figure 2, for the SQL Server 2014 Create new database, I set a different value from zero (0) for TARGET_RECOVERY_TIME, then the indirect checkpoint is going to be used.
You can see the setting configuration at the database level with the next query.
SELECT name, target_recovery_time_in_seconds
FROM sys.databases;
You can change the interval with the following command.
USE [master]
GO
ALTER DATABASE <database_name> SET TARGET_RECOVERY_TIME = 60 SECONDS WITH NO_WAIT
GO
The setting reconfiguration takes place immediately without the need of restarting the instance. It's good to also check the setting on the server level.
SELECT name, value, value_in_use
FROM sys.configurations
WHERE name = 'recovery interval (min)';
A value of zero (0) means one (1) minute of recovery interval time. Setting TARGET_RECOVERY_TIME to 60 seconds does the same checkpoint interval, but uses the indirect checkpoint algorithm.
Tests
The TARGET_RECOVERY_TIME setting made me curious about the performance improvement I wanted to see on my database environments. I changed it on two staging environments and run tests. I set the recovery time interval to 60 seconds. My staging environments have "shifted" real-time live feeds of the ones running on the production environments so that I can say the tests on staging are very relevant for my production environments.
The current instances I used (24 cores, 128 GB RAM, 500 GB data), have 50+ databases, all of them with sizes between 5 - 10 GBs. The version of my SQL Server instances is 2014 (120). I changed the TARGET_RECOVERY_TIME from value 0 to value 60 (seconds).
I noticed an improvement for the CPU usage for the tests on the two staging environments. The tests were done under equal conditions. The overload is/was constant and not changing during the testing period. Figure 3 shows the CPU usage measured by the perfmon.exe tool on a 600 seconds duration before the change.
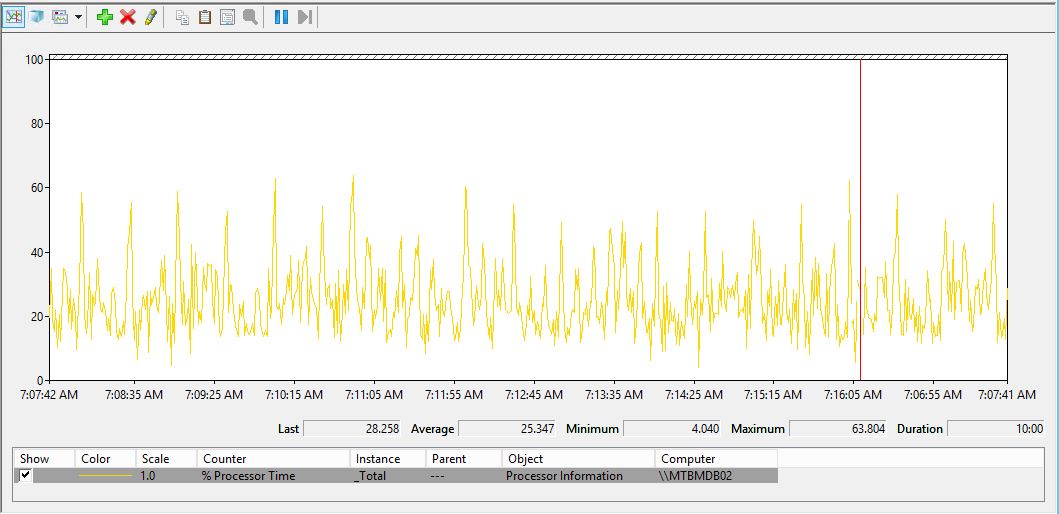
Figure 3. Measuring the CPU usage with the default value (0) for TARGET_RECOVERY_TIME on an SQL Server 2014 instance.
Then I made the change for all user databases. I run this query to generate the ALTER commands because I have tens of databases.
SELECT 'ALTER DATABASE ['+name+'] SET TARGET_RECOVERY_TIME = 60 SECONDS WITH NO_WAIT'
FROM sys.databases AS d
WHERE d.database_id > 4 AND
 target_recovery_time_in_seconds = 0;
After changing the setting on all databases I run the perfmon.exe tool and got the following Figure 4 for the average CPU usage.
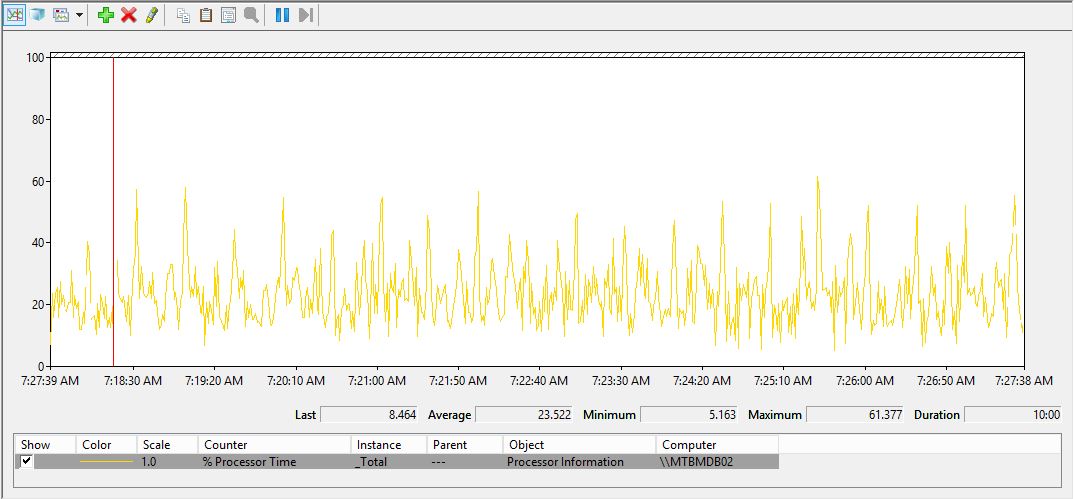
Figure 4. Measuring the CPU usage with the changed value (60) for TARGET_RECOVERY_TIME on an SQL Server 2014 instance.
Conclusion
I observed a decrease in the average CPU usage from 25.347 to a value of 23.522 measured on 600 seconds duration, which is around 8% improving. I made a series of 5 measurements for the average CPU usage in different periods of the day. In all measurements the average CPU usage was having lower values.
In the beginning of this article I mentioned that I'm going to use “light” environments with small databases, but numerous of them. Even though the setting is strongly recommended for the “heavy” environments, it also shows improvements for the ordinary, relatively small as well. Any improvement is welcome.

