

Reviewing Indepth for SQL server
Introduction:
Indepth for SQL server is a performance monitoring software by Veritas. I recently had an opportunity to try out the version 1.5. Newer version is just released and hasn’t tried that yet but this should give an idea on what Product has to offer.
Environment:
I installed Indepth for SQL server on Windows 2000 Server with 2 Processor
(Pentium III) and about 1 GB memory. I used this on SQL 2000 (SP3a) Databases.
Installation:
Installation is fairly simple and takes less than 15 minutes for server side installation. Client side installation takes even less time.
Using Indepth for SQL server:
If you are a DBA, It’s not possible that you were not told that one of the database or server was slow last week! Nothing you can do at this point to find out what was wrong.
When system comes down to its knees, database is the first one to be blamed by almost everyone around. In some cases it actually is the database – affecting performance system-wide. But in
other cases it’s either one of the applications or a hardware issue. We all would like to know what that is and fix it ASAP.
With Indepth it’s possible to see what was going on 2 days ago or a month ago. Which application was taking more resources at that point, which user was running what statements and easy to narrow down the problems.
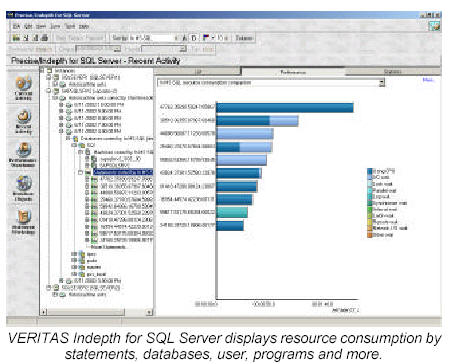
You can easily find out which application is taking your valuable resources currently, or which one was taking more resources few days ago or over the time.
For each of the sessions or historical Time units, It can be assigned to different applications, users, data files, databases, machines etc. Which can be used to identify your point of interest in particular application
or machine or user.
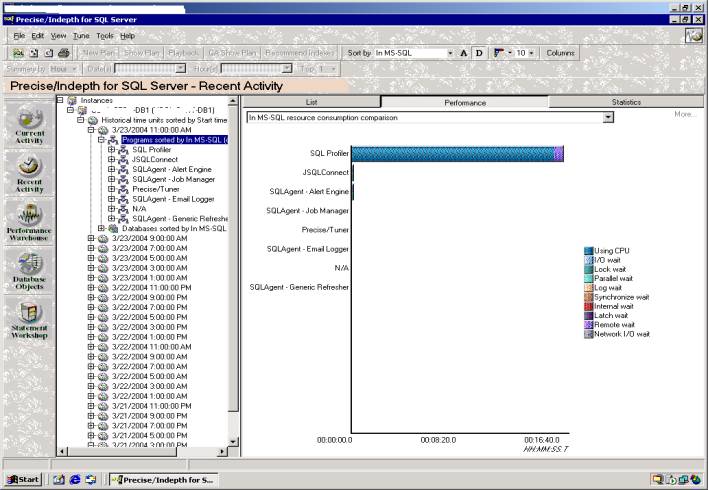
This product basically monitors different activity on your SQL server and gives analysis in easy to understand charts. User Interface has mainly 4 sections.
Current Activity – Shows all current sessions to your SQL server. Shows different wait types in charts for different sessions.
Recent Activity- This is one of the best parts. If you know of any Performance bottle necks in the past, let’s say a week ago, you can go back and see what was happening a week before.
Performance Warehouse- All different kind of stats for all of your databases with collection of data from the past.
Database Objects- Decent display of all of your objects displaying all the details such as user tables, system tables, users, data files in one page. Also shows the growth of your databases over time.
Comparison with SQL Profiler:
This Performance monitoring software takes much less resources than SQL Profiler that comes with SQL server.
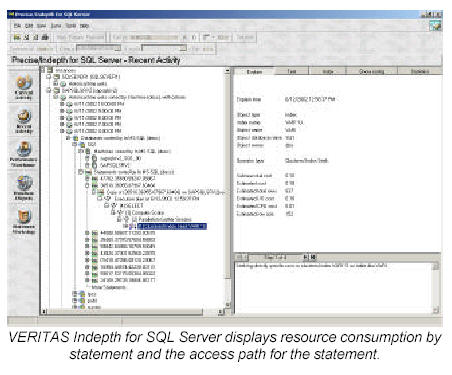
It’s very easy to narrow down to the activity of your interest. e.g. the one using lots of memory.
Very easy to see the Analysis through colorful charts.
Easy to store this information for future references.
Easy to establish a baseline for your performance on your SQL server.
Conclusions:
Overall, I think this is the best product to provide the complete analysis of your database server’s performance with very low overheads.
RatingsI will rate each of the following using a scale from 1 to 5. 5 being the best and 1 being the worst.
|
Vendor Information:
www.veritas.com