

This specialised tool assists with performance analysis and troubleshooting of SQL queries that have active requests (refer sys.dm_exec_requests). The stored procedure collates information from various DMVs in order to provide on-demand detail of query workload and throughput characteristics. The script also parses collated metrics to provide behavioural insight into query performance.
For example have you ever asked the question:
- What queries are potentially exhibiting IO pressure ?
- What queries are generating a significant workload in Tempdb ?
- What queries are expected to sort a large number of rows ?
- Does SQL Server estimate the query to exhibit a light or heavy workload ?
- How can I tell if query performance is affected by parameter sniffing ?
Sp_PerfSQ is designed to answer or provide insight into the above and many other query performance questions.
This tool is also designed to support Query Shaping – an optimisation technique for constructing SQL queries that take advantage of SQL Server behaviours and facilitate performant query design without reference to an execution plan.
Refer to the end of the article for the script download.
Script Output
The script generates one row per session ID categorised as follows (left-to-right):
Session summary, behavioural descriptors and current SQL query

Basic workload and throughput metrics

Locking, version store and tempdb usage

Cached plan summary statistics and estimated plan

Session origin and script runtime

Column SessionLocks summarises locking based on sys.dm_tran_locks. For example:
SELECT *
  FROM dbo.sysobjects s
       INNER JOIN sys.objects o
               ON o.object_id = s.id;
GO
Could result in SessionLocks displaying:
Sch-S (GRANT:OBJECT:sysschobjs)x1,Sch-S (GRANT:OBJECT:syssingleobjrefs)x1
This feature is not performant and must be activated with the script parameter @SessionLocks=1
Server metrics are identified to provide additional query performance context and displayed in the Messages tab of SQL Server Management Studio. For example:
EXEC sp_PerfSQ @ParamSniff=1, @SessionLocks=0 --v4.5.17
Returns these results:
Microsoft SQL Server 2017 (RTM) - 14.0.1000.169 (X64)
      Aug 22 2017 17:04:49

Memory
    Total Physical Memory : 8116 MB
    Max SQL Server Memory : 2147483647 MB
    Physical Memory In Use: 373 MB
    Kernel Non-Paged Pool : 252 MB
Schedulers
    Avg CPU Queue Length  : 0
    Avg IO Pending Count  : 0
    Avg Thread Shortage   : 0
    CPU Allocation        : 8 of 8
Version Store
    Version Cleanup Ratio : NA
Scheduler averages > 0 indicate SQL Server is experiencing resource allocation constraints and could represent a performance issue if the behaviour persists.
Before describing the behavioural parser, let’s look at some foundational concepts and SQL Server metrics in more detail.
Query Cost
This is an internal indicator of CPU and IO workload that can be used to categorise estimated query workload. For example, when SQL Server assigns a query to a resource semaphore queue for memory allocation queue prioritisation is dependent on Query Cost with a lower cost been assigned to a higher priority queue.
Building on these prioritisation thresholds, a behavioural estimate of query workload is categorised as follows:
| Query Cost | Workload Category |
| < 10 | Low |
| < 100 | Medium |
| < 1000 | Medium – High |
| < 10000 | High |
| >= 10000 | Very High |
Note: Query Cost values are not displayed and are not compared with other metrics.
Query Significance
The concept of significant workload is used when identifying queries that may be exhibiting certain performance issues. Query Significance in this context means Query Cost (Workload Category) is not Low.
Tempdb Pressure
Tempdb is used by SQL Server to support many operations including the following:
- User objects such as cursors, temporary tables and variables.
- Internal objects such as intermediate result tables for cursor, sort or spool operations, and work files for hash operations.
- Version Store (row versioning).
Increased use of tempdb by a query and reliance on its responsiveness can contribute to performance delays:
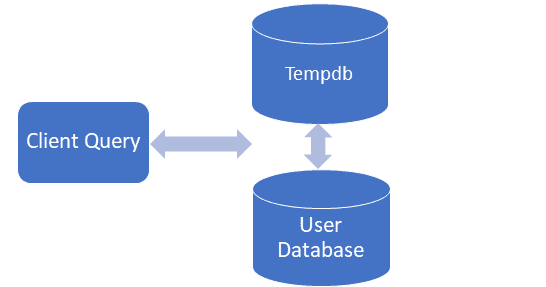
The column difference TempdbAllocMB – TempdbDeallocMB identifies current tempdb storage consumption from both user and internal objects for a given query. These columns accumulate in size until the entire batch is completed. If a poorly performing query appears to be consuming significant tempdb storage you may want to consider re-engineering the query.
SQL Server Metrics
@ProcessMemLow > 0 indicates process memory pressure and occurs when
| Data Management View | Column | Value |
| sys.dm_os_process_memory | process_physical_memory_low | 1 |
@SystemMemLow > 0 indicates system memory pressure and occurs when
| Data Management View | Column | Value |
| sys.dm_os_sys_memory | system_high_memory_signal_state | 0 |
| sys.dm_os_sys_memory | system_low_memory_signal_state | 1 |
@RunnableCountAvg = Average processor scheduler runnable queue length. An average > 1 may indicate CPU pressure.
Note: A task is assigned to the runnable queue when ready to execute and waiting CPU allocation.
@PendingIOCountAvg = Average processor scheduler pending disk IO. An average > 1 may indicate IO pressure.
Note: Each processor scheduler maintains a count of pending disk IO.
@ThreadShortageAvg = Average processor scheduler worker thread shortage. An average > 0 indicates worker thread shortage.
@VerCleanupRatio = Version Store clean-up rate (MB/s) * 100 / Version Store generation rate (MB/s)
Note: Version Cleanup Ratio < 100% indicates SQL Server is cleaning up Version Store records no longer in use. The script uses < 80% to indicate SQL Server may be struggling to keep up.
Query Performance Throttling
Throttling is used to describe throughput restrictions including intermediate workloads that are different to the optimal throughput and workload combination achievable by the query. Throttling in this context represents factors leading to sub-optimal query performance.
The script accesses significant performance detail from DMVs enabling the following potential performance issues to be identified in column ThrottlePotential:
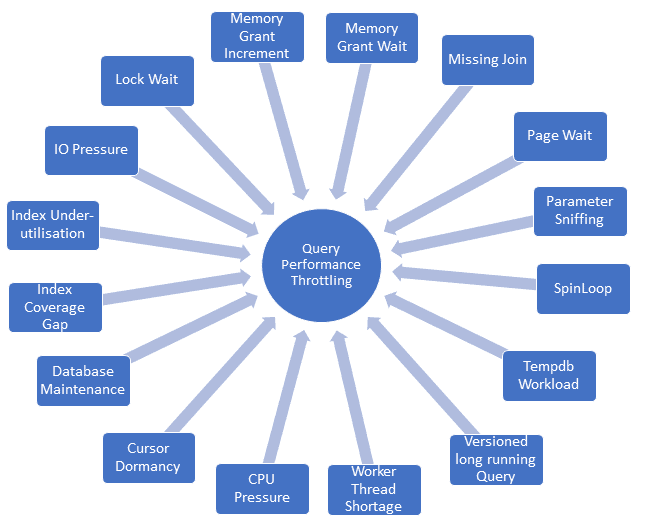
The above indicators represent resource restrictions or usage behaviours that can lead to additional delays in query runtime. What constitutes reasonable and unreasonable delays will often depend on business requirements. The purpose of column ThrottlePotential is to highlight potential performance issues that could otherwise be missed.
Throttle Potential Indicators
Column ThrottlePotential is populated as a comma separated list of keyword descriptors.
CPU Pressure
“CPUWait” appears when
- A query is not currently in a RUNNING state.
- Average processor scheduler runnable queue length (@RunnableCountAvg) > 1.
- One or more tasks related to the query are in a RUNNABLE state and one of these RUNNABLE tasks is in a scheduler queue with maximum length > 2.
Note: RUNNABLE refers to a task awaiting CPU allocation.
Cursor Dormancy
“Cursor(nnms)” appears when
- A query includes a cursor that is currently open.
- Maximum dormancy is >= 1ms.
“(nnms)” identifies maximum dormancy in the case of multiple cursors and is expressed in milliseconds.
Note: Dormancy refers to how long since the query performed an OPEN or FETCH operation for a given cursor.
Database Maintenance
“<COMMAND>(nnmin)” appears when one of the following database activities occurs:
- ALTER INDEX REORGANIZE
- AUTO_SHRINK option with ALTER DATABASE
- BACKUP DATABASE
- DBCC CHECKDB
- DBCC CHECKFILEGROUP
- DBCC CHECKTABLE
- DBCC INDEXDEFRAG
- DBCC SHRINKDATABASE
- DBCC SHRINKFILE
- RECOVERY
- RESTORE DATABASE
- ROLLBACK
- TDE ENCRYPTION
Refer to Microsoft Docs regarding sys.dm_exec_requests and column percent_complete.
“<COMMAND>” identifies the database activity type.
“(nnmin)” identifies the estimated time remaining for the command to complete in minutes.
The estimated time remaining is derived from column estimated_completion_time, which is only ever greater than zero in relation to one of the above database maintenance activities.
Index Coverage Gap
Index Impact represents estimated % reduction in Query Cost if missing indexes identified in the estimated execution plan are created. “IdxGap” appears when
- A query is significant
- Average missing index impact is significant (> 20%)
Meaning there is potential for a noticeable improvement in query performance by addressing the index coverage gap.
Index Under-utilisation
Unused indexes require ongoing SQL Server maintenance involving processing time and IO. “IdxIdle” appears when
- A query has referenced a table that potentially contains an index not in use (by any query). It relies on sys.dm_db_index_usage_stats which is reset after SQL Server restarts and requires further investigation.
- Parameter @SessionLocks=1.
This indicator will not appear with the default @SessionLocks parameter due to performance overhead associated with querying sys.dm_tran_locks.
IO Pressure
Efficient disk usage is foundational to query performance especially given disk is magnitudes slower than RAM. “IO” appears as an indicator of potential IO pressure when either:
- Physical Disk Reads > 20%; or
- Query is significant and Average Pending IO (@PendingIOCountAvg) > 1 and either Physical Disk Reads > 5% OR Page Latch IO > 50ms.

“IO(MemP)” appears when potential IO pressure has been identified and memory pressure has also been identified with server metrics @ProcessMemLow > 0 or @SystemMemLow > 0.
Lock Wait
“LockWait” appears when
- dm_tran_locks.request_status is set to ‘WAIT’ for one or more lock requests
- Parameter @SessionLocks=1.
This indicator will not appear with the default @SessionLocks parameter due to performance overhead associated with querying sys.dm_tran_locks.
Memory Grant Increment
“InitialMem(nnMB)” appears when initial Memory Request is less than the current Memory Grant meaning memory allocation has increased during query execution.
“(nnMB)” identifies the initial Memory Request size while column MemGrantMB identifies current Memory Grant allocation.
This behaviour can occur during index creation and is documented by Microsoft in relation to sys.dm_exec_query_memory_grants and granted_memory_kb.
Note: Queries that do not perform intermediate operations (e.g. group, sort, hash) may not require a memory grant. This means column MemGrantMB may not show a value for queries that have simpler processing requirements.
Memory Grant Wait
“MemWait” appears when requested memory has not yet been granted and is identified when sys.dm_exec_query_memory_grants.grant_time is NULL. Persistent memory waits may indicate concurrency issues.
Memory allocation is governed by resource semaphores that assign memory to a query when available otherwise the query is held in a queue. These queues are prioritised so that a query with a lower Query Cost is assigned to a higher priority queue.
Note: The DMVs sys.dm_exec_session_wait_stats and sys.dm_os_wait_stats can provide more detailed information regarding wait behaviour.
Missing Join
“MissJoin” appears when a missing join is identified in the cached query plan. Unless the missing join is an exceptional design feature the query may be performing sub-optimally requiring further revision.
Page Wait
“PageWait” appears when the query is waiting to read or modify a data page in memory, and is identified when sys.dm_exec_requests.wait_type is a PAGELATCH and wait time >= 1ms. Persistent page waits are indicative of page concurrency issues that are not going to be resolved by adding more memory. An example of a PAGELATCH wait could be the result of significant insert operations.
Note: Page latches are used to maintain index and data page consistency in memory.
SpinLoop
“SpinLoop” appears when a query is waiting on a SPINLOOP.
SPINLOOP is a kind of short-term latch used to co-ordinate thread access to shared data structures and consumes CPU cycles until finished – meaning there are no context switches. This is useful given standard latches have significantly greater overhead. In some circumstances a SPINLOOP can persist causing performance issues.
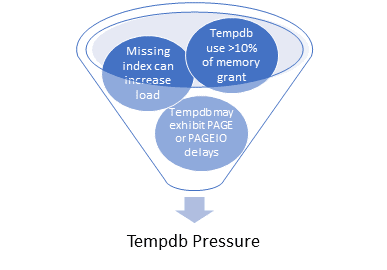
Tempdb Workload
“Tempdb[(nnms)]” appears when
- A query is consuming tempdb space > 10% of memory grant. Tempdb usage is calculated as the difference between columns TempdbAllocMB – TempdbDeallocMB.
The following threshold adjustments can occur:
- If 10% of memory grant is >50MB the significance threshold is capped at 50MB.
- Given tempdb load can increase when index coverage is poor the threshold is reduced by average missing index impact %.
During periods of significant load tempdb may also exhibit memory or disk IO related delays. When this occurs the maximum delay is expressed as nnms.
Versioned long running Query
“Ver(nnsec)” appears when
- A query accesses or generates a versioned record in the Version Store (refer sys.dm_tran_active_snapshot_database_transactions).
- The version cleanup ratio (@VerCleanupRatio) < 80% indicating SQL Server may be struggling to clean up Version Store records no longer in use.
“(nnsec)” indicates maximum elapsed seconds the query has been accessing or generating versioned records. This behavioural metric helps to identify longer running queries that are using the Version Store and potentially impacting performance due to the increased retention of versioned records.
Note: The Version Store operates by SQL Server storing row versioned records in tempdb as linked lists and these linked lists are accessed sequentially. As the Version Store grows with different row versions this can result in a significant performance overhead.
Worker Thread Shortage
“ThreadShortage” appears when
- A query includes a task that is in a PENDING state (refer sys.dm_os_tasks) meaning it is waiting on a worker thread.
- Average processor scheduler worker thread shortage (@ThreadShortageAvg) > 0.
This combination means the query is experiencing worker thread availability contention and could be indicative of a server specification issue if the problem is more wide spread.
Parameter Sniffing
This performance issue refers to the re-use of a parameter driven execution plan (procedure or adhoc) using different parameter values than originally supplied with the execution plan that is currently cached. And these different parameter values result in a significant increase in query workload due to the cached execution plan no longer been suitable causing query performance to suffer.
Accordingly it can be difficult to detect parameter sniffing issues, but once identified remediation can involve refreshing the cached execution plan with the revised parameter values and/or modifying the query.
“ParamSniff(nn-nnSec)” appears when the query
- Is using parameters – column CachedParam is not empty
- Is either a procedure or adhoc – refer column PlanType
- Has been run multiple times – column RunCount > 1
And the following 3 thresholds have all been exceeded:
- Workload variation or pressure identified by either
- MaxRows returned > ((MinRows * 4) + 100)
- “IO” Pressure (defined above)
- “Tempdb” Pressure (defined above)
- CPU variation expressed in milliseconds
- CpuHighms > ((AvgCpuLowms * 4) + 100)
- Runtime variation expressed in seconds
- (Maximum runtime – Minimum runtime) > ((Minimum runtime / 10) + 10)
- Workload variation or pressure identified by either
Additionally the above variation thresholds can be dialled up or down in sensitivity using the @ParamSniff parameter with:
- < 1.0 producing more hits
- 0 as default
- > 1.0 producing less hits.
Any value < 0 or > 2.0 will result in @ParamSniff been set to the default 1.0.
Script Download
https://www.sqlservercentral.com/scripts/sp_perfsq
