

This article outlines the performance innovations in SQL Server 2016 for Columnstore Indexes and BatchMode Execution that allow SQL Server 2016 to run across a wide array of hardware configurations, faster and better than the previous releases of SQL Server. I will make the performance comparison between SQL Server 2014 and SQL Server 2016 for Columnstore Index and BatchMode Execution. The factors considered for performance improvement tests are multiple aggregates, BatchMode in serial execution, string predicate pushdown, and aggregate pushdown. I have shared my experience with you, i.e., the performance gain that I observed, through practical examples.
Multiple Aggregates
In a single batch mode aggregation operator, SQL Server 2016, now processes multiple aggregates more efficiently on a table scan. When I upgraded the application to SQL Server 2016, I got these benefits automatically with no change made to the application. I will show you this with examples. The examples that I show here are based on the AdventureWorks Database for SQL Server 2016 CTP3. First, I ran the query in SQL Server 2014 and then, I contrasted it with SQL Server 2016.
SQL Server 2014
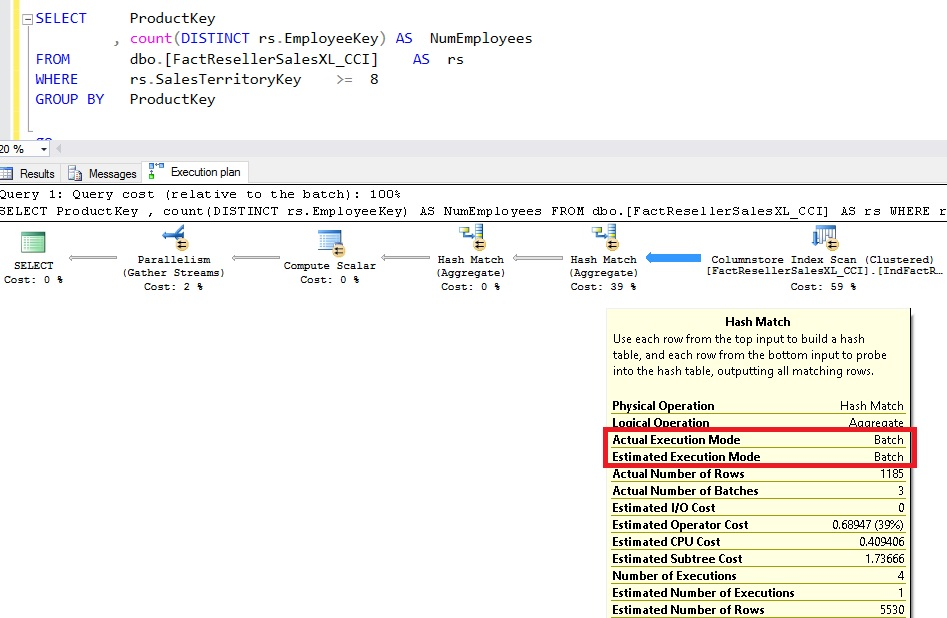
Take a look at the below query. The two HASH MATCH operators and SCAN on the Columnstore index are run automatically in batch mode. One of the HASH MATCH operator’s execution details are shown in below image.
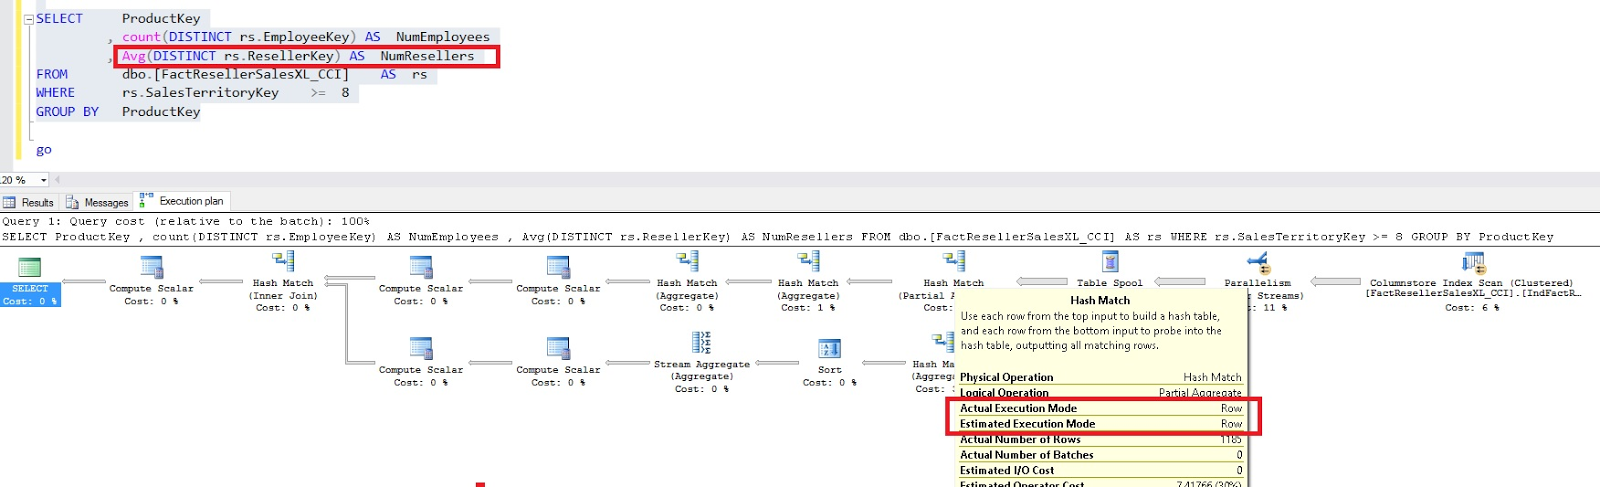
By adding one more aggregate(as shown in below Redbox), I have altered the query. The HASH MATCH operators’ execution was carried out in Row mode, and the execution plan got much more complicated when this query was run.
SQL Server 2016
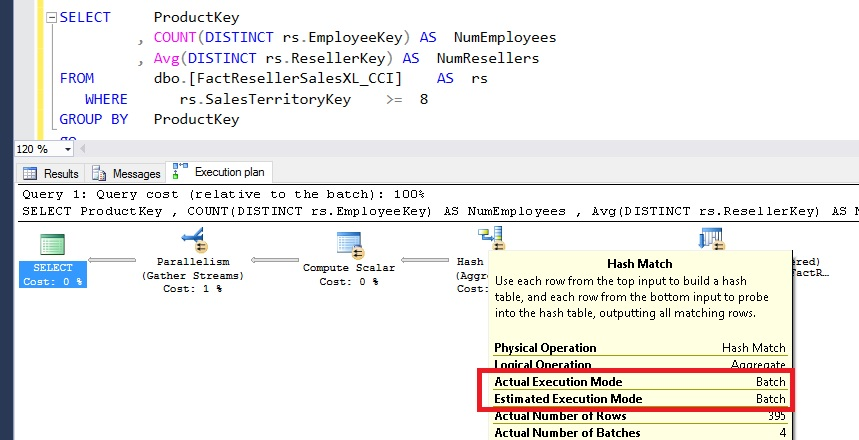
As shown in the below image, I ran the query with double aggregates by using SQL Server 2016. Regardless of the total number of aggregates that are calculated with the HASH MATCH operator that is executing in BATCH mode, the query plan remained unchanged.
I observed that when compared with SQL Server 2014, this query ran 16x faster.
Note: This improvement in query performance is seen with DBCOMPAT 130 only.
Batch Mode in Serial Execution
High concurrent activity and/or low number of cores can force queries to run in serial. Previously serial queries would get forced to run in row mode, resulting in a double beating from lack of parallelism and lack of batch mode. SQL Server 2016 can run batch mode even when degree of parallelism (DOP) for a query is 1 (DOP 1 means the query is run serial). SQL Data Warehouse at lower SLOs(Service Level Objectives) (less than DWU1000) runs each distribution query in serial as there is less than one core per distribution. With this improvement, these queries now run in batch mode.
Let me show you this with examples.
SQL Server 2014
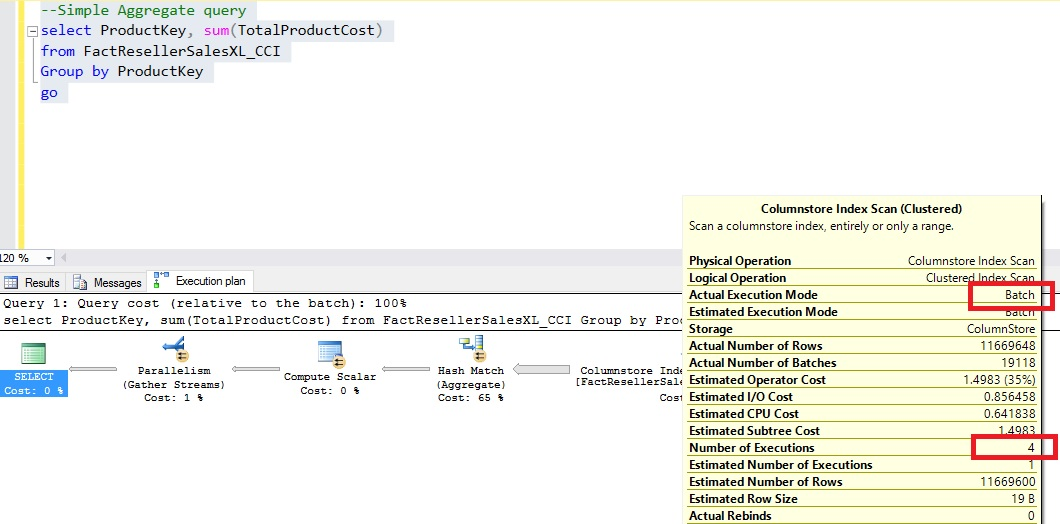
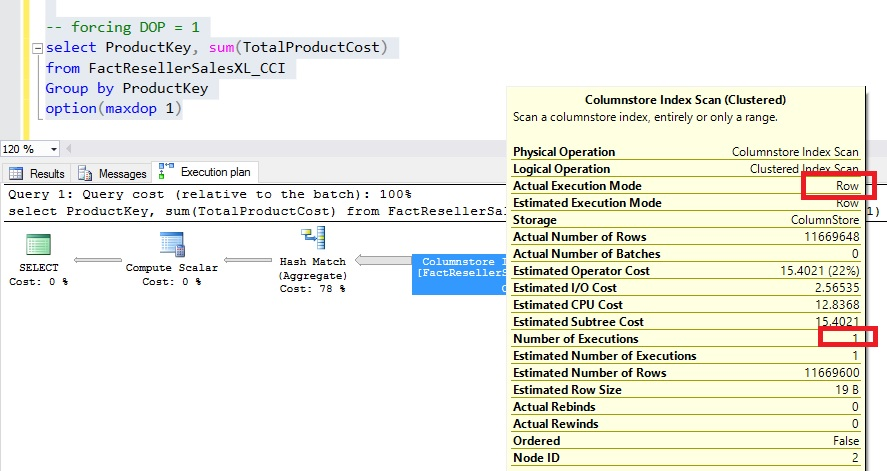
On the SQL Server, I ran a simple aggregate query where MAXDOP was configured to 0, which enables SQL Server to select the available DOP. The query was run in BATCH mode as shown below, with four threads. The execution time of query - CPU time is 626 ms and time elapsed is 354 ms.
Then, I ran the same query but explicitly specified DOP = 1 to force single-threaded execution. In RowMode, the query ran single threaded as shown in below image. The execution time of query was increased by eight times, i.e., to 2617 ms from 354 ms.
SQL Server 2016
On the same machine, I ran the same query ‘as is’ in SQL Server 2016. The query ran single threaded at DOP = 1 as shown in below image. As shown, the execution of query was carried out in Batch Mode.
On SQL Server 2016, the execution time of query was much quicker in single-threaded execution when compared with SQL Server 2014, even in multi-threaded execution. The key reason was another performance optimization known as aggregate pushdown that was added to SQL Server 2016. The execution times of SQL Server - CPU time = 110 ms and Time elapsed = 315 ms.
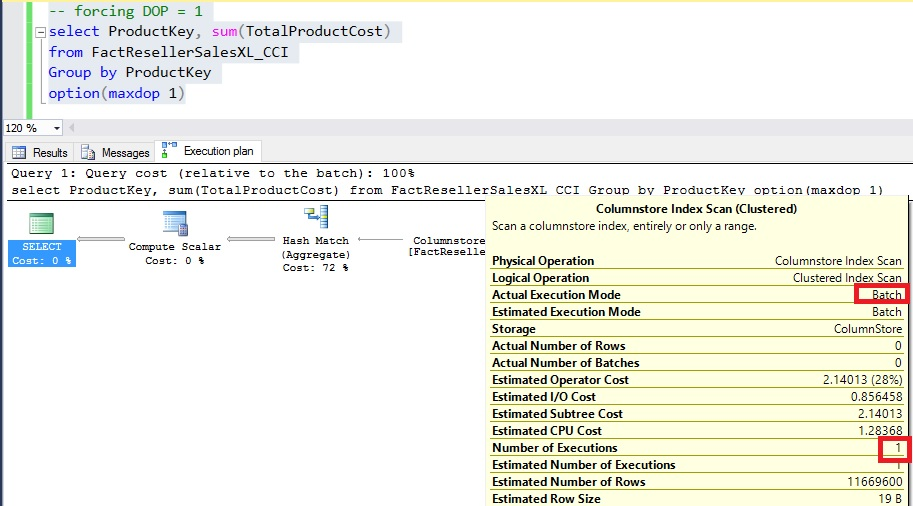
I observed that there was no performance cliff with SQL Server 2016 and the queries continued to leverage BatchMode execution, regardless of the DOP.
String Predicate Pushdown
The string predicates can be pushed down to the SCAN node by Columnstore in SQL Server 2016. This results in a considerable improvement in the query performance. To minimize the number of string comparisons, the String predicate pushdown leverages dictionaries. Let's see this in two examples.
SQL Server 2014
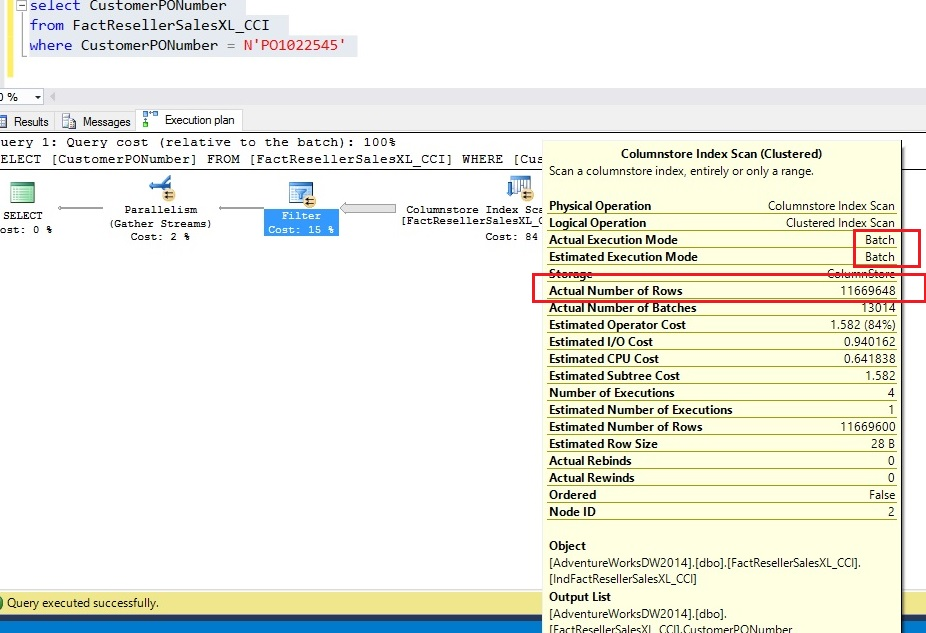
The Columnstore index was indeed executed in BatchMode, and 11+ million rows are returned. So, the string predicate was applied to all the rows at the ‘Filter’ node. The execution time for the query: CPU time = 3984 ms and Time elapsed = 1185 ms.
SQL Server 2016
SQL Server 2016 pushed the string predicate to the SCAN node and only 12 rows were returned unlike 11+ million rows in SQL Server 2014. Also, there was no explicit ‘Filter’ node because there were no delta RGs. The query execution time improved as well, with CPU time = 2671 ms and Time elapsed = 987 ms.
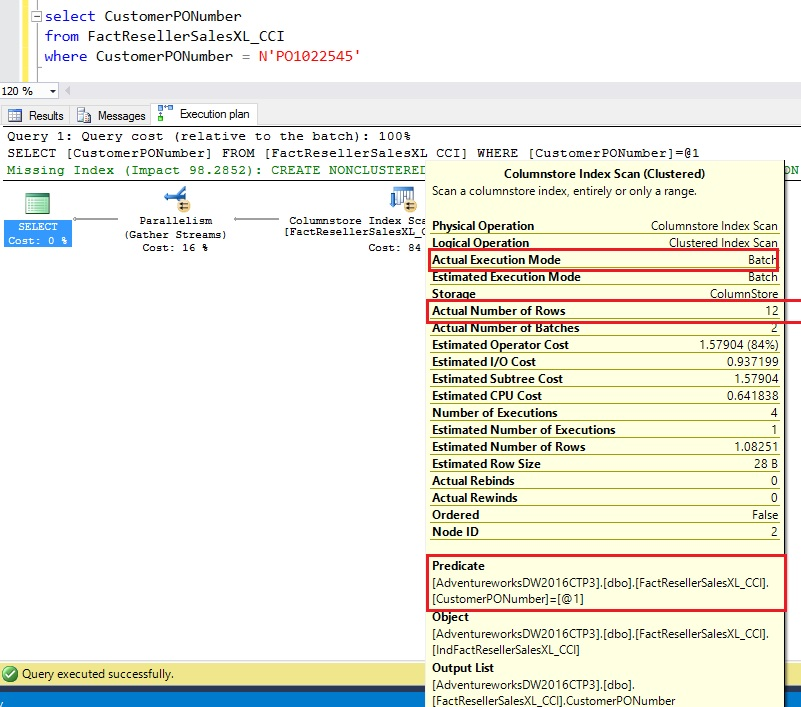
I got this improvement in query performance automatically when I upgraded to SQL Server 2016. This optimization is available across all database compatibility modes.
A couple of important points to note about string predicate pushdown:
It works only on compressed rowgroups
If the number of entries in the dictionary are larger than 64K, this optimization is not available. I expect this to be a rare case
Aggregate Pushdown
Aggregates are a very common construct in analytic queries. With a Columnstore index, SQL Server processes aggregates in BatchMode, thereby delivering order of magnitude better performance when compared to rowstore. SQL Server 2016 takes the aggregate performance to the next level by pushing aggregate computations to the SCAN node.
Let me show you a practical example that differentiates the aggregate processing between SQL Server 2014 and SQL Server 2016.
SQL Server 2014
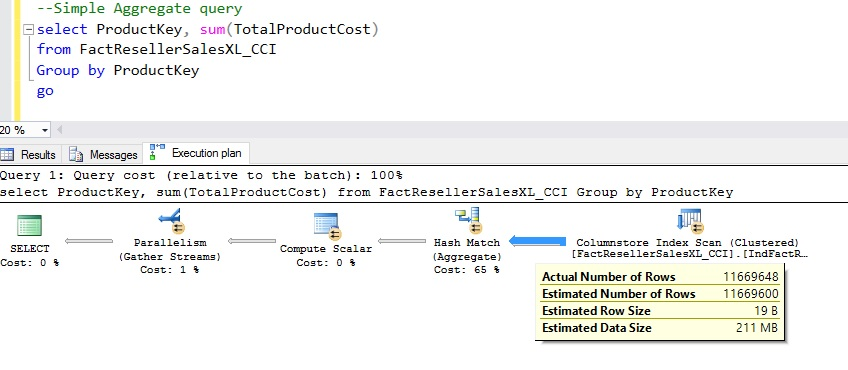
The picture below shows an aggregate query and its execution plan. Note that all 11 million rows flow from SCAN node to the AGGREGATE node. The SQL Server Execution Times: CPU Time = 547 ms and time elapsed = 389 ms.
SQL Server 2016
The same query was run ‘as is’ on SQL Server 2016 and the picture below shows the aggregate computation was indeed done at the SCAN node. The query execution time for this case was 2x lower than what I saw with SQL Server 2016. A more interesting number is the CPU time which was 3x lower than SQL Server 2014. The SQL Server Execution Times: CPU time = 171 ms and Time elapsed = 167 ms.
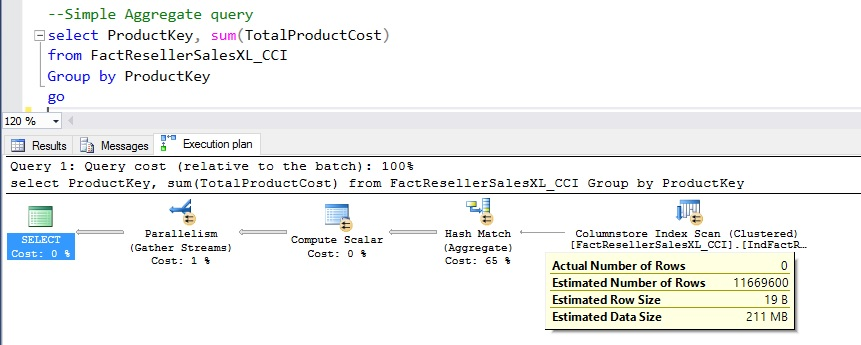
Other interesting thing to notice is that the SCAN node has a property to show the number of rows that were aggregated locally. As expected for the example above, as shown in the picture below, all the rows were aggregated locally.

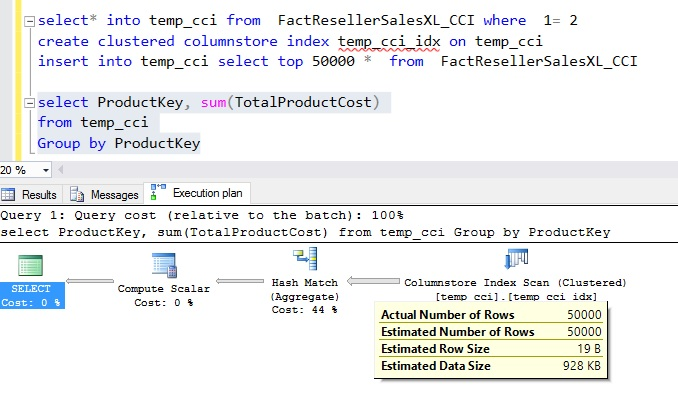
To learn whether Aggregate pushdown optimization is available for delta rowgroup rows or not, I copied 50,000 rows into a new table, temp_cci, with a Clustered Columnstore Index. I ran the same aggregate query as depicted in the below image. I noticed that all 50,000 rows were flowing to the AGGREGATE node from the SCAN node.
So, I observed that when I upgrade my application to SQL Server 2016, the aggregate pushdown gives a performance boost automatically, requiring no changes to my query. Here are the supported cases for Aggregate push down.
- The aggregates are MIN, MAX, SUM, COUNT and COUNT(*)
- The input and output datatype fits within 64 bits
- Tiny int, int, big int, small int, bit
- Small money, money, decimal and numeric which has precision <= 18
- Smalldate, date, datetime, datetime2, time
Aggregate pushdown is not supported for
- A distinct aggregate
- A string column
- A virtual column
Thus, I observed the above performance improvements in SQL Server 2016 for the Columnstore Index and BatchMode Execution when compared with SQL Server 2014.
