Introduction
System Center Operations Manager (SCOM) 2007 is an enterprise tool designed for monitoring the health state of Windows applications in a network domain. One of these applications is SQL Server. SCOM ships with functionality to monitor a number of aspects of SQL Server operation, such as service availability, job failures and configuration changes. One of these areas is database blocking. However, the level of information made available by the out-of-the-box functionality is minimal at best, necessitating the need for a custom solution.
When first starting to work with SCOM customization, a database professional is faced with several challenges. First, because the tool is intended for use with any Windows application, not just SQL Server, on-line database-specific information is not easy to come by. Even techniques potentially applicable to database problems are usually communicated in a non-database context making it difficult to translate to a SQL Server scenario. Second, the Microsoft documentation is quite limited and does not even cover the SCOM fundamentals thoroughly, let alone anything pertaining to SQL Server. Third, the tool itself is riddled with inconsistencies (and some bugs), is, in my view, counter-intuitive in some areas, and, generally involves a steep learning curve for anyone brave enough to probe its secrets.
It is all worth it though. As we will see, the rich returns one gets out of SCOM customization far outweigh the amount of effort required to get it to work as expected. I will not even go into how long it took me to do this work, it is embarrassing. Part of it being my first SCOM project, part of it the obstacles mentioned above, the hope is that this article and others before and after will continue to shed light into the dark corners of SCOM, making the transition to this really powerful tool all the more easier for database professionals in the future.
Initial Attempts
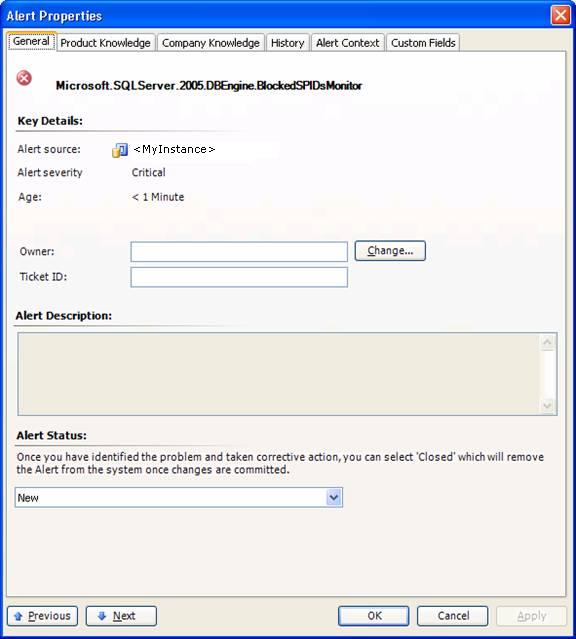
Our requirement was to expose blocking occurences (with wait times > 10 min) in a database server as alerts on the SCOM console, while also triggerring email notifications to our DBA group. The alerts were to contain basic information typically obtainable from the sysprocesses table, such as the SPIDs involved in the blocking, along with the logins, programs, wait times, host names etc. Right at the outset, I was faced with a challenge. Detection of blocking conditions in the SQL Server management packs (MPs) that ship with SCOM is done through monitors, but to get the monitors to generate an alert when blocking is detected requires overrides of several of the monitor parameters. Unfortunately, alert description is not one of the parameters to override, even though it is empty by default:
One option to get the alert to display custom information was to create a diagnostic task that would fire as soon as the alert took place. The task would run a custom script that would query the SQL instance and send email to our team containing the blocking information. Unfortunately, due to a bug in the current version of SCOM, I was unable to create such a task. According to Microsoft support, this is a known bug scheduled to be fixed in an upcoming release.
At that point I was ready to admit defeat and accept the rather imperfect default blocking solution, when two things happened: I opened a PSS case with Microsoft support, and reread - more carefully this time - the articles by Scott Abrants, Grant Fritchey and Thomas LaRock.
Implementation
The strategy was to create two custom rules. The first rule would query the database server for blocking conditions at set intervals and would report any such occurrences with a custom description in the Application Event Log of the computer in question. The second rule would scan the Application Log periodically and generate a critical alert with the description taken from that of the event. Our subscription would then pick up the alert and send us an email as is done with all other critical alerts we are currently receiving. To cover both SQL 2000 and SQL 2005 instances, the first rule was actually split into 2 rules, one for each version of SQL Server in our environment.
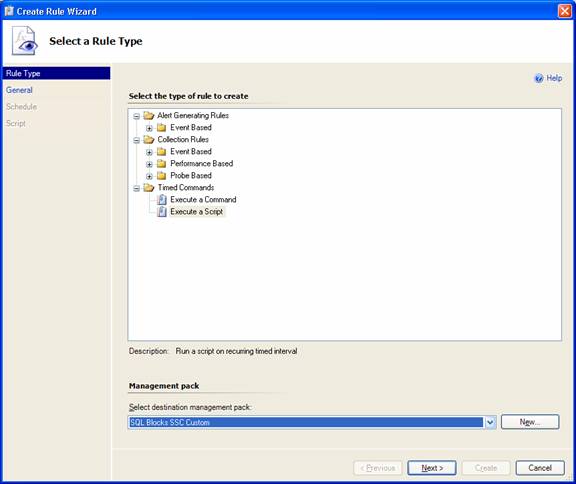
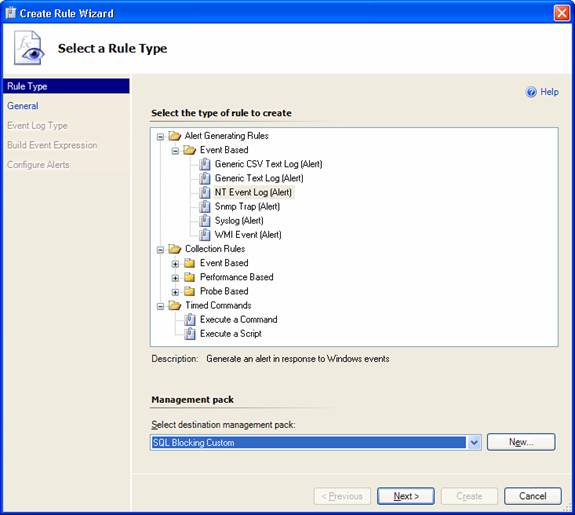
To create the 1st rule, in the Authoring pane of the SCOM console I right-clicked on the Rules node and selected Create a New Rule. Under Timed Commands, I picked the Execute a Script type and declared the destination management pack that I wanted the rule to reside in:
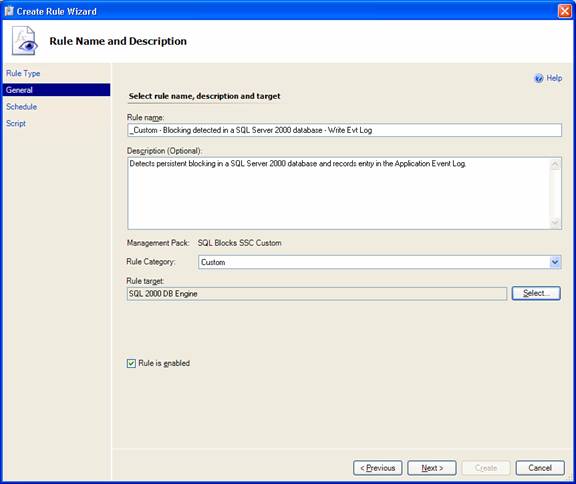
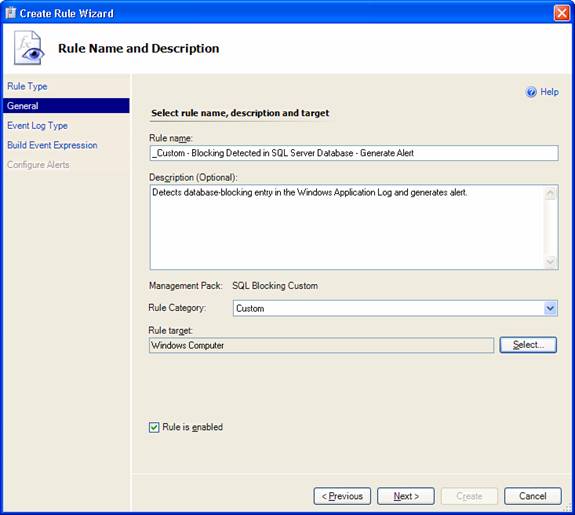
In the Rule Name and Description page, I entered the Rule name and a short Description and picked the Rule target (the group of computers that the rule would run on) - SQL 2000 DB Engine (an analogous rule was created targetting the SQL 2005 DB Engine group):
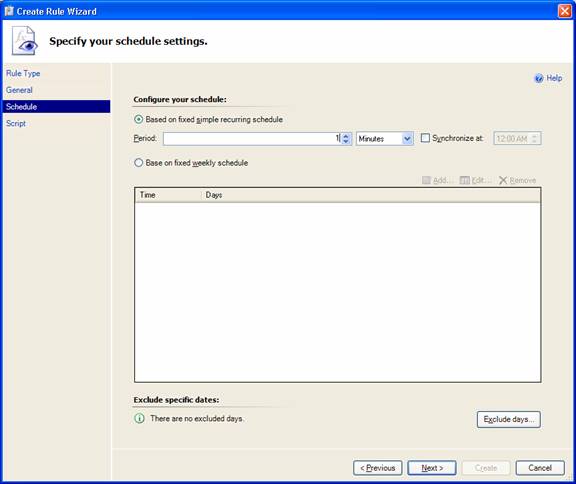
In the Schedule page I set the rule to run every minute:
It was now time to enter the script that was to run at each of the target computers (the script will be described below):
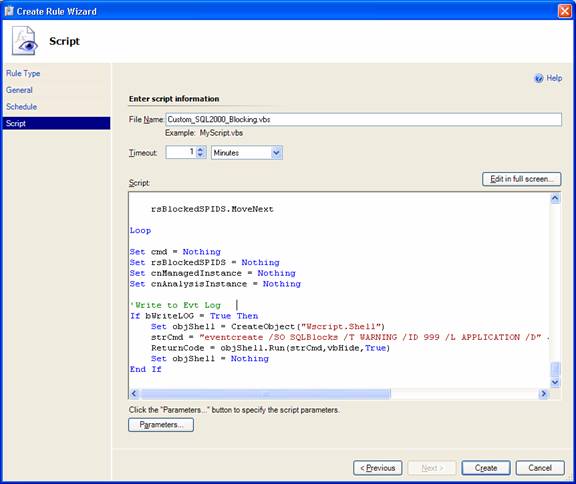
The script accepts one input parameter, the SQL Server instance. In SCOM terminology, this corresponds to the ConnectionString parameter (see discussion in Grant's article). To declare the parameter I clicked on the Parameters... button in the screen above. In the resulting dialog I clicked the Target button and selected ConnectionString from the dropdown list:
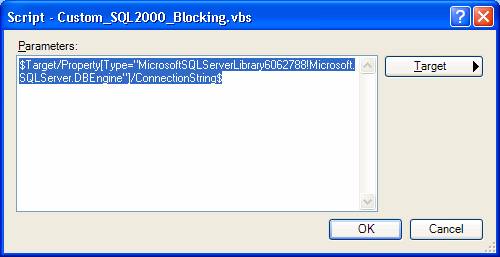
I now had a rule that would execute the vbs script every minute to write an entry to the Windows Application Log should a blocking condition of duration over 10 min occur. But that was only half the story. To get SCOM to detect the event and fire an alert, one more rule was needed.
In the Select a Rule Type page, under Alert Generating Rules, Event Based, I picked NT Event Log (Alert) and selected the hosting management pack as before:
As for the first rule, in the Rule Name and Description page I entered the rule name and target (Windows Computer):
In the Event Log Name page I selected Application to guide the rule to read events from the Application Logand clicked Next.
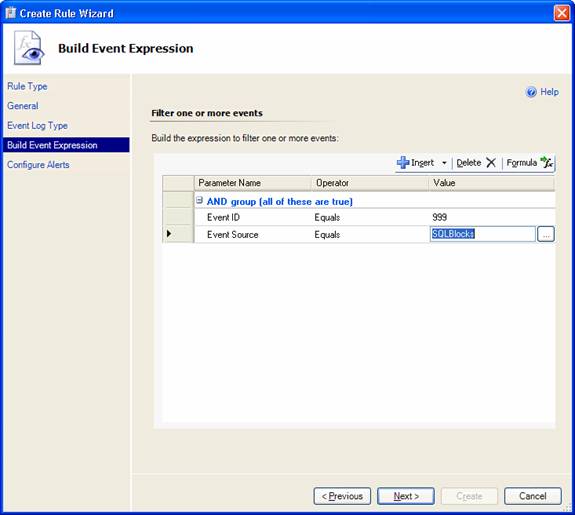
In the Build Event Expression page I specified the filters the rule would use to scan the log for blocking events. These events are created by the first rule with Event ID 999 and Event Source SQLBlocks. I therefore specified these two values as filters:
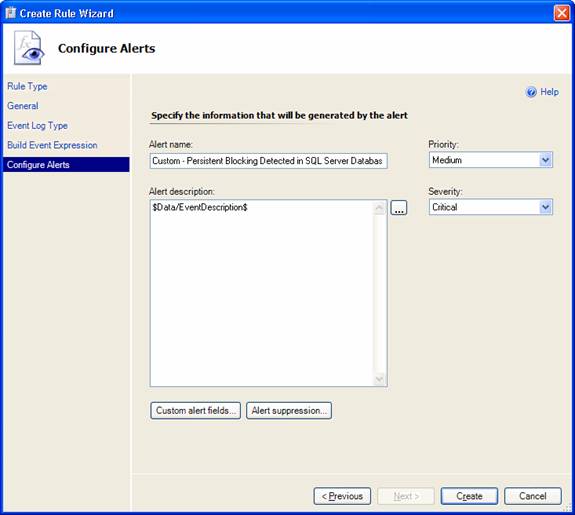
I now had to configure the alert settings. I entered the alert name, priority, severity and, most importantly, the description, which would be taken from the event description, and pressed Create:
My custom rules were now created: two rules for recording blocking events in the Windows Application Log for the SQL 2000 and SQL 2005 database engines, respectively, and an alert-generating rule for scanning the Log and generating alerts.
The Event-Generating Script
Because of differences in the system information available in the SQL 2000 and SQL 2005 database engines, I used two vbs scripts, one for each version of SQL Server. In each script I connect to the manageddatabase engine - given by the ConnectionString context parameter mentioned earlier - and check for blocking lasting longer than the value of a pre-set iWaitInMinutes parameter (my requirement was 10 min). If such blocking is detected, all records pertaining to blocking and blocked processes are returned and a formatted alert-description string is constructed. This string is then sent as part of the event-creation command to the managed computer in question and the entry is recorded in the Application Log.
It is worth emphasizing here that managed database engines (and computers) are all those discovered by Operations Manager in the network domain. Therefore, apart from the initial effort of constructing the scripts and creating the rules, as described above, no work is required to deploy this functionality to each SQL instance separately. SCOM takes care of that. This automated discovery of targetted objects represents the true power of SCOM.
In addition to the iWaitInMinutes parameter, a second numeric parameter was defined. The event-creating rules were set to run quite frequently -once a minute - to ensure that no persistent blocking events were missed. That meant, however, that, once persistent blocking was detected, events (and alerts) would be generated once a minute, until the blocking condition was resolved, spamming us with unwanted email. So, while we did not want to miss any important information, we also wanted to limit alerts and email notifications to a 10-minute frequency, while blocking was still on-going: this is the iAlertFreq parameter. I also wanted to record blocking data - including the SQL text involved - in a central repository database for later analysis: this is defined by the sAnalysisInstance and sAnalysisDatabase parameters. I should note that the code for storing blocking data in an centralized database serves a second function: based on the iAlertFreq parameter as input, as well as recent history, a determination is made whether a new event entry in the App Log should be created, therefore satisfying the alert-frequency requirement.
Testing
In our company we have SCOM installed on both our test and production environments. That gives us the flexibility to test out new functionality without the risk of burying our support team with bogus test alerts. Once convinced that the new features work OK, we can then export them as custom management packs to production.
In order to repetitively and consistently test the new functionality, I needed a script that would induce blocking at will in our TEST servers.
The script I used is shown here:
set nocount on
begin tran
while 1=1
update TESTDB.dbo.testTbl set testCol ='jjkjsq'
--rollback tran
------------
--2nd window:
--SELECT * FROM TESTDB.dbo.testTbl
The script consists of 2 parts. The first part - up to the line reading "--2nd window" - is to be run in the same window/session of Query Analyzer or SQL Server Management Studio editor. The 2nd part is to be run in a second session. Run this way, I was then able to simulate a blocking condition in which the blocking and blocked spids were those corresponding to the first and second sessions, respectively. Through small modifications to the original script, it was then easy to generate scenarios with an ever increasing number of blocking and blocked spids.
Limitations
To get an email notification sent to me whenever a blocking alert was generated in the console, I created a subscription targetting the SQL Server Computers group, and notifying on alerts of severity Error.
One of the challenges was deciding which information to display in the email. Given that much of the blocking information was recorded in a central repository for later analysis, it was important that the text in the email be kept short and concise. I was actually forced into this by another unexpected limitation: after raising the total number of spids in the blocking scenario to more than 10, I started getting odd access-denied errors in the Ops Mgr Event Log. Those seemed to be tied directly to exceeding a limit in the length of the event-description string, because, as soon as the number of spids was brought back to fewer than about 10, the blocking events were again created normally in the Application Log.
Being able to record the SQL Text of the blocking and blocked spids in a database was a major factor for considering a centralized analysis repository. This information, coupled with other details of the blocking events, would then help us try to alleviate the blocking through indexing and query tuning strategies. Unfortunately, in the case of SQL Server 2000, it was not to be. Both the DBCC INPUTBUFFER(...) and ::fn_get_sql commands require sysadmin access on the SQL instance, and these rights are not transferrable. The Local System account, under which the OpsMgr Health Service is running in each managed computer, does not have these privileges by default, neither is it good practice that it be granted them explicitly. This was not an issue for SQL 2005 instances: the Dynamic Management Views used for retrieving the SQL Text involved were readily accessible by Local System with no additional configuration necessary.
Again, to avoid giving Local System elevated rights on the SQL instances, access to the central repository database in the vbs scripts had to be done through SQL authentication. The disadvantage with this method is that the password of the SQL account is exposed in the scripts and is visible to anyone with administrative rights on the Ops Mgr console. A workaround is to use a SQL account with severely restricted permissions on the SQL instance. In the present case the SQL account I used was only be able to execute the 2 stored procedures used for storing the data with no additional permissions granted.
Results
Here is a sample email notification. The customized part starts after "Alert description":
Alert: Custom - Persistent Blocking Detected in SQL Server Database
Source: compName.domainName.com
Path:
Last modified by: System
Last modified time: 8/24/2008 4:40:53 PM
Alert description:
Server\Instance: servr\instanceName
BLOCKING SPID(S)
----------------
Blocking SPID: 80
Database: TESTDB
Host: compName Program: Microsoft SQL Server Management Studio - Query
Cmd: UPDATE Login: loginName
BLOCKED SPID(S)
---------------
Blocked SPID: 82
Blocked By: 80 Wait time (ms): 904640
Host: compName Program: Microsoft SQL Server Management Studio - Query
Cmd: SELECT Login: loginName
Blocked SPID: 94
Blocked By: 82 Wait time (ms): 892500
Host: compName Program: Microsoft SQL Server Management Studio - Query
Cmd: UPDATE Login: loginName
Alert view link: "http://rmssrvrname:51908/default.aspx?DisplayMode=Pivot&AlertID=%7ba53e9905-f9bb-43c6-a6ce-c2c0773cb23d%7d"
Notification subscription ID generating this message: {B03702CF-734F-D137-D16B-B738358733BE}
Summary and Conclusion
Here I have described a methodology for monitoring blocking in SQL Server databases by leveraging the power of Operations Manager 2007. The scalability and maintenability of this solution simply cannot be overstated. Whether you have 10, 100 or 1000 SQL instances in your environment, the implementation is the same. You need the same rule(s) for detecting blocking and creating entries to the Event Log and the same rule for detecting the Log entries and generating alerts. Once that basic functionality is in place, Ops Mgr automatically runs it on every computer discovered in its environment. Any changes to that environment -eg. added or dropped servers - are detected automatically as well. Once modifications to the custom code are made in that one place - the rule/monitor in question - they at once affect every managed server in the enterprise.
It is these strengths that I believe will increasingly make Ops Mgr a monitoring tool of choice for database professionals in the years to come.


