

All too often we come across a SQL Server performance issue where there is no hardware bottleneck of significance. Where is the next place to check? One thing to look for is blocking. Blocking is SQL Server’s version of disk or CPU queuing but is focused on the actual data. SQL Server protects its data and its end users by ensuring that the data they get is accurate. I need to retrieve data at the same time Fred is updating some records. Fred starts his statement execution first and thus SQL Server decides to block my retrieval until Fred’s update completes.
This blocking can sometimes be seen running the following query:
select spid, blocked, waittype
    , waittime, lastwaittype, dbid
    , uid, cpu, physical_io, memusage
    , login_time, last_batch, hostname
    , program_name, nt_domain, nt_username, loginame
 from master..sysprocesses
 where blocked <> 0
 or spid in (select blocked from master..sysprocesses)

The query results will return all active transactions and connections on the SQL Server involved in blocking, identified by SPIDs. If no blocking exists, the query will return no results. The blocked column will show which transaction is doing the blocking of the other transaction(s). There is often a long running chain where SPID X is blocked by SPID Y which is blocked by SPID Z. This is only able to trap real time blocking. More information about the sysprocesses table is available here: http://msdn.microsoft.com/en-us/library/ms179881.aspx.
Often the blocking is not sustained long enough to dig into what is occurring. For sustained blocking tools, like sp_who2 and dbcc inputbuffer can provide valuable information of what is going on. Those two items are outside of the intended scope of this document. Please refer to Books Online for their usage.
Assuming that the blocking is not sustained long enough to use the above mentioned tools, all is not lost. Enter SQL Server Profiler. SQL Server Profiler is the best tool for identifying query performance times and other historical SQL Server metrics. The attached script will start a SQL Server Profiler Server Side Trace. The same trace can be defined manually through the interface which will be shown later in the document.
Scripting a trace is the preferred method for monitoring over long periods of time however the same trace can be defined through the SQL Server Profiler Application. The Application adds overhead if it is run local on the database server however it does present the data in real time through the GUI.
Prior to running a trace to monitor blocking, either through scripting the trace or using SQL Server Profiler, you must verify what SQL Server has configured for its default blocking duration threshold. This is how long in seconds a SPID needs to be blocked before it will be captured. The Blocked Process Threshold option must be set regardless of if the trace will be scripted or run with the GUI. This is completed by running the following statements which are included at the top of the attached script:
sp_configure 'Show Advanced Options', 1
go
Reconfigure
go
sp_configure 'Blocked Process Threshold (s)'
This will return the currently set value in seconds for the Blocked Process Threshold configuration option. This option be changed by running the following statement after adjusting the value to the desired threshold.
sp_configure 'Blocked Process Threshold (s)', 1 /*change value to min duration to capture*/go
reconfigure
The attached trace script has several additional sections within which will need some modifications. When scripting a trace to run the Max File Size, File Name, and Trace Stop Time are all important to set. This prevents the trace from running beyond the window of time desired as well as from filling the storage location.
set@maxfilesize = 50 /*Max MB for output file*/set @TraceFile = N'c:\perflogs\traceblockingtest' /*insert filename here excluding file extension*/set @StopTime = '2011-04-20 10:00:00.000' /*set date and time when trace should stop automatically*/
Once the configuration options have been configured the trace portion of the script can be executed including the parameter declaration section. It can be run at one time in its entirety as well. When creating a trace the a script all that is returned when executed in a query window is the trace id. This is an important number to remember however it can be identified later using fn_trace_getinfo (http://msdn.microsoft.com/en-us/library/ms173875.aspx.)
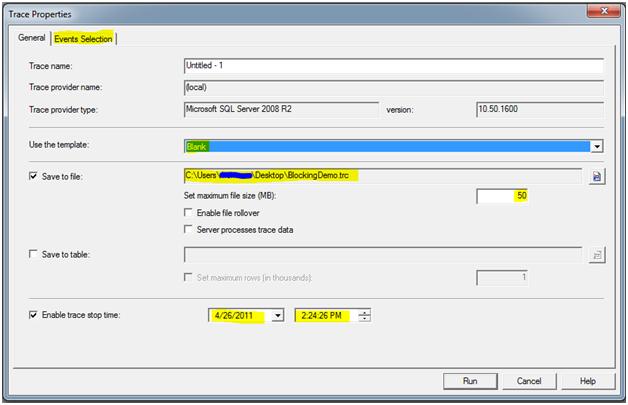
To configure the trace through the GUI start SQL Server Profiler and select File | New Trace. Select the Blank template in the ‘Use the template:’ drop down. Set the same configuration options discussed above including ‘Save to file:’ location, ‘Set maximum file size (MB):’, and ‘Enable Trace Stop Time.’ Once those options are configured select the ‘Events Selection’ tab.
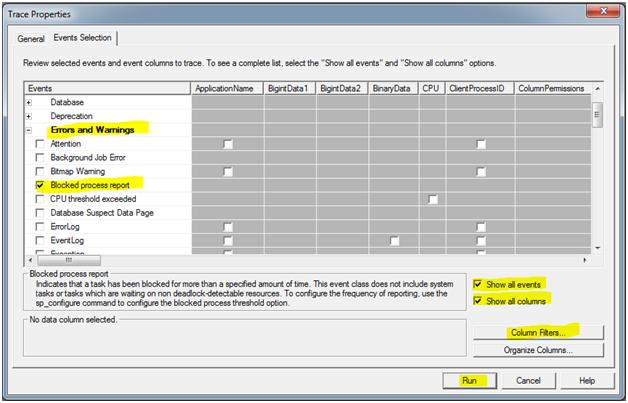
On the events tab ensure that ‘Show all events’ and ‘Show all columns’ are checked. Expand the ‘Errors and Warnings’ section and select the ‘Blocked Process Report’ Item. If this is being run on a server with multiple databases or enough is known to narrow down the user account or machines that are involved click the Column Filters button and set the appropriate filters needed. Click ‘Run’ to start the trace.
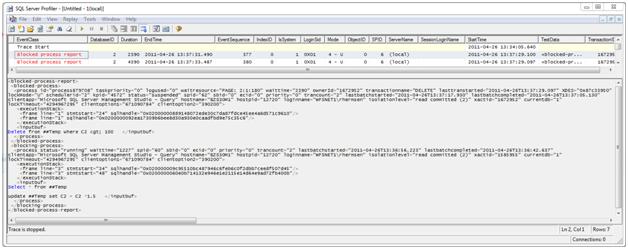
After the trace is run the *.trc file can be viewed in SQL Server Profiler or can be loaded into a database. It will show an XML view of what query was being blocked and what query was doing the blocking. Keep in mind that if it is not exceeding the number of seconds set for the 'Blocked Process Threshold (s)' setting it will not be captured. Below is what SQL Server Profiler will display for the trace while it is running or when a file is opened up.
It shows an XML report of the queries involved in the blocking chain. The first section is the blocked process between the <blocked-process> tags. The actual query is listed in the ‘<inputbuf>’ section. It was a delete statement. The blocking process is listed in the second section under ‘<blocking-process>’. The blocking statement executed in this example was Select followed by an Update as noted in the <inputbuf> tag region. The <process> tag carries enough information to identify the users, applications, and machines involved in many environments however depending on the data and application layers this may be masked to some extent by a web service.
Some level of blocking is expected. Extended blocking or worse, deadlocking, is something that should be avoided programmatically whenever possible. If it cannot be avoided it must be handled gracefully as a deadlock will abandon one of the queries. Once the queries are identified more analysis can be completed on their architecture to determine if modifications can be made to efficiencies. Often inefficient code compounds what may block for less than a second into an issue that can block for seconds or even minutes. Now that your head is spinning fiercely, file this somewhere for later use so that you can have your own aha moment!
Some keys to remember…
1. Set the Blocked Process Threshold (s)
2. Set a trace stop time and max file size
3. Run the Trace
4. Review the results and determine path to remediation

