

Introduction
In this article, we will learn how to create charts from web pages with Power BI. Power BI is an extremely great tool to easily generate reports. We will combine and analyze data from different websites, and we will talk about COVID 19 with the reports.
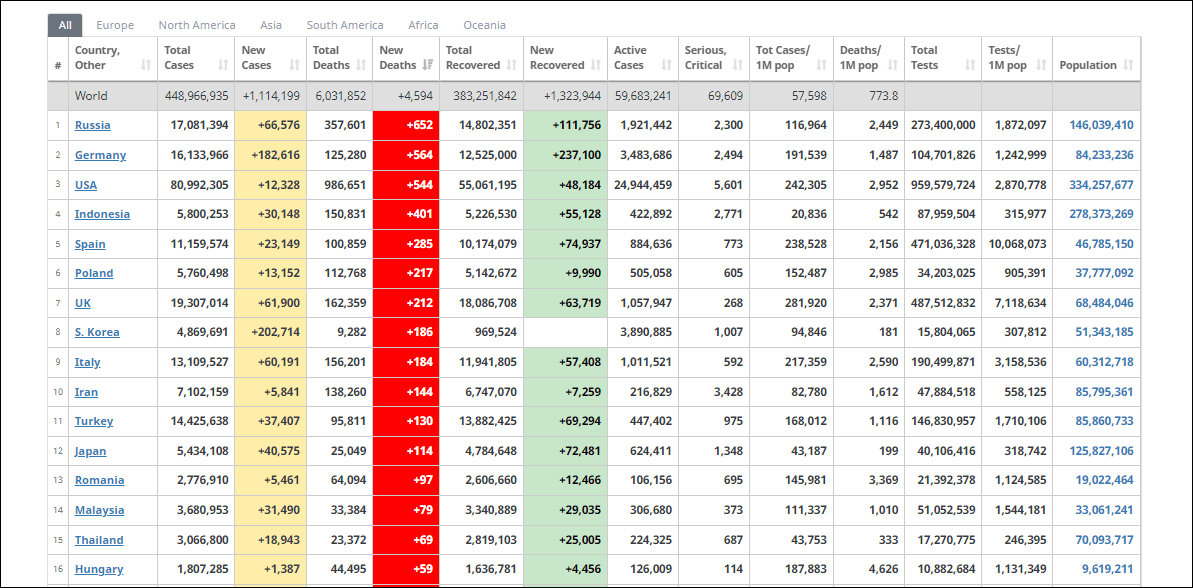
In order to analyze the information, we will use the worldmeters.info website to get information about dead people, infected, new cases, etc.
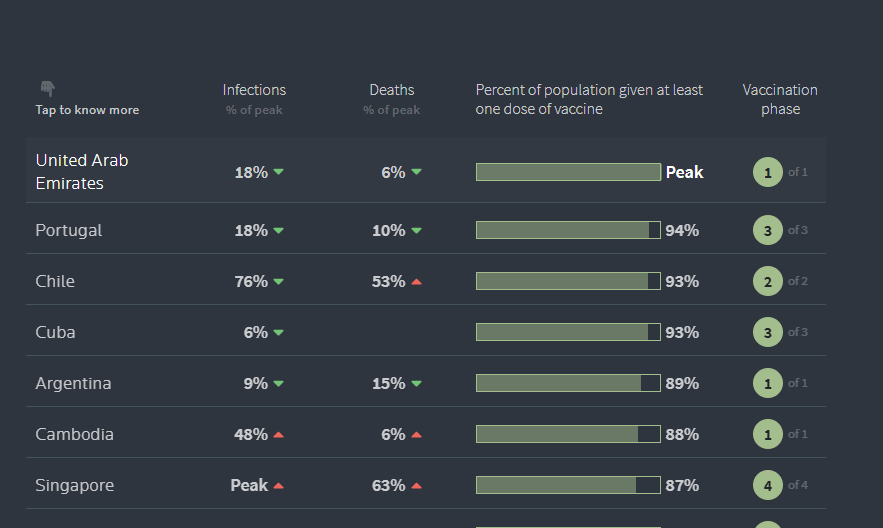
On the other hand, we have a different website, the graphic.reuters.com site contains information about vaccinated people. Can we combine the information from both sites to get nice reports?
The answer is yes. Power BI allows to easily combine data from different sources like a web page, SQL Server, Azure, Oracle, REST API, Excel, JSON, XML files, and many other options.
Requirements to import web pages with Power BI
- First of all, an internet connection.
- Secondly, Power BI Desktop installed.
Getting Started
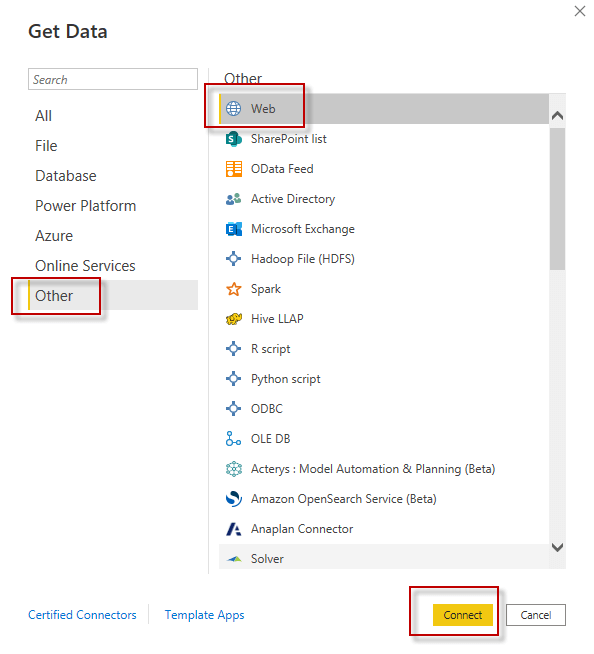
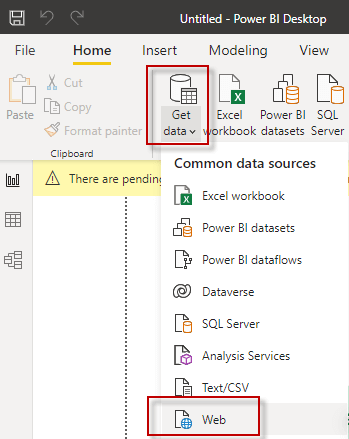
First of all, open Power BI and select the Get data option.

Secondly, select Other>Web and press connect.
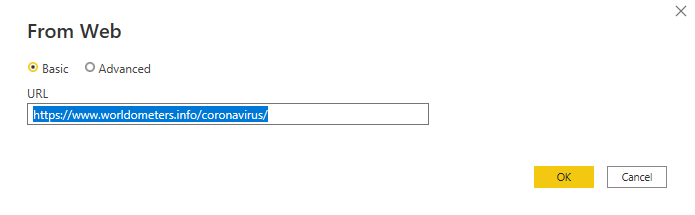
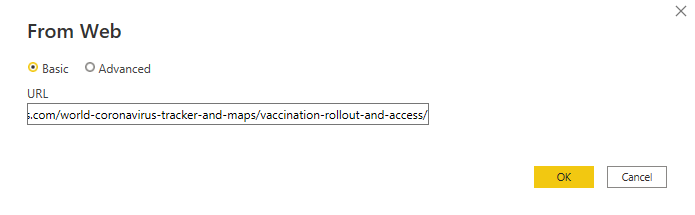
Thirdly, enter the web URL. In this case, enter: https://www.worldometers.info/coronavirus/.
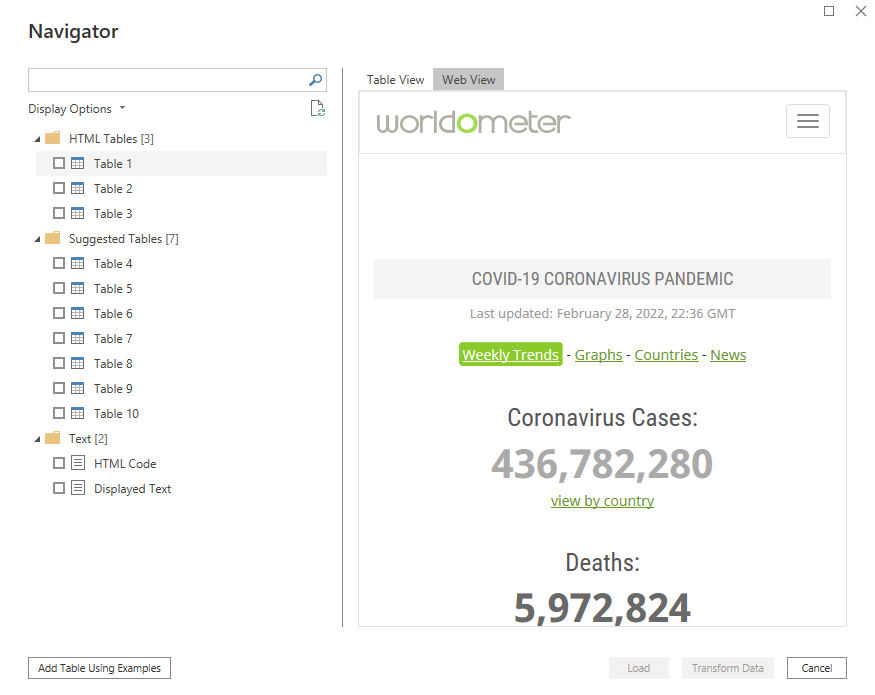
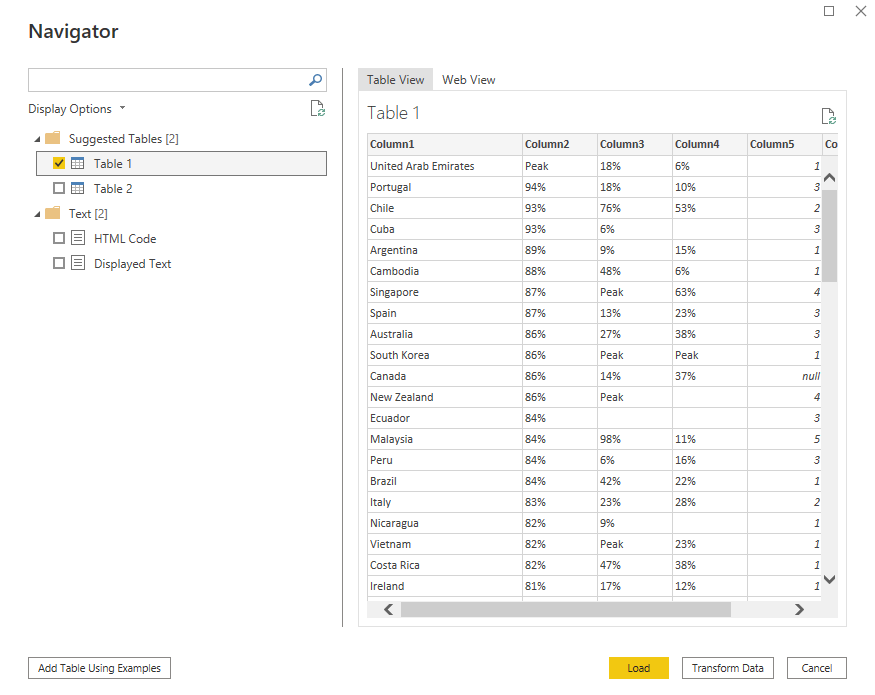
You will see multiple tables from the website.
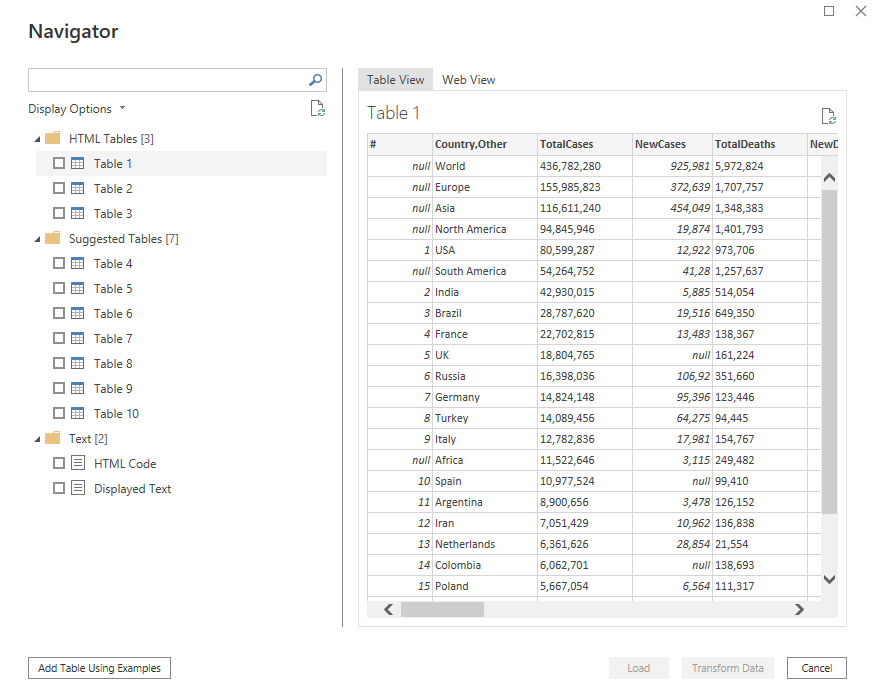
Also, the web view tab allows to see the current web page to check the data.
Select Table1 for this example. You have 2 options in this case:
- You can load the data as it is. This data can be then modified.
- You can transform the data. We will use this option.
Click Transform Data at the bottom, as shown below.

Transform Data to import web pages with Power BI
One thing you can do is change the name of the table. In this example, we will call it CovidCases. We can edit this in the right side panel.
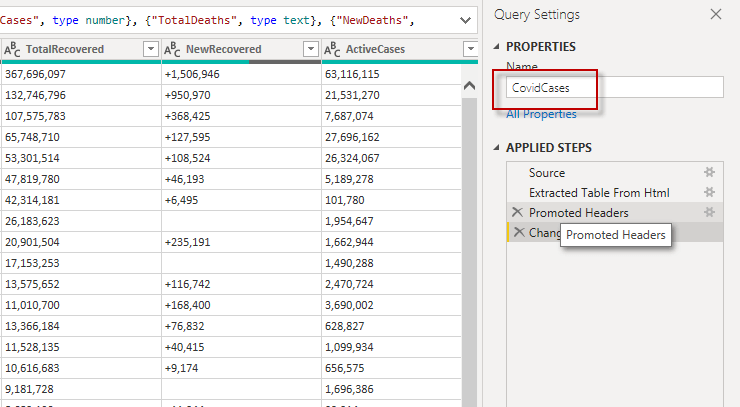
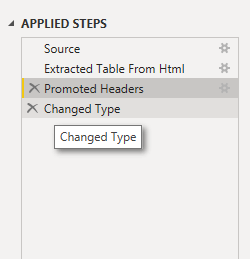
In Power BI, you have the applied steps pane. This is great because it has the list of changes applied and you can remove steps or recover steps removed if necessary.
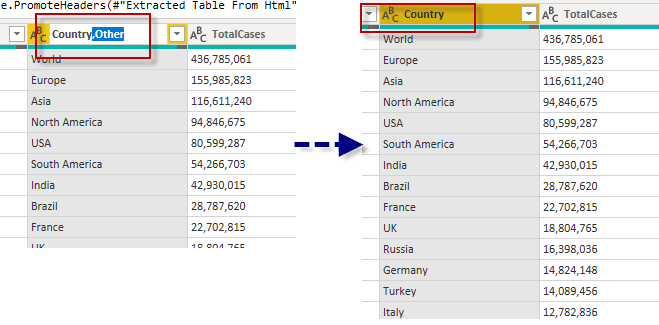
You could rename columns, but you may have problems extracting the data. Rename the column later.
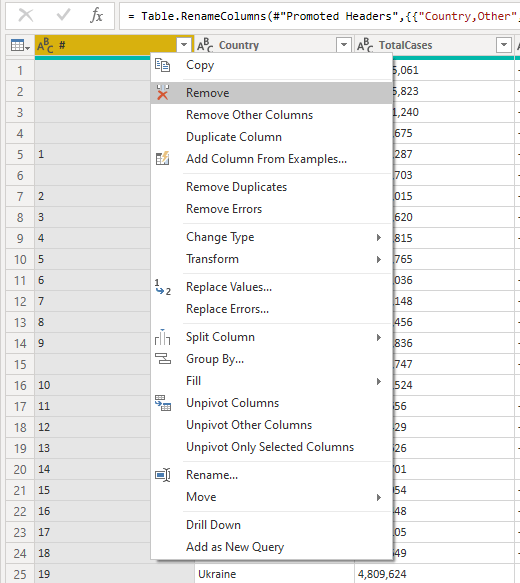
Also, it is possible to remove columns. Remove any column that you do not consider necessary for your reports. Note that you can replace values, change the data type, unpivot columns.
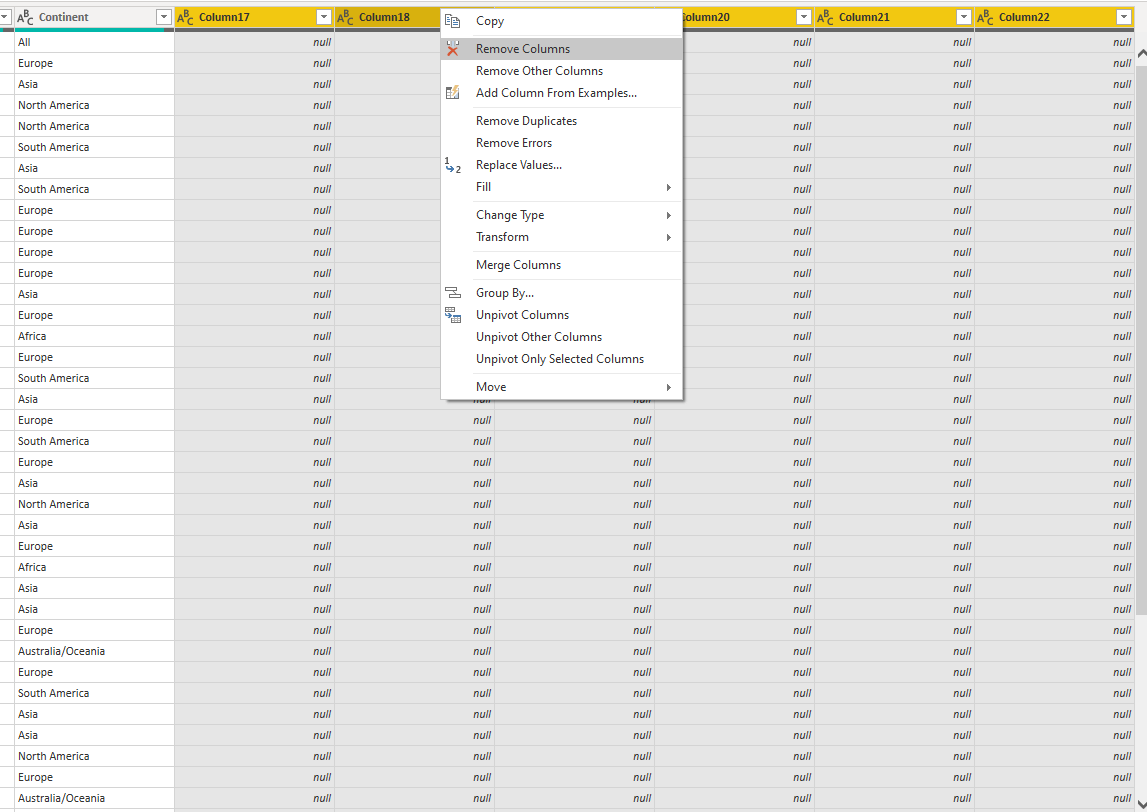
In addition, remove the extra columns with null values.
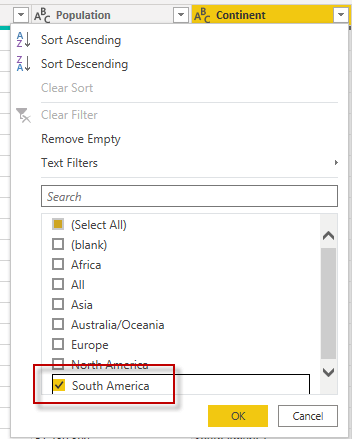
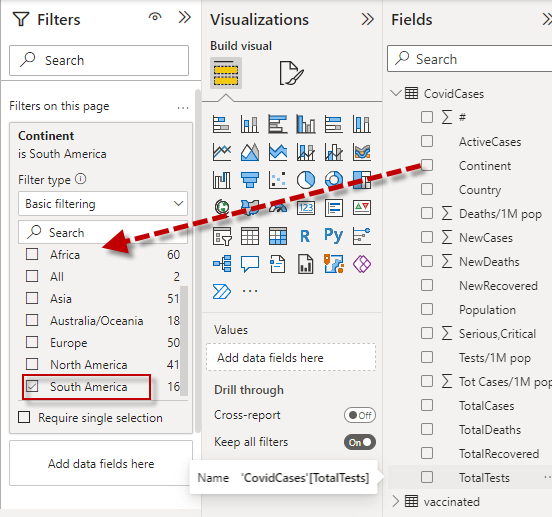
Furthermore, you can add filters to your data. We could for example filter the Continent. In the image below we filtered per continent and we select South America.
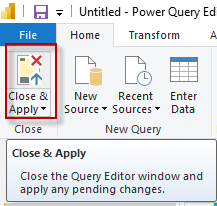
Finally, save your transformations by pressing Close & Apply.

The Other table
We also have the table from graphics.reuters.com. We will repeat the same steps as we made with the other website.
We will use the URL to get the vaccination information.
We will need to rename columns. Column 1 will be countries, column2 vaccinated percentage, column 3 infections, and column 4 deaths.
After all the changes, your table will look something like this.
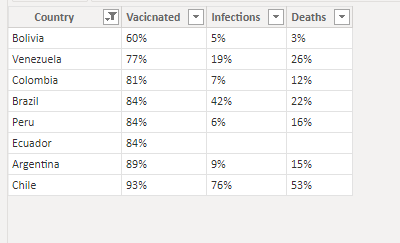
Finally, apply the changes.
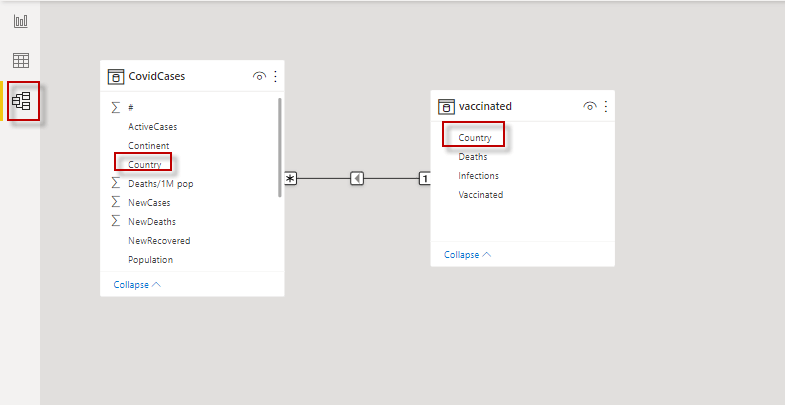
Create a Relationship
There is an option at the left to see the relationships between tables.
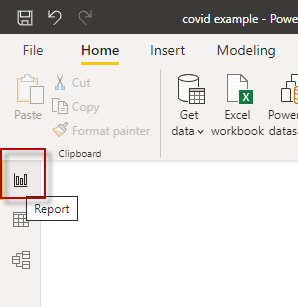
Working on the Power BI report
First of all, click on the report icon on the left to see the report generated
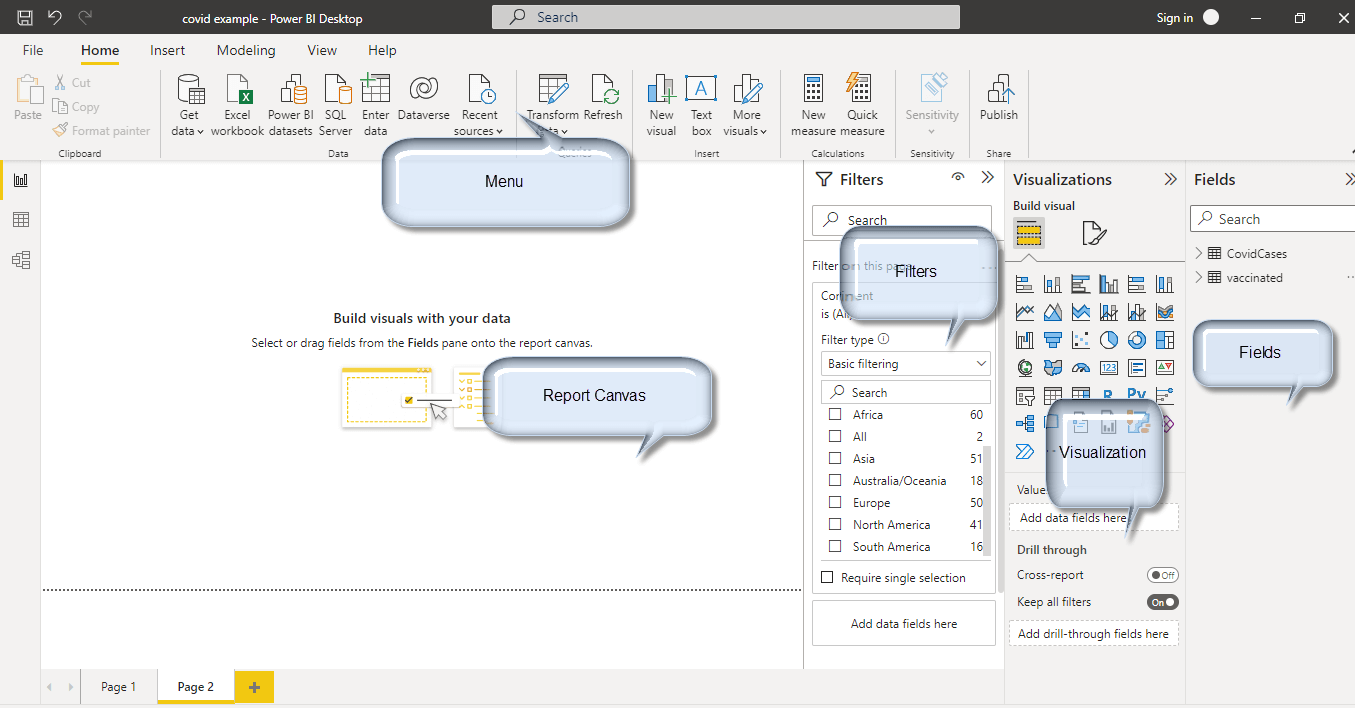
In this section, we will show the parts of the report. You have the report canvas to drag and drop the report components. You have a menu with different options. Also, you can apply filters with the filter pane and you also have the Visualization pane to see all the available reports.
In addition, you have the Fields pane with the 2 tables of the 2 sites imported. You can drag and drop columns from there.
You could for example filter by continent.
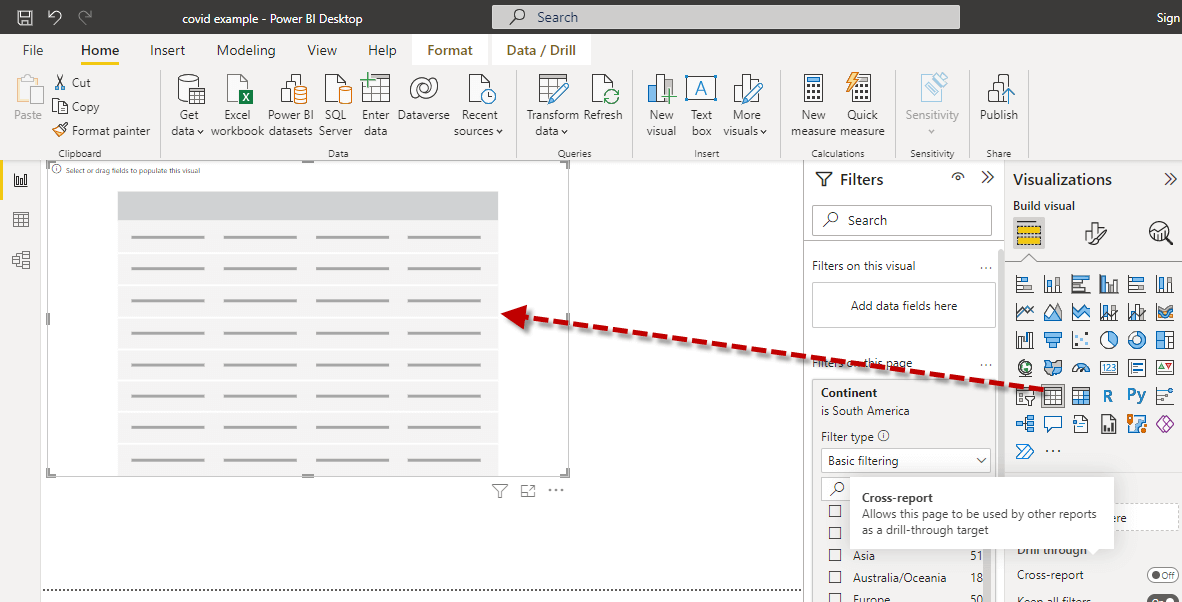
In this example, we will use the table component to visualize data.
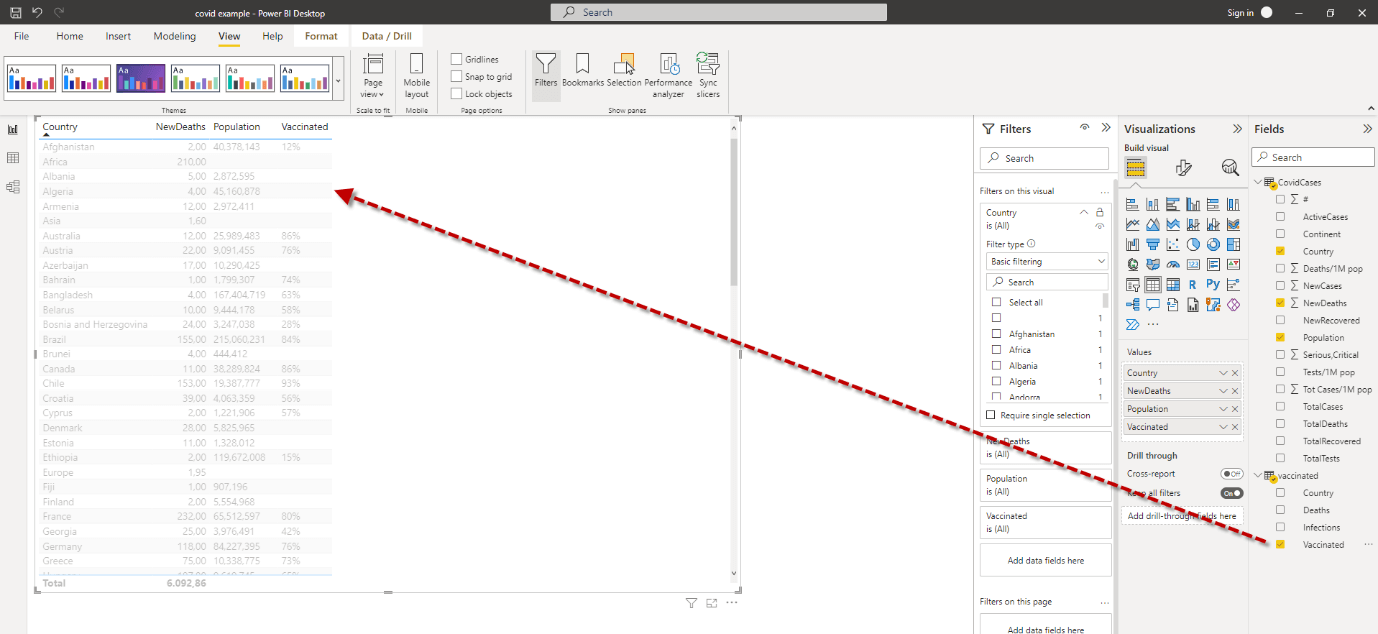
In addition, you can drag and drop the vaccinated people from the other table in the report. Note that you are now having a report from different tables.
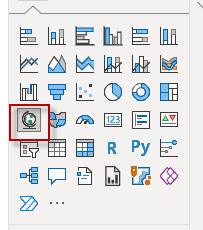
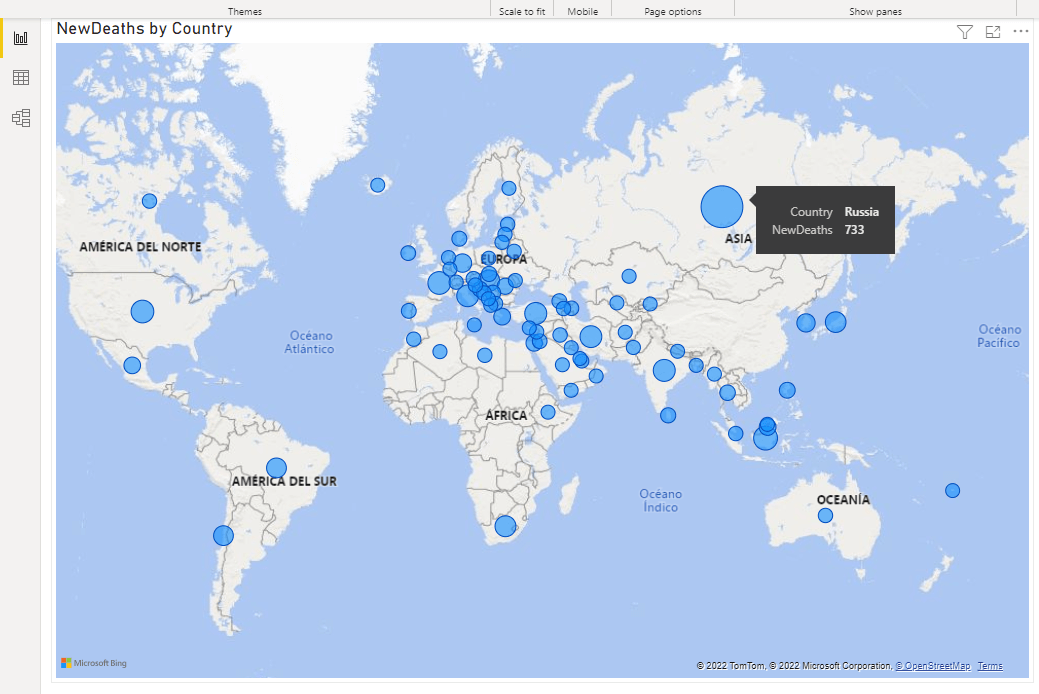
Furthermore, we can use the maps to have a graph of COVID cases per country.
As you can see, the data visualization is impressive.
Conclusion
To conclude, we can say that Power BI is an extremely powerful tool to easily generate reports. In this article, we show how we could extract and transform data from 2 different web pages, create a relationship between both. Also, we show how to create filters, drag and drop data and create a report with maps.