You’ve got a slow query. Maybe it’s one you wrote, maybe it’s one that another developer wrote and they want help with, maybe it’s one that’s running on the production server and the users are complaining about. Regardless of where it came from, it’s slow and you want some help in fixing that.
So you decide to post it on your favourite forum (this one, of course), and see if anyone can help out. Nothing wrong there, there are people who hang around the forums who consider optimising strange queries to be a fun way to spend a Sunday morning. But how do you post it, what information should you include and how much of it?
How not to do it
First, let me show an example (completely made up) of a not-so-great way to post performance problems.
Hi everyone
Can anyone optimise this procedure?
CREATE PROCEDURE VeryImportant
AS
...3000 lines of T-SQL...
Thanks.
What’s so bad about that?
1. The shear scope of the request. If my boss asked me to performance tune a 3000 line long stored procedure, I would likely put aside a full week to do it. It’s not something that can be done in 5 minutes flat.
2. No table definitions, no index definitions. Without those there’s no way to identify missing indexes or implicit data conversions that could be slowing the query down.
3. No execution plan. The exec plan shows exactly how the query is executed and can pinpoint many performance problems.
What really helps
It’s much easier to help out on performance problems and hence much more likely that someone’s going to answer if certain things are done before posting and certain pieces of information included:
1. Narrow the problem down. Rather than posting a 3000 line ling stored procedure, do some investigation first and see where the slow pieces of the procedure are. I demonstrated the breaking down of a procedure in an article written for Simple Talk. It’s quite unlikely that all the queries in the procedure are slow and far more likely that one or two pieces of it are causing the majority of the problem.
2. Include all relevant DDL. Post the definitions of the tables that the queries use along with any indexes and constraints that exist on the table. This can be the create table and create index statements, or just the output of sp_help. Either way, being able to see the columns with their data types and all indexes that exist on the tables involved in the query makes it much easier to see problems like implicit conversions or missing indexes that may be useful to the query.
3. Views and functions. If the query refers to any views or functions, please post the definition of those views and functions. It’s quite possible that the key to the poor performance is in those definitions.
4. Approximate row count. Pretty much everything is fast on 100 rows. Not so true on 100 000 000. Knowing the approximate number of rows in the tables can help focus effort on the parts that are more likely to be slow. Exact numbers aren’t necessary, just an indication whether there’s a couple rows in the table or a couple million.
5. Current performance characteristics. Obviously the query is considered to be slow if it’s being posted with an optimisation request. But how slow are we talking? A query that does complex aggregations over a few million rows probably won’t be running sub-second and so trying to tune one to do so is likely a waste of time. So, is the query currently running in a few seconds, a few minutes or a few hours?
6. Execution plan. The execution plan is the detailed breakdown of operators and data flows that shows exactly how SQL ran (or will run) the query. The execution plan can show exactly where the slow portions of the query are and may well give hints as to the root cause of the problem. Including the execution plan makes it much, much easier for anyone trying to help out to find the cause of the poor performance.
Saving the execution plan
The method of saving and posting the version of SQL that’s being used. Not the version of the client tools, but the version of the database server.
SQL 2005 and above
A very welcome feature that was added to SQL 2005 was the ability to save the execution plan of a query in an XML format, and be able to load that xml file into management studio to see the full graphical plan.
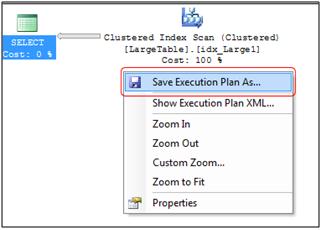
To save the execution plan, click the “Include Actual Execution Plan” in the toolbar and then run the query. Once the query has completed, right click on the plan and select “Save Execution Plan As...” then save the file as a .sqlplan file.


If the query takes too long to run (or doesn’t complete), then the estimated execution plan can be posted instead. This is not ideal as there’s a fair bit of info missing from the estimated plan, so it should only be used when the actual plan is not an option. To get the estimated plan, click the toolbar button “Display Estimated Execution Plan” and then save the resulting plan in the same way.
Once the plan has been saved, zip it and attach the zipped file to your post using the Attachments option found below the main posting text box.

SQL 2000
In SQL 2000, saving the execution plan is a little trickier.
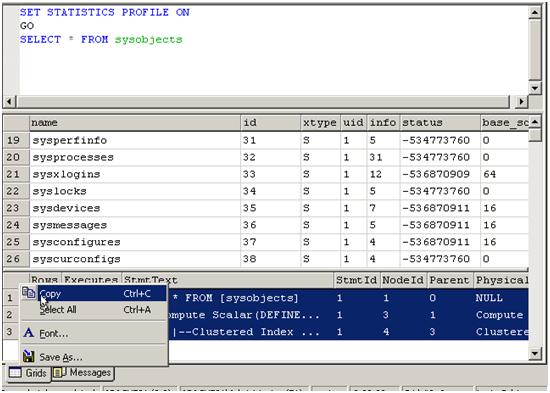
To get the actual plan, add the following line of code before the query and then run it, making sure that the results are going to grid. An additional grid will be returned with the text version of the execution plan.
SETSTATISTICSPROFILE ON
GO
Select the entire grid and copy it. (Thanks to Florian for the screen shot of Query analyser)

Paste the contents into Excel

Save the Excel file, zip it and attach it to your post.
To sum it all up
Let’s try that question from the beginning of this article again.
Hi everyone
I’ve got this procedure that’s running slowly. It takes anything from 20 to 50 seconds to run, so we’re getting application timeouts.
I went through the procedure and there are two pieces that are taking the most time.
INSERT INTO #MyTempTable
SELECT * FROM ...
And
UPDATE SomeBigTable
SET ...
I’ve attached the table definitions, as well as the definition of the function used in the update statement. All the tables involved are fairly small (Couple thousand rows), except SomeBigTable which has close on a million rows in it.
The execution plan for each is also attached.
Thanks.
Much better.
In Conclusion
Performance problems can be hard to resolve at the best of times. When critical pieces of data are left out, that difficulty increases substantially. The more information that can be provided about performance problems the greater the chance that someone’s going to answer the question and that the answer is going to be useful.

