It seems like there are always questions about Wait Types, what they mean, and How to avoid or eliminate them. Over the years, I have collected some of them and their meanings and I will share that with you.
This was written with SQL 2000 in mind, and though the wait types are the same, the applications, syntax, and methodologies I use as examples are from SQL 2000. The basic concepts and informational descriptions I talk about are applicable to either SQL 7 or SQL 2000. Also, before we go any further, let’s have in mind that wait states are a necessary function, wait types describe these functions to give us an idea of what’s happening when it appears that nothing is happening. There will always be waits of some sort in any environment. The ideas
I present here are meant to help in identifying and eliminating or at least reducing the occurrences of them. Hopefully, it will generate enough conversation to fill in gaps that I know are here, or perhaps correct or generate specifics that can be added to a new and improved document based on this one.
WAIT TYPES - FINDING THEM
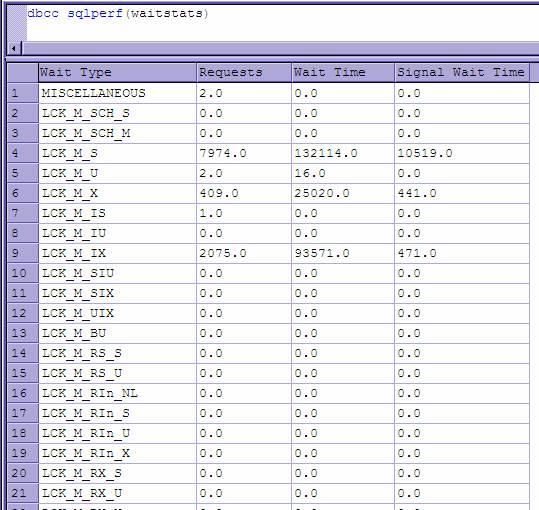
First, let’s give you a way to find them through other means than watching in Enterprise manager. The command: dbcc sqlperf(waitstats) will give you a list of all of your wait types and what the current values for the counters for them are.
Here is an example from SQL 2000.
And of course, you will occasionally see them in Enterprise Manager when monitoring activity.
Now that we can find them, what do we do about them? Here are some suggestions.....
The topmost entries returned are our standard locking architecture from SQL and can be studied in the Books Online.
Here is a quick breakdown of them:
LCK_M_SCH_S
| 0x01
| Schema stability
|
LCK_M_SCH_M
| 0x02
| Schema modification
|
LCK_M_IS
| 0x03
| Intent-Share
|
LCK_M_SIU
| 0x04
| Shared intent to update
|
LCK_M_IS_S
| 0x05
| Intent-Share-Share (Key-Range Lock)
|
LCK_M_IX
| 0x06
| Intent-Exclusive
|
LCK_M_SIX
| 0x07
| Share-Intent-Exclusive
|
LCK_M_S
| 0x08
| Share
|
LCK_M_U
| 0x09
| Update
|
LCK_M_II_NL
| 0x0A
| Intent-Insert-NULL (Key-Range Lock)
|
LCK_M_II_X
| 0x0B
| Intent-Insert-Exclusive (Key-Range Lock)
|
LCK_M_IU
| 0x0C
| Intent-Update lock
|
LCK_M_IS_U
| 0x0D
| Intent-Share Update (Key-Range Lock)
|
LCK_M_X
| 0x0E
| Exclusive
|
LCK_M_BU
| 0x0F
| Bulk Update
|
Also, there are quite a few not discussed in books online. I will give what information I've gained on them..
WAIT TYPES - WHAT CAN I DO ABOUT THEM
NetworkIO. This wait type indicates that you are waiting for network resources to become available. Check the available bandwidth of the server, and other processes possibly using the network connection that SQL uses. You can use the Performance counter for SQL Statistics: Batch requests per second as a test for your Network Card. Values over 3000 for a 100MB card are getting excessive. The test for exceeding bandwidth is Network Interface: Bytes Total per Second Divided by Network Interface: Current Bandwidth. The value here should be < .6.
Common causes of this are very large result sets being transmitted back to the client, FTP sites run on the SQL Server box, external monitoring tools using bandwidth, bulk inserts, Backups written over slow connections to network destinations, insufficient bandwidth for transaction volume, etc...
IO_COMPLETION, PAGEIOLATCH_XX, and PAGELATCH_XX. These Wait states are all related in meaning that you are waiting for disk resources to be free for use. Some very common causes of these are Virtual Memory paging, index page splits, growth of database files, growth of temdb files, bulk inserts, or any other activity that causes high disk activity. All of these wait types can be tracked down and verified easily enough with performance monitor.
Here are some time honored suggestions:
· {C}PhysicalDisk: % Disk Time shows the percentage of time that the disk is busy with read/write activity. If this counter indicates high activity (high 80's or better), Check the Current Disk Queue Length. The number of I/O requests should be less than 2 times the number of spindles involved in the disk array.
· {C}On verifying the high disk activity, check the Memory:Page faults per second counter to get an idea of whether the high disk IO is caused by paging.
· {C}Also, check to see just how much of the activity is caused by SQL as this is also information available to you. The SQLServer: Buffer Manager Page Reads/Writes per sec give you how many pages are read and written by Sql server engine.
And Since Sql2000, we also have another wonderful tool for showing disk access in a new way. The function fn_virtualfilestats gives us very valuable information in managing disk IO. When its called, it gives you the number of reads, writes, bytes read, bytes written, stall milliseconds, timestamp, and of course the databaseid and file id that you passed into it. It’s all the statistical information anyone could want in creating filegroups, and further splitting disk Io out across available resources. You can immediately tell what files are being used to what extent and where your waits are happening. If you do not use filegroups, it’s still helpful in giving you the information to compare to the information from the performance monitor counters.
This clipping of the query analyzer shows its usage and the results.
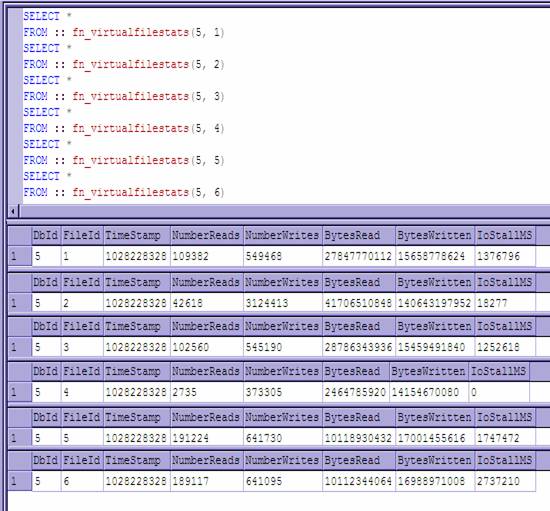
I execute several statements together to do comparisons as well as get the information for my files. The variables passed in are Database id and File id. If you need to identify your files, the sysfiles table in your database,
The files represented here are :
Default_Filegroup - Main Data File
Primary Log File
Default_Filegroup - Second Data File
Second Log File
Import_FileGroup - Main Data File
Import_FileGroup - Second Data File
It quickly becomes apparent that I have a lot of waits in the Import Files filegroup I created to hold initial data prior to scrubbing it. And noticing the IOStallMS for the log files, they are > 20 ms which indicates they need looking at as well. It’s evident that this system is under a pretty good load and should be worked with. (I worked really hard to put it under this load to demonstrate...)
By monitoring these over a period of tuning your IO, moving tables to filegroups, or distributing filegroups across disk subsystems, you can make it an exact science of what’s best for your system and where your system could use improvement.
CXPacket, Exchange, and PageSupp are all related to parallelism. Sometimes, the cost of putting a parallel query back together is more than the cost of running the query had the SQL engine not invoked parallelism. In those cases, these wait types become numerous and long lasting. Queries which are heavily balanced to one sub query or another are a common cause of these. If, for example, your query retrieved records from four tables and one of them held the vast majority of records, and parallelism caused this to be spread across several threads, three of them would have to wait on the largest and you would see Exchange wait types. There are many suggestions for taking care of these types of waits, with the most common to be to turn parallelism off, sometimes for just that query, sometimes for the whole server. I argue for leaving it on, and adjusting the parallelism threshold level to a better performing value. You can adjust this level so that SQL server will not consider lower costing queries for parallelism, and by profiling the queries and procs your can find the sweet spot for your server. This is the value that still allows large queries to take advantage of parallelism yet prevents lower cost ones from being broken up to cost more. It can be a tedious process, and can take some time, but its well worth it. Also, in the case of upgrading to a multiprocessor server, or adding processors, recompiling all of the stored procedures, triggers, and other code is recommended.
WriteLog and LogMgr. Though these are both the Log Writer for transactions, it’s important to keep in mind that with a WriteLog wait type, you are waiting the Write to disk of Transactions, and with the LogMgr, you are waiting for the Log Writer to start writing your transaction. They are at opposite ends of the Log Write process. Consider moving your log to a higher throughput device. If it already is, verify through the same processes as IO_COMPLETION above to examine the log file information to get an idea of what is slowing this service up. When I've seen it most has been logged bulk inserts and in those cases, short of breaking up the inserts, it couldn't be reduced. Working with multiple files on multiple raid arrays for your logs has a possibility of eliminating these dramatically but I haven't worked with it enough to recommend it to anyone.
CMEMTHREAD - These wait types are indicative of a shortage of memory objects. When the server is waiting on memory to be free for use, these wait states become common. The possibilities for causing this are limitless, but easy to pinpoint. The quickest way of identifying what process is using the system memory resources, open task manager, and there is the current memory usage of all your processes. It’s simple to sort by memory usage by clicking on the header for that column. For more information, go to the view menu item, under it find select columns, and you can add many columns giving information on max memory used, user objects, page faults, etc. Performance counters are also useful, but since task manager is so handy, It’s what I use. For examining memory usage within SQL, the performance counters break out the memory allocated to different buffers, cache, the optimizer, etc, and can also be viewed directly within the system table sysperfinfo. Then there is the DBCC MEMORYSTATUS command which gives you information on committed memory, you procedure cache, buffer pool, etc. Basically the distribution of 8k buffers within SQL Engine. With this information, you should be able to determine a course of action to improve the memory situation.
CURSOR and PSS_CHILD. Both of these waits are related to asynchronous cursors. The CURSOR wait is SQL awaiting synchronization with asynchronous cursors, and PSS_CHILD is SQL awaiting a child thread within an asynchronous cursor. You can track down the particular cursor causing these waits with profiler, and once determining that, take steps to reduce the waits caused, possibly by re-working the process, possibly by changing the nature of the cursor, and possibly by removing the cursor to use set based operations to accomplish the same thing. It will depend on what the cursor is being used for, and what the process requires. There is a lot of misuse of cursors in the world, and when I see a lot of CURSOR or PSS_CHILD waits, that’s something to look for.
WAITFOR. This wait type is user or code induced. It is caused by the WAITFOR command. Generally, if found, there is a reason for it. May not be a good one, but a reason none-the-less. Evaluate carefully, these were put there on purpose.
XACTLOCKINFO. This wait is caused by the releasing, escalating, or transferring of locks during Bulk operations. SQL Server engine handles lock operations very well, and generally, there is little that can be done about this one, other than breaking up the bulk operations into smaller transactions to reduce the locks used, which would reduce the waits involved due to fewer locks in the first place.
TEMPOBJ. This wait is observed when dropping temporary objects such as temp tables, or work tables. These objects have to be cleaned up after use, so expect the waits with high temp object usage. I use what I consider to be a extremely high amount of temp objects and have never seen these be a problem, or been able to reduce them, short of just not using the temp objects to start with.
OLEDB. The server is waiting an OLE DB provider to service its request. High transaction levels or slow connection speeds in a distributed environment are a big cause of these. Sometimes they can be caused by slow authentication. Outdated MDAC or incorrect DB providers being can also cause these. Interfacing third party software for conversions is a big culprit here, on occasion. The resolution or reduction of these types of wait types is most often done on a case by case basis.
I welcome any feedback, additions, corrections, etc, and hope this has been helpful.