

Introduction
You often need to check the performance of a PostgreSQL query you just wrote to look for some way to improve performance. In order to do this, you need a report of the query execution, which is called the execution plan). The query execution plan gives you the entire summary of the query execution with the detailed report of time taken at each step and cost incurred to finish it.
The EXPLAIN keyword in PostgreSQL helps you to generate the execution plan of a query in PostgreSQL. The syntax for creating the plan in PostgreSQL is:
EXPLAIN [ ( OPTION [, ...] ) ] YOUR_SQL_QUERY;
There are many choices for the OPTION to add to this command. For multiple choices, we comma separate each one. The set of choices is:
ANALYZE [ boolean ]
VERBOSE [ boolean ]
COSTS [ boolean ]
BUFFERS [ boolean ]
TIMING [ boolean ]
SUMMARY [ boolean ]
FORMAT { TEXT | XML | JSON | YAML }
The Boolean values can be either TRUE or FALSE. Instead of TRUE, you can use ON or 1. Similarly instead of FALSE you can use OFF or 0.
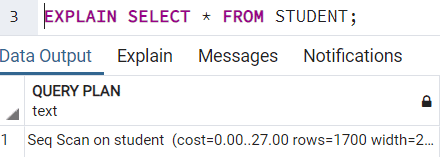
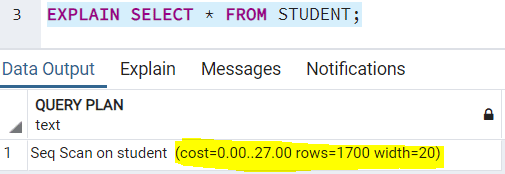
A very simple query execution plan looks like this:
Understanding the Syntax
Before using the EXPLAIN keyword to generate an execution plan of your query, you need to know about the syntax in detail.
ANALYZE
When you use the EXPLAIN keyword, your PostgreSQL query is executed first. Once the query has been successfully executed, all the the run time statistics, including the total time elapsed against every plan node and the total number of rows the query fetched, is returned. The ANALYZE keyword will actually execute the query in real time to collect and prepare the execution plan. So, if you run the following query:
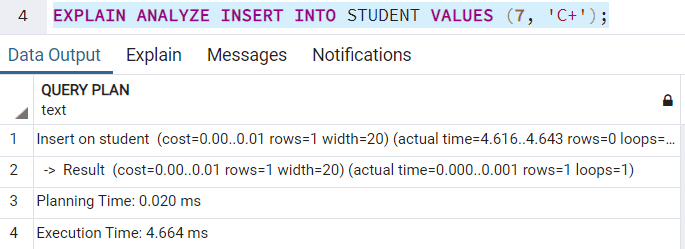
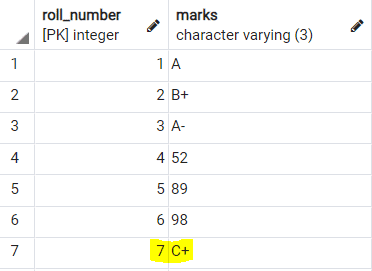
This actually inserts the record in the table as follows:
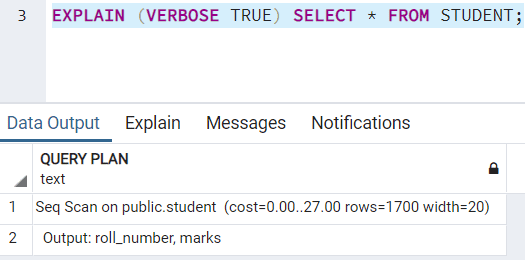
VERBOSE
This keyword will show additional information regarding the query execution plan. This option is by default, FALSE. To set it to TRUE, you can write:
COSTS
The COSTS option will return a cost value to each step in the query. The estimates made are arbitrary values that are assigned to each step in any query execution based on the expected resource load it may create. The default value for this is always set to TRUE. You can use this keyword in your query execution plan as follows:
BUFFERS
The BUFFERS keyword is one of the most interesting one to check in the query execution plan. It basically comprises of 2 parts - the shared read and the shared hit. Shared read is the number of blocks the PostgreSQL reads from the disk. Shared hit is the number of blocks the PostgreSQL reads from it's cache. The PostgreSQL maintains it's own cache. It's kind of a memory for the earlier queries it ran. So every time you run a query, the PostgreSQL first looks in it's cache and if needed, it reads from the disk.
This keyword has a dependency on the ANALYZE keyword and can only be used when the ANALYZE keyword is used. This keyword comes with the default value as FALSE. You can use it in your query execution plan as:
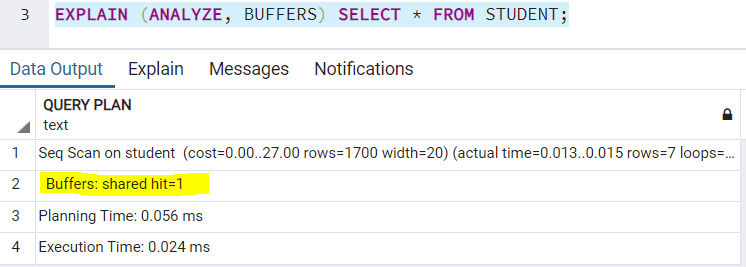
Note: Since we ran this query many times earlier too (while talking about other keywords), the buffers shows only shared hit since the result was available in it's cache. If we run a query with a new WHERE clause, it will show shared read too.
TIMING
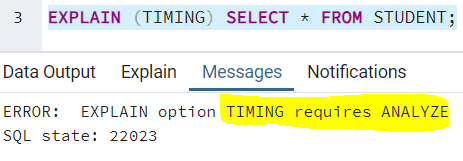
The TIMING keyword details out the startup time and the execution time taken at each node. TRUE is the default value for it. ANALYZE keyword should be used to use this keyword. If you try to use TIMING keyword without ANALYZE, you get the following error:
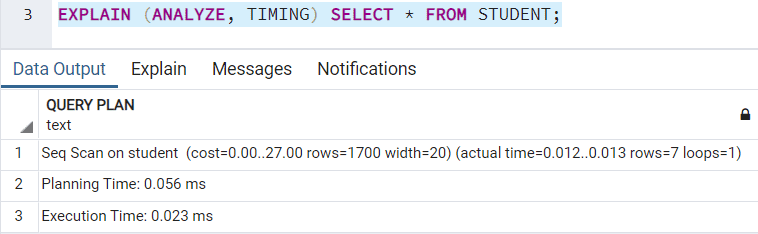
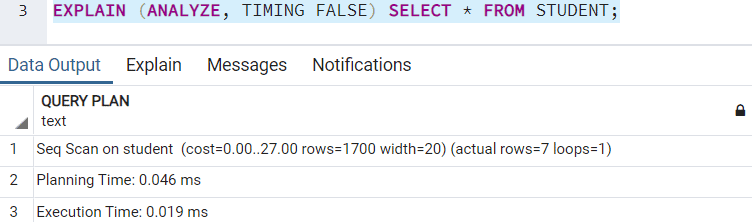
The execution plan with TIMING enabled will list out as follows:
The execution plan when TIMING is turned off will list out as follows:
SUMMARY
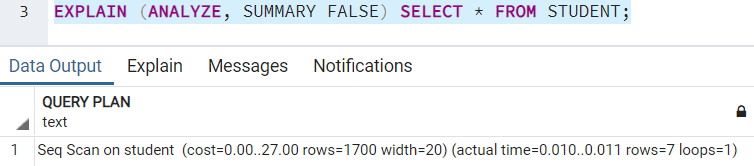
This keyword adds the summary information to the execution query plan. You should use it with the ANALYZE keyword. By default, the query plan includes it. If you wish to turn it off, the result would look like:
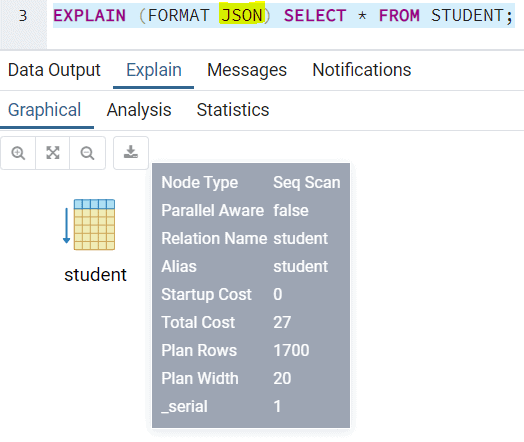
FORMAT
This keyword is of much interest if you need to prepare a report to showcase the query performance or you need to capture the details of the query execution plan for future reference. You need to specify the format in which you want the result. TEXT is the default value. The other choices are: XML, JSON and YAML. You can use the keyword to generate XML output as follows:
Examples
We already covered many examples above. We used a very generic and simple query. Let's use a bit real time queries like the ones with WHERE clause or JOIN in it.
Suppose we need to see the execution plan for the query which retrieves student details with roll number = 5. The plan looks like:
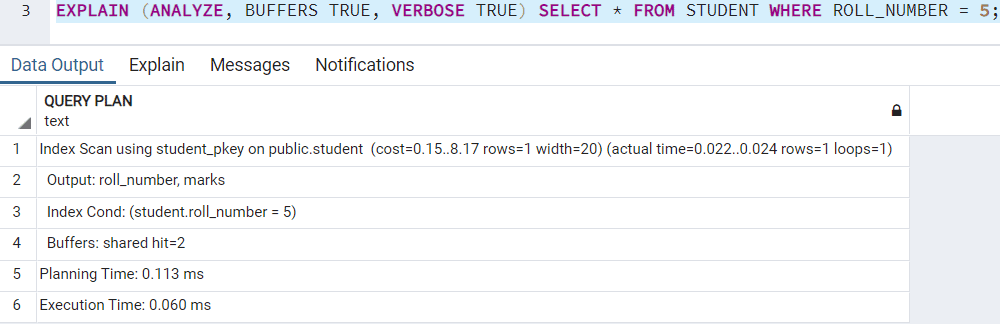
This is just an illustrative example. Check if you need for VERBOSE and BUFFERS in your execution plan. If you need to check the output columns returned, you can use VERBOSE. If you need to check the number of blocks retrieved from disk and cache distinctively, you can use BUFFERS.
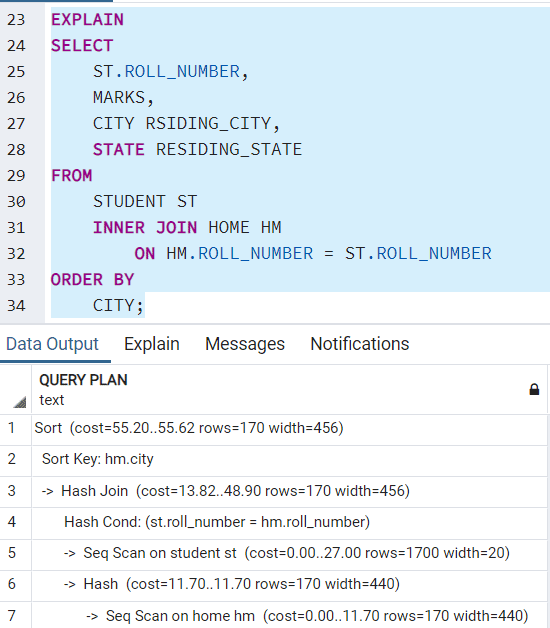
Now suppose you need to join 2 tables (for example student[containing roll number and marks] and home [containing roll number, residence city and state]) and fetch the details to list to the user. For this, the execution plan is:
Conclusion
You can do a lot with EXPLAIN keyword in PostgreSQL to determine the cost and efficiency of your queries. It helps you to identify areas where you need to fine tune your queries. As a result it also helps you to identify queries which will consume considerable amount of time in the production server. This will help you to identify such queries beforehand and save yourself from server hung up problems at an early stage.