

Introduction
In response to my approach in the popular MDX Guide for SQL Folks series, I am going to try and repeat the same style of learning for the Data Analysis Expression(DAX) language. I am going to use SQL as a good frame of reference for starting or developing a new approach for improving your DAX learning experience. This is useful for developers starting to learn the DAX language to more advanced developers who have struggled to adjust to the language coming from a SQL background.
I am going to introduce DAX by first, drawing very strongly on the similarity and differences between DAX and SQL at the fundamental level. I am going to assume that readers learned SQL before DAX and that this fact could influence their DAX learning process. Ultimately, I will focus on how to use DAX with Power BI and more importantly tackle some core DAX and Power BI interactive reporting concepts along the way. The ultimate goal of the series is to help readers employ DAX in Power BI for effective analytical storytelling in their data visualization endeavors.
There are a great number of DAX resources available, but I especially draw heavily from those by Marco Russo and Alberto Ferrari. I recommend their books and websites for deep dives into some introductory topics I address here and those that I don't.
Part I - Intro to DAX, Power BI, and Data Viz
Dax is a broad topic, in Part I, I am going to address some key underlying concepts that will explain some unique DAX behaviors as we progress along in the series. The sections will look at:
- the importance of interactive Data Visualization today and the role DAX plays in Power BI to help a user tell analytical stories effectively.
- the differences and similarities between the Relational Database and the Tabular Model, the databases that power T-SQL and DAX respectively.
- understanding how interactive reports work and how user interactions and visuals on Power BI reports introduce implicit filters that affect the DAX calculations and expressions that you write.
- understanding DAX as a functional Language compared to SQL as a declarative language. We compare the two languages using some basic queries.
Like most things, mastering DAX does not happen overnight. Coming from a SQL background, understanding these basic but essential topics should serve as a guide with SQL frame of reference when trying to understand some unique DAX behaviors or specific DAX function calls.
Power BI
Power BI is Microsoft's flagship Model-based business analytics service tool that provides interactive visualizations and business intelligence capabilities for firms and businesses of all sizes. With Power BI you can connect to hundreds of data sources and bring your data to life with live dashboards and reports. It has an interface that enables users to create their reports and dashboards easily or drill down through visuals to explore the data.
Power BI also integrates many other tools like R and Python that extend its visualization Capabilities. Ultimately whether generating ad-hoc reports, pursuing visualization in a Data Science project, or setting up an enterprise-level analytics solution, there are many visual and data modeling options available in the tool to help you achieve this.
DAX, Power BI, and Tabular Models
DAX is the primary language used to query Tabular Models in Power BI. In Power BI you can build a Tabular Model directly on top of your primary data sources or connect to a Tabular Model built as an Analysis Services Tabular Model Database (SSAS Tabular Model Database).
In this series, we will use the second option. We will use portions of the Tabular Model from the AdventureWorksDW SSAS Tabular Model sample Database for all DAX queries and all Power BI formulas and expressions. You can follow this part of the series without a copy of the AdventureWorksDW Tabular Model sample database. But to run or test DAX queries and Power BI formulas and expressions in the subsequent parts in the series you need to install a copy of this database.
For those new to DAX and Tabular Models, the easiest way to follow the example in the series is to download and install the AdventureWorksDW Tabular Model sample database. To do that you can follow the example in this article DAX #2 – Installing AdventureWorks DW Tabular Model SQL Server 2012 to install a compatible version.
For those new to DAX and Tabular Models who want to learn how to create and deploy a SASS Tabular Model Database, this tutorial Adventure Works Internet Sales tutorial provides step-by-step lessons on how to do that.
Data Visualization
Data visualization is the presentation of data in a pictorial or graphical format. It involves techniques that enable developers to communicate effectively to decision-makers using visuals. Data visualization techniques can help one's audience grasp difficult concepts and identify new patterns when applied effectively. This enables the audience to act on the information.
Reporting has evolved, and with more recent studies showing decreasing average human attention span, data visualization today is not about showing dashboards and reports for your audience to interpret. Rather it involves showing them what is happening through new insights, identifying new patterns, and telling them what to do in response to the data. Reporting today is about making your point most convincing by selecting the appropriate visuals in a design that meets users' information needs and good experience. Your audience may admire your stunning reports, dashboards, and websites, but this does not mean they will come back if they did not find the information they need or if it was simply difficult to piece together what you are trying to communicate.
What most novices fail to realize is that there are an art and science to analytical storytelling and thus learning these techniques helps you turn data into information that can be used to drive better decision making. There are many books available for teaching these techniques. Apart from helping you choose the right visual for specific scenarios, they also teach you how to;
- Craft the Big Idea, knowing your audience and setting the context
- Think like a designer. Techniques usually reserved UX/UI experts
- Reduce clutter (because less could be more) through the use of color sparingly and how to utilize space effectively and many more.
I suggest you grab one of these books to learn and practically apply the techniques they teach in your data Visualization efforts.
Interactive Data Visualization
Interactive visualization takes the concept of data visualization a step further. By using data modeling and other technologies, interactive visualization enables end-user to drill down into visuals for more detail, interactively changing what data they see and how it is processed. It allows users the freedom to fully explore and analyzed data.
The self-service capability of interactive visualization means that users can manipulate the data to find out specific things they need to know. Through this exploratory process, they can also be alerted to situations that require immediate attention. Also, because the data is often modeled on the business it improves collaboration; such that when everyone on a team is drilling through the same data, the team can identify and solve problems more easily.
Why is DAX important?
Power BI was designed to have self-service and easy-to-use drag and drop interface to enable various end-users to create reports and dashboards. As a result, It is possible to create some reports that show some valuable insights without using any DAX formulas at all. But when you want to create reports that showcase more advanced financial metrics, growth and trend calculations over time, then one needs DAX. Learning how to create effective DAX formulas and expressions will help you get the most out of your data.
In effect by combining some of the data visualization storytelling techniques mentioned above with some DAX expertise, pros can tell a story on one page that novices can't communicate in several pages. Some of the topics we discuss later. "Evaluation Context" could eventually help you write terse advanced DAX Formulas to improve your expertise. Note that like everything mastering DAX does not happen overnight.
How is DAX similar or different from SQL?
To be able but to answer this question one must first understand how a Relational Database is different from a Tabular Model. If you learned SQL before DAX, you should pay attention to the sections following because I believe this is what causes difficulty in transitioning from SQL to DAX.
The Relational Database Vs the Tabular Model
If you are reading this, you probably know that SQL is used to query tables in Relational Databases. Tables are the basic objects in Relational Databases. DAX is also used to query tables in Tabular Models. Figure 1 below shows the parallels between the objects in a Relational Database and Tabular Model from the perspective of the two languages.
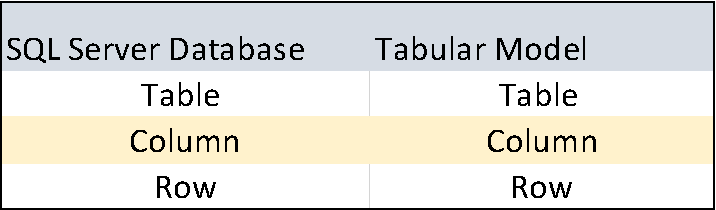
Figure 1: Showing the basic parallels between a relational database and a Tabular model from the perspective of SQL and DAX Languages.
At this stage, your mind is thinking these are the same, in fact, if you open both the SQL Server AdventureWorksDW relational database and the SSAS AdventureWorksDW Tabular Model database in SSMS this is what you see. Similar setups, with a one-to-one mapping of tables in the AdventureWorksDW Relational Database to tables AdventureWorksDW Tabular Model Database
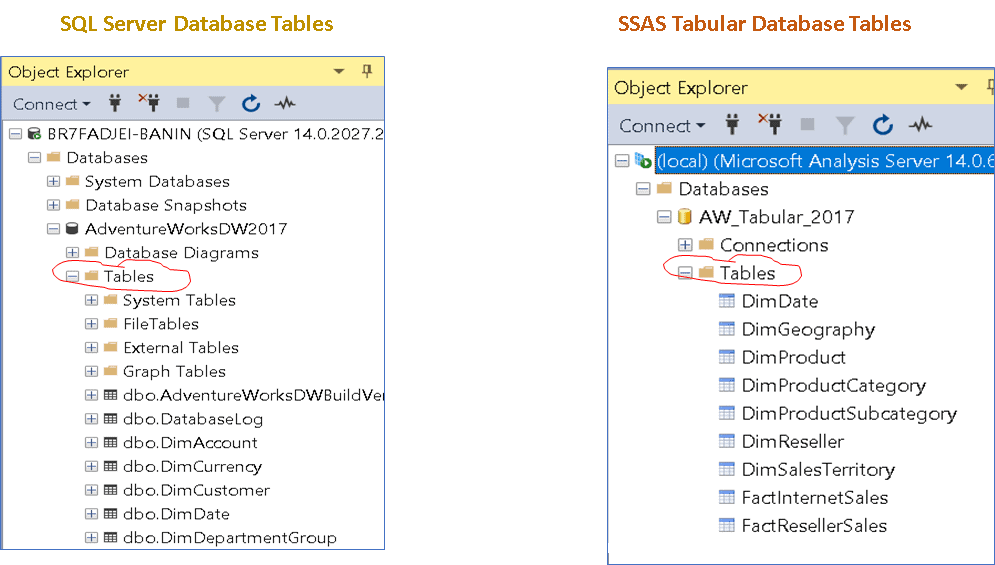
Figure 2: Showing one-to-one mapping of tables in the AdventureWorksDW Relational Database to tables AdventureWorksDW tabular Model Database.
In this series, we are going to restrict our DAX queries to a few of the tables in the AdventureWorksDW Tabular Model with a one-to-one mapping of tables from the AdventureWorksDW SQL Server Database as shown in figure 3 below.
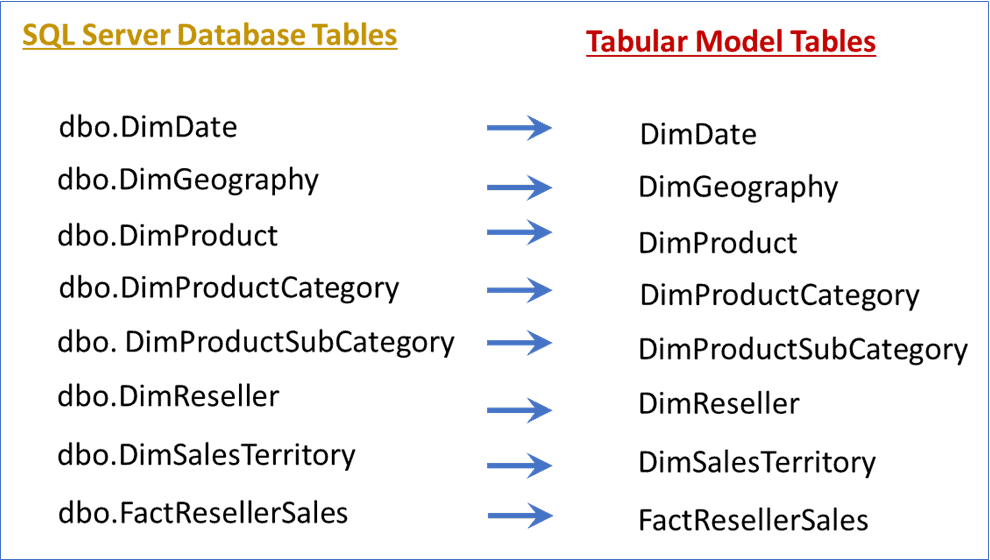
Figure 3: Showing a one-to-one mapping of how some seven tables in SQL Server AdventureWorks Database maps to Tabular Model tables
Figure 3 shows how seven tables in the AdventureWorksDW Relational Database are represented as tables in an SSAS AdventureWorksDW Tabular Model, with the exact names. Table and columns names remain the same by default when you build a Tabular model directly from a Relational Database.
Now let’s take a look at how tables are actually represented in a SQL Server Database vs how they are represented in a Tabular Models in the next section.
Introduction to Relationships in DAX
One major difference between a Tabular Model and a SQL Server Database is that tables exist as separate entities in SQL Server Database but in Tabular Model, tables are joined together to form part of a physical model as shown in Figure 4 below.
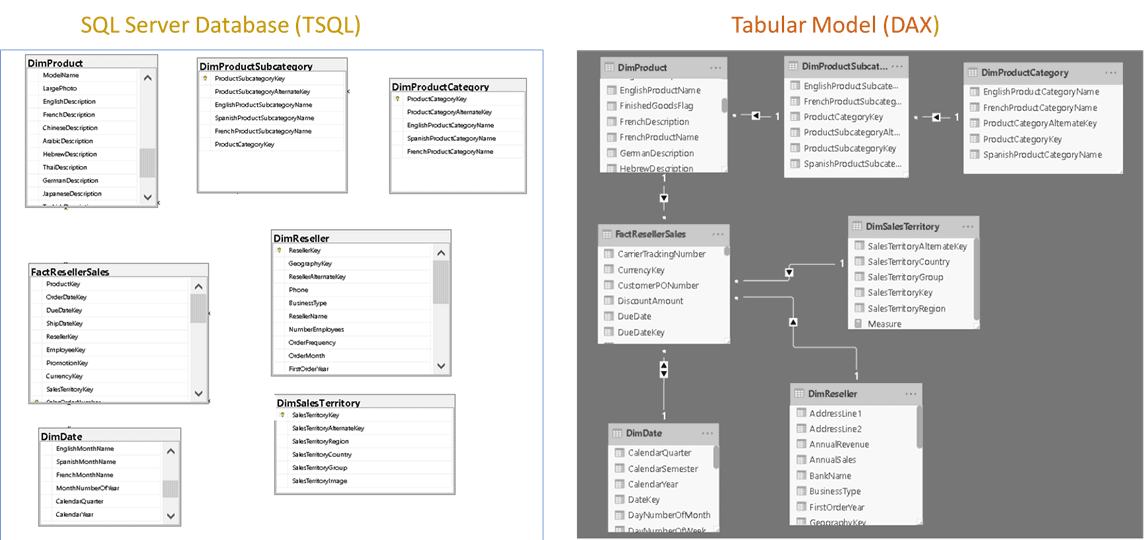
Figure 4: Shows how tables in the "AdventureWorksDW" relational database translate into tables in the Tabular Model
In SQL Server you may develop a logical model diagram to define relationships between tables using primary and foreign keys as shown in figure 5 below, but note that this does not mean the tables are joined together when you create the physical SQL Server Database.
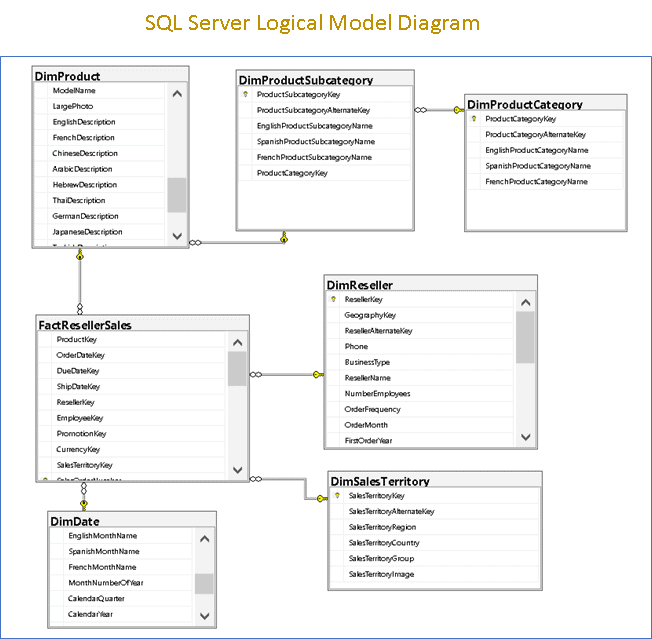
Figure 5: Showing a SQL Server Database Logical data model diagram, not a physical data model.
On the other hand in a Tabular Model, you have to physically implement relationships during the model development phase. Therefore when the Tabular Model is processed, the engine joins all the tables together with a left join to form one physical Data model.
This means that in SQL Server if you want data from two tables, you have to explicitly declare how you want the tables to be joined (using join statements like inner join in your select statements). On the other hand, in DAX when querying two tables you don't have to explicitly join them in your query statement because all relationships are established during the model processing phase. You can see how this becomes significant between T-SQL and DAX later when we start writing some queries. With this key knowledge in hand let proceed to look at how this concept plays out in the DAX language as compared to T-SQL.
Introduction to Expanded Tables in DAX
In the previous section, we learned that in Tabular Models all tables are joined together with a left join from the many-to-one side of the relationships. For instance, from the model shown in figure 6 below, DimProduct is left joined to DimProductSubCategory, and DimProductSubCategory is also left joined to DimProductCategory.
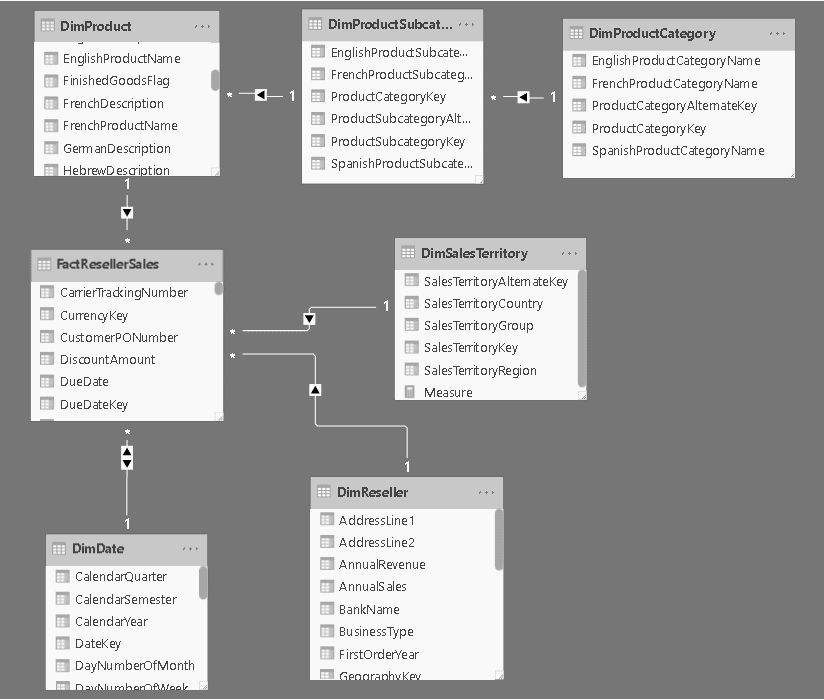
Figure 6: Showing a physical model and actual joins represented in a physical Database.
The concept of Expanded Tables is the idea that, in DAX, every table in a model has a matching expanded version. The expanded version of a table contains all the columns of that table, plus all the columns of the tables that are on the one-side of a chain of many-to-one relationships starting from the source table. Using the three Product tables in the model in figure 6 for illustrations, the concept means that;
- The expanded version of DimProductCategory only contains columns in that table. The reason being that even though it joined to another table, it is on the one-to-many side of the relationship.
- The only table with a relationship to DimProductCategory is DimProductSubCategory. DimProductSubcategory is on the one-to-many side of the relationship, therefore, the expanded version of DimProductSubcategory includes the columns in itself (Native columns) plus all the columns (Related columns) in the DimProductCategory table.
- Similarly, the expanded version of DimProduct includes the columns in itself (Native columns) plus all the columns (Related columns) in the DimProductCategory and DimProductCategory tables.
Note that table expansion goes from the many-to-one side of a relationship but not the other way around, also table expansion does not stop at the first or second level, it continues as long a many-to-one side relationship can be further established.
For example, from the model, DimFactResellerSales can reach DimProductCategory following only many-to-one relationships. Thus, the expanded version of DimFactResellerSales contains all the columns in DimProduct, DimProductSubcategory, and DimProductCategory tables. Moreover, DimFactResellerSales is on the many-to-one side of the relationship with DimDate, DimReseller, and DimSalesteritoy, therefore, the expanded version of DimFactResellerSales contains DimDate, DimReseller, and DimSalesteritoy too. In other words, the expanded version of DimFactResellerSales contains the entire data model.
For those conversant with multi-dimensional modeling, when modeled properly, essentially the extended versions of the fact tables will contain most of the columns in the entire tabular model.
Expanded tables, filters, and Power BI Reports
The concept of Expanded Tables as explained above means that in DAX, a column can belong to multiple tables at the same time. The concept is useful because it provides a clear explanation of how filtering on a column in one expanded table propagates through the model and thus can affect the results of DAX formula or DAX expression written to target a different Expanded Table containing the same column. Once a filter is being applied to a column, all the Expanded Tables containing that column are filtered.
There are a few points to note about the concept:
- The concept of Expanded Tables, the expansion process utilizes relationships defined in the Model. Therefore, once a table has been expanded, the relationships have been included in the expanded version of the Tables. This should help explain why for instance you would not explicitly declare joins in DAX like in SQL.
- When DAX formulas, expressions, visuals, and user-actions on a Power BI report references a column in a table, they are referencing the expanded version of that table.
- When you apply filters on column either through formulas, expressions, user-action, or visuals, they do not work in isolation. When used in a Power report they are applied to the model at the same time. When DAX is evaluating your formula or expression, it must do it in the context of other filters applied to the model at that current time as a result of user-action, visuals, and even other DAX formulas.
- In short, visuals, user-action and even other formulas on a report can introduce external filters to your DAX formulas leading to unexpected results if these concepts are not well understood.
The concept and its implications might seem a bit complicated at this stage of the series, chew on it a bit, we will return to them later in the various parts of the series.
The DAX Language vs the T-SQL Language
We have seen the similarity and differences between the Relational Database and a Tabular Model. Now let's look at the major similarity and differences between the DAX languages compared to the T-SQL language. We will do this by initially illustrating syntax differences between DAX and T-SQL using very simple and basic queries.
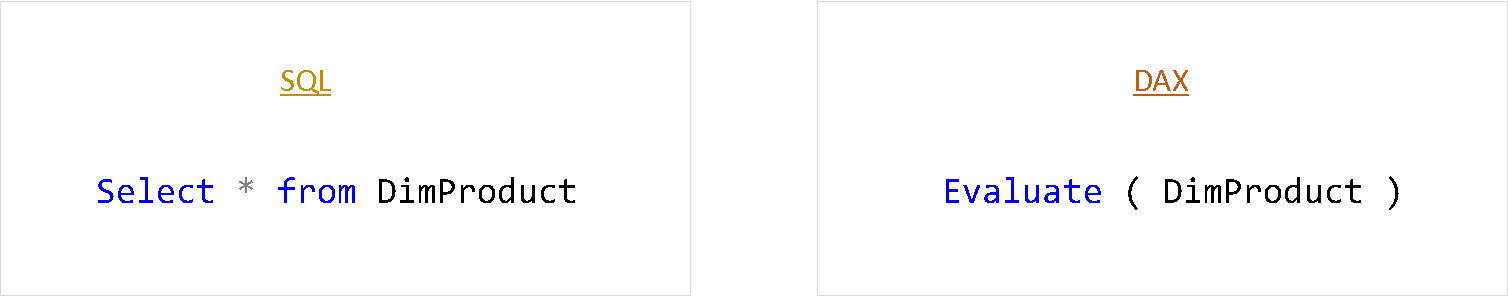
For instance, Listing 1 below shows how to select data from the DimProduct Table in both databases with SQL and DAX.
Listing 1:
Results;
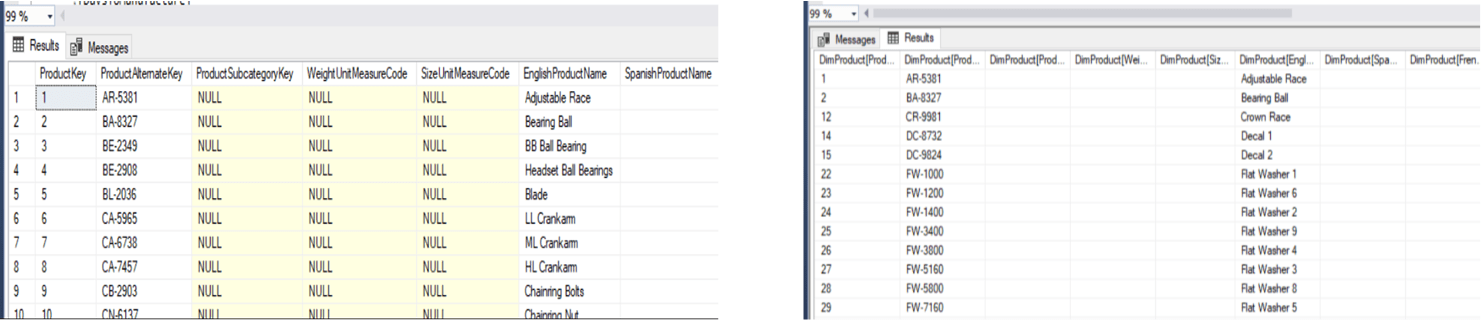
As we can see from the figures above, both SQL and DAX return similar results.
From SQL background if you hear querying, your first inclination is something resembling
SELECT Blah Blah…
so what is going on with DAX here? Well, unfortunately, SQL is a declarative language while DAX is a purely functional language. With SQL, you define what you need by declaring the set of data you want to retrieve using SELECT and JOIN statements, without worrying about how the engine retrieves the information. DAX, on the other hand, is a functional language, i.e., in DAX, every expression is a function call. Function parameters can, in turn, be other function calls as below.
Function2(Function1())
With this knowledge let's get a feel of DAX queries and this functional stuff.
Introduction to a DAX Query
In Listing 1 above we encountered the EVALUATE function. First of all in DAX, if you need to query the data in a tabular model, you need the EVALUATE function. The EVALUATE function is used to return the result set as a table. It is the equivalent to using SELECT FROM statement in T-SQL to return columns and rows from a table. The EVALUATE function has a required syntax of
EVALUATE('table name').In Listing 1 it was not used with any column projection function so the effect is similar to
SELECT * FROM
We will explore the complete syntax of EVALUATE and differences between DAX and SQL queries in our next series "Querying with DAX", but for now let's explore the functional nature of DAX further.
DAX as a Functional language
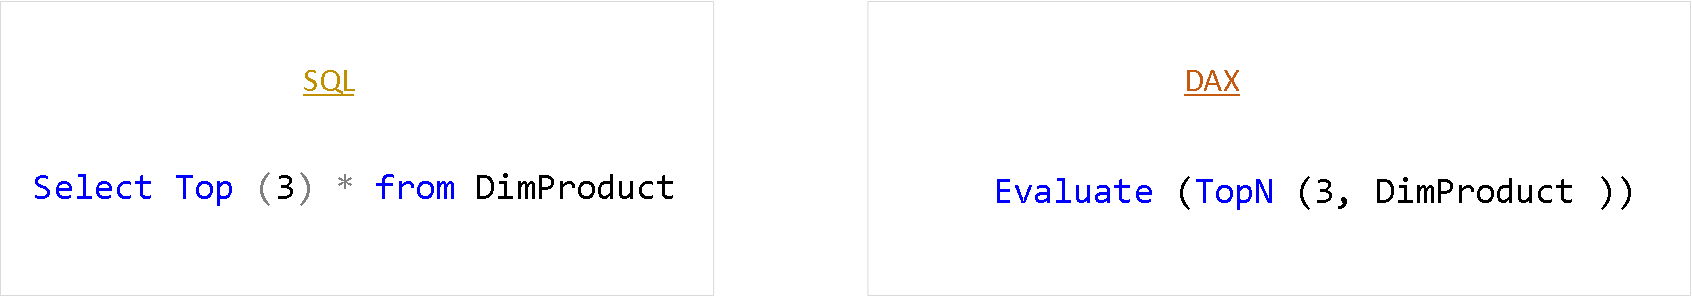
Functional language essentially means the language is written as functions nested together. In Listing 1 there was only one function, EVALUATE, in the DAX query. For instance, let's say now we want to select Top 3 records from the DimProduct table. Listing 2 below shows the queries to achieve these results.
Listing 2:
Results;
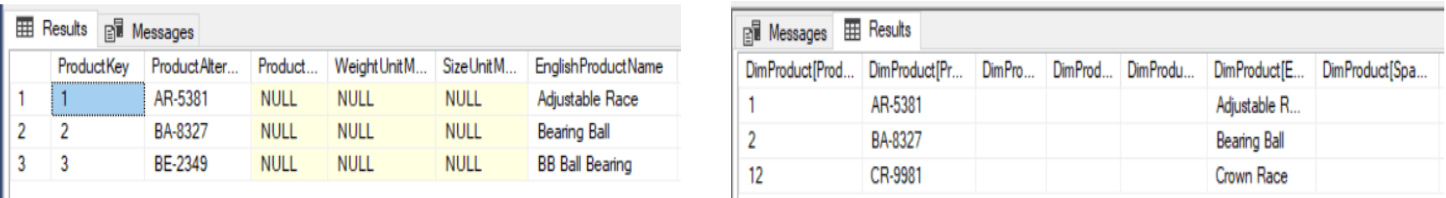
As we can see from the results above, they both return 3 records. Also, we can see that the DAX expression chained two functions (EVALUATE, TOPN ) together as shown below. Here TOPN nested within EVALUATE.
EVALUATE(TOPN())
- Logically, it is easy to understand that the inner function is processed first and passed on to the next in the chain.
- Required Parameters for most DAX functions are Columns, Tables, and expressions
Note that in SQL we also use some functions, but statements are not all functions.
Now, let's expand the previous query by filtering the DimProduct table to black products only. Listing 3 below shows the queries to achieve this result.
Listing 3:
SQL:
SELECT TOP(3) *
FROM DimProduct
WHERE DimProduct.Color = 'Black'
DAX:
EVALUATE(TOPN(3,(FILTER(DimProduct, DimProduct[Color] = "Black" ))))
Yet again we see that DAX just chained three functions together as below.
EVALUATE(TOPN((FILTER())))
In SQL you can combine functions, clauses, and statements when programming. The good thing with DAX is that its functional form does not change; the code is all functions. Therefore when you learn it as a query language—its original use—you will know everything needed to also use it as a programming language.
For those new to functional languages, syntax formatting may make the DAX appear unlike functional in the beginning to you. For instance, the query in Listing 4 below is the same as the DAX query in Listing 3 above only formatted differently.
Listing 4:
DAX:
EVALUATE
 (
    TOPN (
        3,
        (
            FILTER (
                DimProduct,
                DimProduct[Color] = "Black"
            )
        )
    )
)
One thing to bear in mind is that the evaluation of parameters in nested functions in DAX could result in complex query plans that the DAX engine executes to compute the results. Therefore, selecting the right functions to use and the order in which the functions are nested have a strong impact on both the result and the performance of the engine. Although the way one writes SQL also affects the query engine, the SQL query optimizer does a better job in finding the optimal query plan. In other words, in DAX the programmer bears more responsibility in writing good code. We will learn the different ways various DAX constructs can return the same results later in the series.
Summary
First, we learned of the importance of the use of data visualization techniques. We learned that applying these techniques can increase one's potential to effectively communicate decision making insights to drive action. There are many books available that teach this art and science of analytical storytelling.
We also learned the benefits of interactive visualization that comes with tools like Power BI. Interactive visualization tools take the concept of data visualization a step further by using data modeling and technology to enable end-user to drill down visuals to fully explore and analyze data.
We examined the key similarities and differences between and a SQL Server Database and a Tabular Model that powers T-SQL and DAX, respectively. We further learned that:
- In both databases the basic elements are tables. In SQL Server Database tables are isolated units whilst in the Tabular Model tables are all joined into one physical data model.
- Because tables are left joined to other tablets on the many-to-one side, tables in Tabular Model are essentially extended tables.
- Understanding the extended tables concept and other principles will help one to grasp the effects of filter propagation, interactivity and their effects on DAX formulas and expression that we write.
Finally, we learned that even though both DAX and SQL languages can achieve the same query results, SQL is a declarative language whilst DAX is a purely functional language. Functional languages essentially chain functions together by nesting one function within another.
Some of the Tabular Model concepts discussed here that make interactive visualization possible are also the ones that introduce the complexities in how DAX formulas and expressions are evaluated by the DAX engine. For instance, in the concept of extended tables, the fact that columns can belong to multiple tables means that filters introduced by user-actions and visuals on a report become "external" filters that affect your DAX formulas and expressions. We will explore these effects later in the series, but this means that the concept of extended tables must be well understood.
The topics we explored in this part are to serve as a reference when transitioning from SQL to DAX. One should return to them as often as possible to reset their frame of reference.
Next in the Series
In the next installment of the series, we are going to look at Querying with DAX, which will explore DAX queries exclusively. We will do this by comparing DAX queries with their SQL examples. For instance, we will look at how all SQL clauses in the query execution context below translated functionally into DAX and more.
SELECT <select_list>

FROM <left table> join<right_table>

WHERE <where_predicate>

GROUP BY <group_by_specification>

HAVING <having_predicate>

ORDER BY <order_by_list>;
We will also explore more on some of the concepts introduced here as we go along.
