

Summary
This article describes an analysis of SQLIO results using two data mining models in Analysis Services, and Excel to clarify and confirm model conclusions.
The SQLIO script suggested here http://sqlserverpedia.com/blog/sql-server-performance-tuning/sqlio-tutorial/ , all suggested options, was run against 2 drives on a newly commissioned server :
- E Drive - RAID 1, 2 Disks
- G Drive - RAID 5, 4 Disks
The SQLIO tutorial saves results for a single drive, this test was performed by combining both result sets into a single new table.
The performance of the drives is compared and visualised below. Both drives were from the same manufactures, same type, stripe size, only the RAID configuration is different. There was analogy in a recent sqlservercentral discussion where IOPS were equated with 'number of postmen out delivering mail', MB sec were equated with 'how much the postmen men was delivering' and latency with 'how long each postmen take returning from deliveries'.
OLTP Workloads should be typically be optimised for IOPS and Latency, OLAP workloads for for MB Sec. the analysis below is a hybrid of these using a calculated Performance Weighting' measure involving all three.
SQLIO
The SQLIO tool measures the performance characteristics of drives under various types of load but the results aren't easy to interpret as there are a number of 'influencing factors' such as :
- RAID levels of disks - 1 or 5
- Outstanding Threads - 1,2,4,8,16,32,64,128
- Active Threads - 2,4,8,16,32
- Read or Write
- IO Pattern - Random or Sequential
There are also the 'influenced factors' such as :
- IOs Second (number of postmen out delivering mail)
- MBs Second (how much the postmen are carrying)
- Latency (how long they take to return to base)
There are many different mining models in analysis service, each designed for specific scenarios. They can identify the weight of, and associations between influencing and influenced factors. The influenced factors need to be discretized (grouped into range based sets) before they can be used effectively and the T-SQL NTILE windowing function makes this easy.
SELECT
[DriveRaidLevel]
,[Threads]
,[ReadOrWrite]
,[IOpattern]
,[IOsOutstanding]
,NTILE(10) OVER (ORDER BY [IOs_Sec] ASC) +
NTILE(10) OVER (ORDER BY [MBs_Sec] ASC) +
NTILE(10) OVER (ORDER BY [LatencyMS_Avg] DESC) AS PerformanceWeighting
FROM [dbo].[SQLIO_Data]
The classic adventureworks data mining models for analysis services training have, at their heart a decision about whether someone will buy a bike, yes or no. Here, 'Performance Weighting', is the target for model predictions. It's slightly wider than Bike Buyer, Y or N, but still in a discrete range of values.
In the above query:
- The higher the IOs Sec = higher the 'Performance Weighting'
- The higher the MBs Sec = higher the 'Performance Weighting'
- The lower the latency = higher the 'Performance Weighting'
- Performance Weighting is the sum of the above 3 factors
Each of the first 3 factors falls in a 1 to 10 NTILE group. The sum of all three groups is the Performance Weighting which will be a number between 3 (worst) and 30 (best). The data mining models will show the strength of the influencing factors on this calculated, overall 'Performance Weighting'. This was the data set used in the data mining models with 'Performance Weighting' used as the prediction target.
Data Mining Results
There is a slight difference in the results of the 'Decision Tree' and 'Logistic Regression' models used. These are due to the range of possible values certain factors can contain (8 IO Outstanding, 2 Read or Write) and differences in the model algorithms. See references at end of this article for details on Recursive Partitioning and Logistic Regression model differences.
Microsoft Decision Trees Data Mining Algorithum
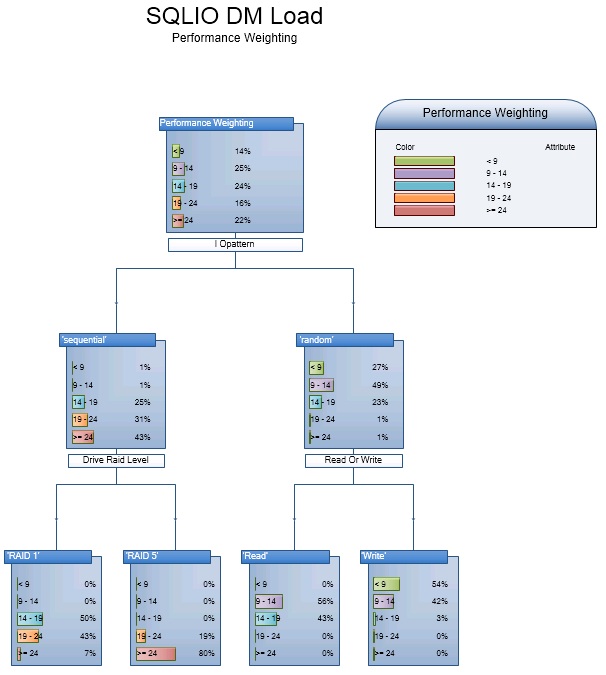
The diagram below shows what factors, and to what degree, the algorithm identified as more influential on the calculated performance weight.
Excel support for Decision Tree Results
To confirm the results in Excel, a GROUP BY query was run on the combined sqlio results table grouping the Performance Weighting by:
- IO Pattern
- Drive Raid Level
- Read or Write
These were the 3 factors the model identified as most influential. The Radar Chart below represents a graphical view generated in Excel. The performance weighting is greater when:
- IO Pattern = Sequential
- Drive RAID Level = 5
- Read or Write = Read
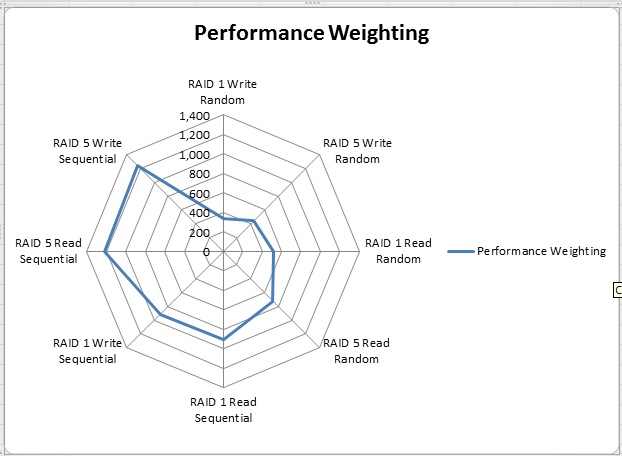
The Radar chart supports the conclusions of the data mining models.
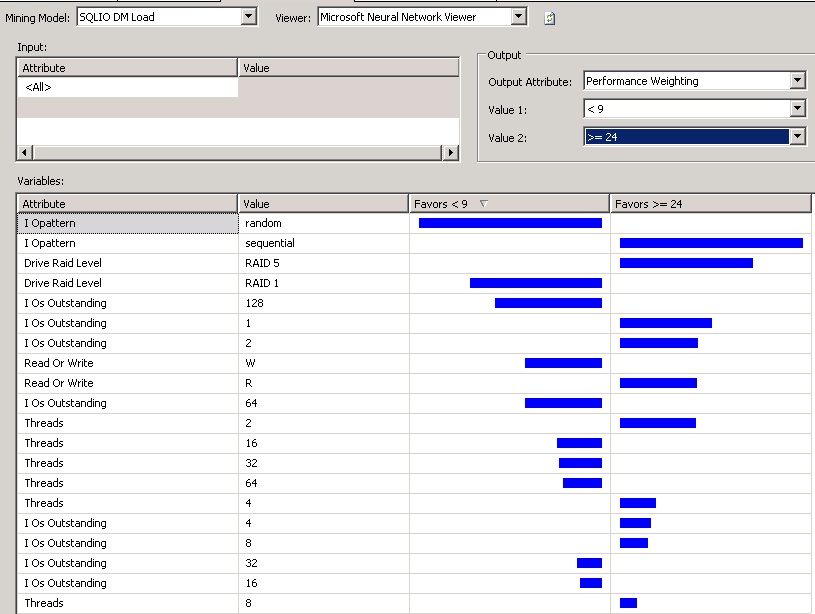
Logistic Regression Data Mining Algorithm
The screen shot below shows exactly the same SQLIO combined result set analysed using a different data mining model.
This algorithm has identified a different top 3 influencers on the calculated performance weighting. Certain extreme 'IO Outstanding' values are identified as more influential than the 'Read' / 'Write' workload distribution.
Excel Support Logistic Regression Results
To confirm the results in Excel, a GROUP BY query was run on the combined sqlio results table grouping the Performance Weighting by:
- IO Pattern
- Drive Raid Level
- IO Outstanding
These were the 3 factors the model identified as most influential. The Bar Chart supports the findings of this DM model, that the performance weighting is greater when:
- IO Pattern = Sequential
- Drive RAID Level = 5
- IO Outstanding < 8
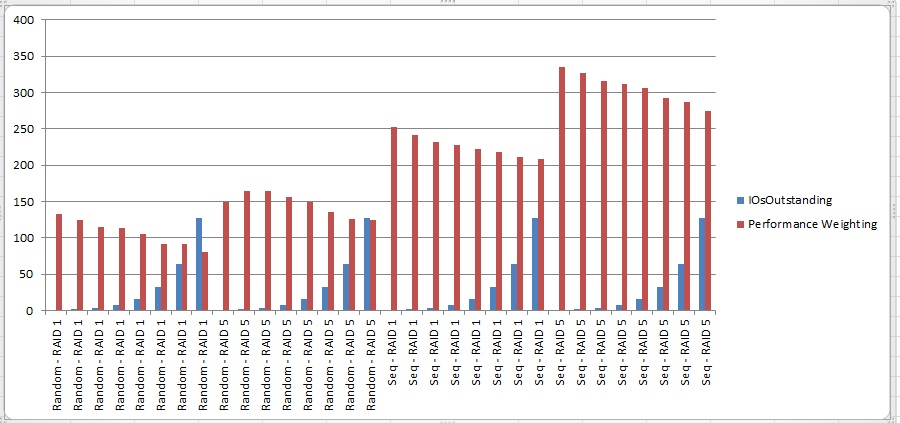
The chart shows a fairly linear performance degradation as IO Outstanding rises regardless of RAID level or IO Pattern. The effects are proportionally greater during Random IO where performance is poorer to start with and this is where subtle differences in the data mining model algorithms yielded different results. It would be interested diving deeper into the mining algorithms but a detailed understanding of them isn't the goal here and a quick glance at the raw data shows valid associations have been found. I don't profess to be a data mining expert but I am an enthusiastic user exploiting it to save time and gain insight in cases like this.
Conclusions
Both models reached different conclusions on the 3rd most influential factor affecting this calculated performance weighting. Both agree that the top two influencing factors are:
- IO Pattern = Sequential is good, random access is poor
- Drive RAID Level = 5 is good, 1 is poor.
They reached different conclusions on the 3rd most influential factor:
- In some cases, the read write distribution significantly impacts the performance weighting
- Another valid conclusion is that IO Outstanding is 3rd most influential. There is a tipping point around 8 where performance degrades as IO Outstanding rises.
Data mining is good technique for guiding initial investigations where a complex set of factors influence a result. Conclusions drawn from the mining models need to be clarified and confirmed using standard statistical techniques though. There's a 'Lift Chart' in data mining that measures the accuracy of its own conclusions but normal statistical queries are the way forward once the model points the way.
On this server, the RAID 1 drive will be used for the SQL Log file which involves mainly Sequential Write activity to which it is well suited. The RAID 5 volume is for the SQL Data file where the IO Pattern is liable to be more Random depending on workload, memory size and volatility, levels of index fragmentation affecting IO Pattern, key column choices for tables and so on. The performance characteristics of the RAID 5 drive are also well suited to its role. These RAID levels are the most frequently recommended types for the SQL Data and Logs, where RAID 10 is too expensive.
References
http://en.wikipedia.org/wiki/Decision_tree_learning
http://en.wikipedia.org/wiki/Logistic_regression

