

Problem
We want to compare two pandas series within nested ‘for’ loops and print out the sequence of the matched records? There are two parts to this solution:
- To determine, if a match exists between the geospatial data points generated by the GPS pings in the actual data set and the planned data set using Haversine Distance mathematical function written in Python. This method can be useful to address use cases such as ‘Route Verification or Detecting Missed Customer Stops’ often seen in transportation, logistics, waste collection and environmental services industries.
- Once the matched geospatial data points have been located we can extrapolate this analysis to determine the sequence of service(indices of the matched datapoints) and if it coincides with the planned sequence or not. This analysis can be used to address use cases such as ‘Route Compliance/Route Adherence’ to determine if the customers have been serviced in the same sequence or if there was a deviation in the actual sequence adopted. This will help businesses gain useful insights to answer specific questions as to why the driver not adhere to the ‘optimized’ route generated by the route editor software and if a genuine business reason for such a route-noncompliance was present.
Solution
In this section, we will look at the cleaned actual GPS events data set from one of the sources and compare it with the the second, planned data set. The cleaned data set represents the customer location, generated by an IoT device. The comparison is to determine if the geospatial data point from the actual GPS events are present in the planned data set by creating a geofence using the Haversine Distance function.
We will iterate the data points in the planned data set using a for loop and compare it with every data point in the actual data set using the inbuilt array function, enumerate, and append the matched lat long coordinates from the left list and the matched lat long coordinates in the right set into a list containing key value pairs.
Then we will unzip the key value pairs into separate panda series which we will convert into a single dataframe to determine missed data points, missed customer stops, and matched data points, services customers.
The first step would be to import the necessary dependencies and Python libraries into the JupyterLab IDE from the Anaconda Distribution.
""" Importing the necessary modules and dependencies """

import pandas as pd
import numpy as np
import matplotlib.pyplot as plt
import seaborn as sns
from IPython.display import HTML
import pandas.io.formats.style
from math import radians, cos, sin, asin, sqrt
from decimal import *
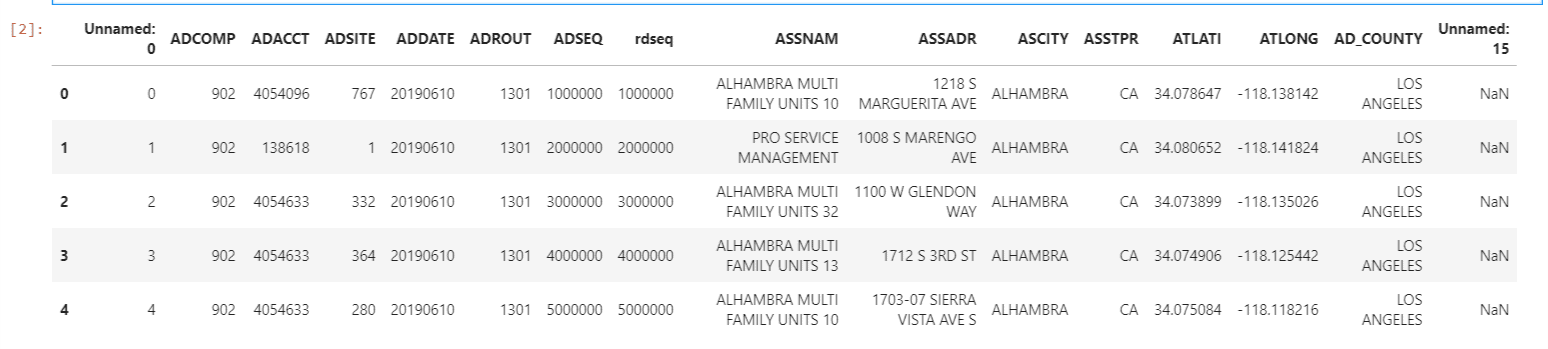
Next, we will read the cleaned planned events dataset obtained from the SQL Server Database. this is in csv format file with the name, Planned_902_1301_Cleaned.csv. We will convert it to a pandas dataframe with the name: planned_df. The dataset in the below example is shown for the company’s particular division number, 902, and route number 1301.
"""Reading the Planned_902_1301_Cleaned.csv file into a pandas dataframe.This is the planned dataset
   pertaining to Division Number:902 and Route #1301."""

planned_df = pd.read_csv(r"C:\Planned_902_1301_Cleaned.csv")
We can print the first 5 lines of the converted pandas dataframe, planned_df, with the head() method.
"""Printing the first 5 lines(sample) of the planned_df"""

planned_df.head()
We can use the shape method to get an idea of what the dataframe contains.
"""" Printing the structure of the planned_df dataframe to better understand the dataframe """

planned_df.shape

The planned_df pandas dataframe has the following fields:
- Unnamed:0 – This is the sequence of the record being read and written into pandas dataframe
- ADCOMP – company’s division number
- ADACCT – company division account number
- ADDATE – date of service
- ADROUT – route sequence number
- ADSEQ, rdseq – route sequence order
- ASSNAM – customer account name
- ATLATI – latitude coordinates of planned dataset
- ATLONG – longitude coordinate of planned dataset
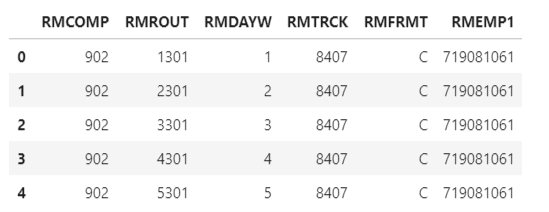
Next, we will read a second dataset in Excel format extracted from an employee database that contains the information pertaining to the division numbers serviced by each employee_id. This sample data pertains to the Employee_id, 719081061.
""" Reading the cleaned dataframe from locally stored csv file named EmpDiv_902_C_Emp719081061.xlsx
    file into a pandas dataframe. This dataset is for a specific Emp_id:719081061 and for Division
    Number:902 """

df_EmpDiv = pd.read_excel(r"C:\EmpDiv_902_C_Emp719081061.xlsx")


""" Printing the first 5 lines(sample) of the planned_df """

df_EmpDiv.head()
Next, we will read another locally stored cleaned dataset, which we obtained from the list of objects stored in an AWS S3 bucket and print the first 5 rows of the dataset. These are converted into a dataframe, df_actualevents.
""" Reading the cleaned dataframe from locally stored csv file named
   'Data_For_Emp_719081061_06102019.csv’contaning only the data for the emp:719081061"""

df_actualevents = pd.read_csv(r"C:\'Data_For_Emp_719081061_06102019.csv’)


""" Printing the first 5 lines(sample) of the df_actualevents dataframe"""

df_actualevents.head()
""" Converting the Planned Customer Lat Long Co-Ordinates (dataframe by the name ‘planned_df’), Actual
    Events GPS Pings Lat Long Co-Ordinates from the AWS S3 Bucket(dataframe by the name ‘df_actualevents’,
    truck_speed from the AWS data into a list to pass it into the Geo-Fencing code"""


center_pt_lat = planned_df.ATLATI.astype(float).tolist()
center_pt_long = planned_df.ATLONG.tolist()
test_pt_lat = df_actualevents.LATITUDE.tolist()
test_pt_long = df_actualevents.LONGITUDE.tolist()
truck_speed = df_actualevents.SPEED.tolist()
In the above code snippet we are passing the field, ATLATI, which is the planned latitude coordinate from the dataframe, planned_df. This gets converted into a list and stored in a variable, with the name, center_pt_lat. We do the same thing for the longitude coordinates as well and store them in the variable, center_pt_long. The same process is repeated for the latitude and longitude coordinates and the speed datapoints from the actual dataframe, df_actualevents, and stored in these variables: test_pt_lat, test_pt_long, and truck_speed, respectively.
We are doing this to match the actual lat/long co-ordinates with the planned lat/long co-ordinates. If there is a match we can verify that this customer has been serviced. If the truck speed is zero and there is no match between the actual vs. planned lat/long coordinates that is when we can determine that a datapoint has been missed in the planned dataset, which would further lead us to determine that the customer has not been serviced.
In the below snippet we will print out the lengths of the list.
""" Validating the lengths of the lists center_pt_lat,center_pt_long,test_pt_lat,test_pt_long and
    truck_speed """

len(center_pt_lat),len(center_pt_long),len(test_pt_lat),len(test_pt_long),len(truck_speed)
![]()
Next, we will define the Haversine Distance Function, which is shown in the snippet below:
""" Defining the Haversine Distance Function for creating a Geo-Fence as the customer lat long co-
    ordinates as the centroid of the circle."""


def haversine(lon1, lat1, lon2, lat2):
  """ Calculate the great circle distance between two points on the earth (specified in decimal
      degrees)"""

  # convert decimal degrees to radians
  lon1, lat1, lon2, lat2 = map(radians, [lon1, lat1, lon2, lat2])

  # haversine formula
  dlon = lon2 - lon1
  dlat = lat2 - lat1
  a = sin(dlat/2)**2 + cos(lat1) * cos(lat2) * sin(dlon/2)**2
  c = 2 * asin(sqrt(a))
  r = 3956 # Radius of earth in miles. Use 6371 for kilometers
  return c * r
In the below code, we are defining an empty list, Matched_Coordinates, and comparing each and every data point in the planned events list, center_pt_lat, by iterating it over the actual events list, test_pt_lat, and assigning it to the variables lat1 and ln1 in the inner ‘for’ loop. The same operation is performed for lat2 and lon2 as can be seen within the inner ‘for’ loop.
These four variables lon1, lat1, lon2 and lat 2 are passed as arguments into the Haversine distance function. The radius, r, in this use case is taken as 0.5 mile in accordance with the business use case we are dealing with. If the result, a, from the Haversine distance function is less then the radius, r, and truck speed is equal to zero, then we append the (lat1, lon1) with the [lat2,lon2] as the key value pair in a Python dictionary format to the empty list, Matched_Cooridnates. Now we have Matched_Coordinates as the list of key value pairs.
""" Calling the Harversine distance function and appending the matched co-ordinates into an empty list
    named matched_cordinates by running each and every point in the planned customer route to the actual
    events GPS ping data and storing them as key-value pairs in dictionary format """


Matched_Cordinates=[]

for index,lat in enumerate(center_pt_lat):
    for i in range(len(test_pt_lat)):
        lat1 = center_pt_lat[index]
        lon1 = center_pt_long[index]
        lat2 = test_pt_lat
        lon2 = test_pt_long
        radius = 0.5 # in mile
        a = haversine(lon1, lat1, lon2, lat2)
        if(a <= radius) and (truck_speed == 0):
            Matched_Cordinates.append({(lat1,lon1):[lat2,lon2]})
We can print the length of the list named ‘Matched_Coordinates’’
""" Validating the lengths of the matched_coordinates list to know the number of co-ordinates in the
    actual events data that have been matched planned events using the geo-fence method"""

len(Matched_Cordinates)

Next, we will remove all the duplicate values and print the list containing only the unique key value pairs as shown in the below script.
""" Removing all the duplicate values in the key-value pair in the python dictionary and printing only the
unique key-value pairs"""
list_of_unique_dicts=list(np.unique(np.array(Matched_Cordinates).astype(str)))
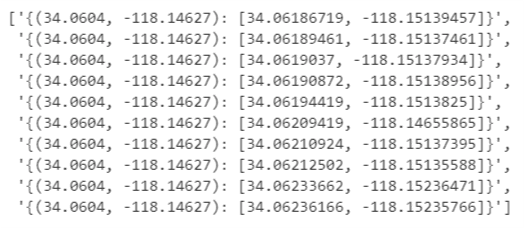
""" Printing a sample of the list_of_unique_dicts dictionary with planned Co-ordinates as the keys and the
actual event GPS pings as the values """
list_of_unique_dicts[0:10]
Printing the length of the unique list named ‘list_of_unique_dicts’
""" Validating the lengths of the list_of_unique_dicts list to know the number of co-ordinates in the
    planned events data that have been matched with the connect events GPS ping data using the geo-fence """

len(list_of_unique_dicts)

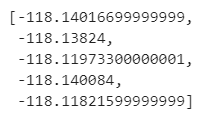
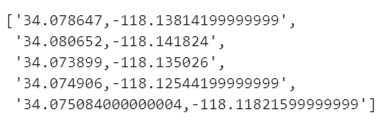
In the below code snippet, we will be extracting only the unique keys from the list, list_of_unique_dicts, and then we will perform the unzipping operation to print out the first 5 elements of the latitude and longitude coordinates as separate lists.
""" Getting only the unique keys from the list named ’list_of_unique_dicts’ """

lis = Matched_Cust_Cordinates

unique_keys = set( key for dic in lis for key in dic.keys())
"""Performing the Unzipping Operation"""


test_list = unique_keys
res = [[ i for i, j in test_list ],
    [ j for i, j in test_list ]]

res[0][0:5] # Printing the sample of the unzipped list for the latitude co-ordinates
![]()
res[1][0:5] # Printing the sample of the unzipped list for the longitude co-ordinates
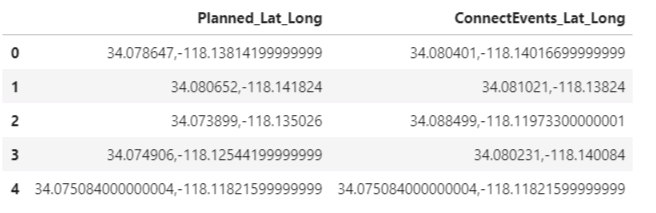
Next, we will be appending the matched latitude and longitude coordinates from the actual events unzipped list into a pandas series. We will then be appending these series into a single column, MyComparisionDF['ConnectEvents_Lat_Long'], in the dataframe, MyComparisionDF. The lat long coordinates from the planned events also is appended as a separate column, MyComparisionDF['Planned_Lat_Long'], in the dataframe, MyComparisionDF, as shown in the below scripts.
""" Putting the Matched Customer Latitude and Longitude Co-Ordinates from the actual connect(gps) events
    unzipped list into a Pandas Series"""

Matched_Connect_Lat=pd.Series(res[0]).astype(str)
Matched_Connect_Long=pd.Series(res[1]).astype(str)
""" Creating an empty dataframe by the name MyComparisionDF to compare the actual events GPS Co-Ordinates
    with the Planned events Co-Ordinates"""

MyComparisionDF = pd.DataFrame()
""Appending the planned event coordinates and actual events coordinates into this empty dataframe
  MyComparisionDF for comparison purposes"""

MyComparisionDF['Planned_Lat_Long'] = planned_df['ATLATI'].map(str)+','+ planned_df['ATLONG'].map(str)
MyComparisionDF['ConnectEvents_Lat_Long'] = Matched_Connect_Lat.map(str)+','+ Matched_Connect_Long.map(str)


""" Printing the sample, first 5 rows of the dataframe named ‘MyComparisionDF' dataframe """

MyComparisionDF.head()
Next, we will compare the coordinates in the planned sequence of events with that of the actual sequence of events to determine if there is a match. When a match is found then we print ‘Yes, Customer Served’ or else we print’ Oops, Missed this customer’ and print the coordinates of the mismatched datapoint.
"""Comparing the co-ordinates in the planned sequence with the actual lat long coordinates of the from the
   coordinates of the GPS pings"""


Planned_Route_Mis_Matched_Cordinates=[]
Planned_Route_Matched_Cordinates=[]
Route_Compliance=[]
df_actual_list=MyComparisionDF.ConnectEvents_Lat_Long.tolist()

for x in MyComparisionDF.Planned_Lat_Long:
  for i in range(len(MyComparisionDF.ConnectEvents_Lat_Long)):
    if x == MyComparisionDF.ConnectEvents_Lat_Long:
      Planned_Route_Matched_Cordinates.append(x)
      Route_Compliance.append(" Yes, Customer Served")
      Planned_Route_Mis_Matched_Cordinates.append('Nan')
      break
  if not x in df_actual_list:
    Route_Compliance.append("Oops, Missed This Customer")
    Planned_Route_Mis_Matched_Cordinates.append(x)
We are initializing three empty lists here by the name
- ‘Planned_Route_Mis_Matched_Cordinates’
- ’Planned_Route_Matched_Cordinates’
- ’Route_Compliance’
We print the first 5 elements of the newly created three lists.
""" Printing sample of the Planned_Route_Matched_Cordinates"""

Planned_Route_Matched_Cordinates[0:5]
""" Printing sample of the Planned_Route_Mis_Matched_Cordinates"""

Planned_Route_Mis_Matched_Cordinates[0:5]
![]()
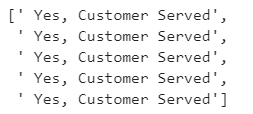
""" Printing sample of the Route_Compliance"""

Route_Compliance[0:5]
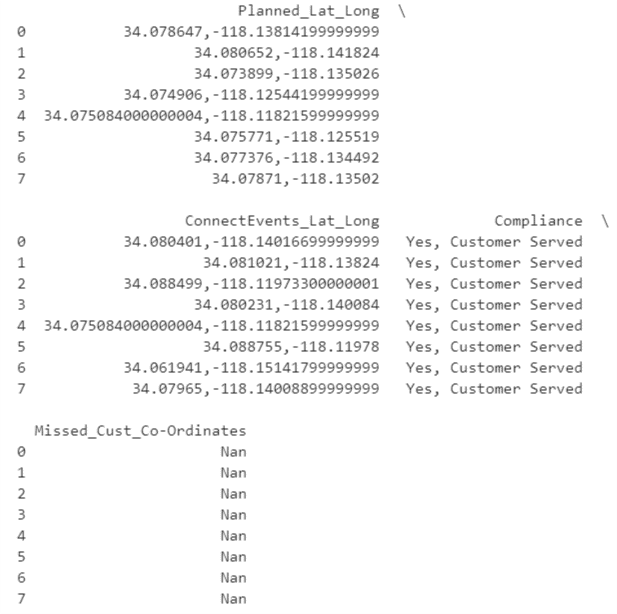
Next, we append the newly created lists as additional fields (columns) into the dataframe with the name, MyComparisionDF and then print the first 5 rows of this dataframe.
""" Appending the Missed_Cust_Cordinates Column to the MyComparisionDF"""

MyComparisionDF["Missed_Cust_Co-Ordinates"] = Planned_Route_Mis_Matched_Cordinates


"""Printing the sample, first 5 lines of the MyComparisonDF"""

print(MyComparisionDF.head(8))
Next, we will work on getting the sequence of the planned events in the planned event dataset and appending the planned_indices to the dataframe, MyComparisionDF. In the below snippet, we are initializing an empty list, planned_indices, to capture the indices of the matched coordinates in the list, df_planned_list. Next we will loop over the list, df_planned_list, using the enumerate method to get the indices of the matched latitude longitude coordinates.
""" Getting the planned sequence of the customers in this route"""


planned_indices = []

df_planned_list = MyComparisionDF.Planned_Lat_Long.tolist()

for index, val in enumerate(df_planned_list):
    planned_indices.append(index)
In the below snippet, we are creating a new column, Planned_Sequence, and appending the planned_indices list to the dataframe, MyComparisionDF.
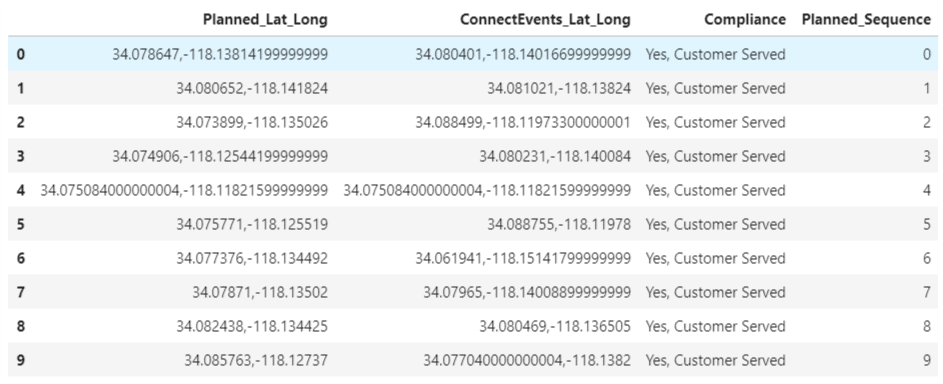
""" Appending the Planned_Sequence column to the MyComparisionDF dataframe"""

MyComparisionDF["Planned_Sequence"]=planned_indices
MyComparisionDF.head(10)
Next, to get the indices of the customers served sequence from the ConnectEvents_Lat_Long column, we will iterate over each data point in ConnectEvents_Lat_Long to find its corresponding match in the Planned_Lat_Long. When such a match is found, we will capture the index of the datapoint and append it the empty initialized list, served_indices.
""" Getting the served sequence of the customers in this route"""

served_indices=[]
df_actual_list = MyComparisionDF.ConnectEvents_Lat_Long.tolist()

for x in MyComparisionDF.Planned_Lat_Long:
    for i in range(len(MyComparisionDF.ConnectEvents_Lat_Long)):
        if x == MyComparisionDF.ConnectEvents_Lat_Long:
            served_indices.append(i)
            break
    if not x in df_actual_list:
        served_indices.append("")
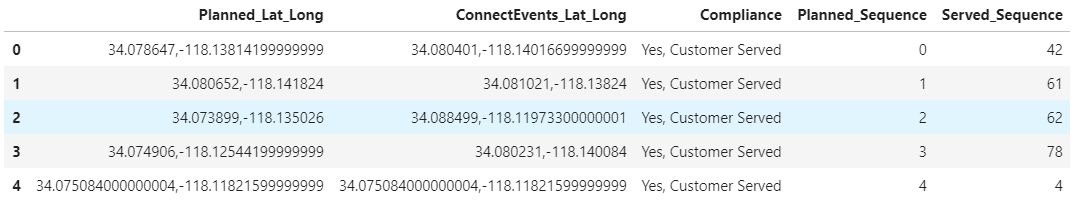
Then we will append the served_indices list to the dataframe, MyComparisionDF, by creating a new column, Served_Sequence.
""" Appending the Served_Sequence column to the MyComparisionDF dataframe and printing the sample of the
    manipulated DF"""

MyComparisionDF["Served_Sequence"]=served_indices
MyComparisionDF.head()
Next, we will compare Planned_Sequence with Served_Sequence and print the result in a newly created column, Compliance_Adherence, in the dataframe, MyComparisionDF. We are using the select method from the numpy module of Python. The numpy.select () function returns an array drawn from elements in choicelist, depending on conditions as we can see from the below script.
""" Comparing the Planned_Sequence with the Served_Sequence of the customers in this route"""


sr= len(MyComparisionDF['Planned_Sequence'])

conditions = [
    (MyComparisionDF['Planned_Sequence'] == MyComparisionDF['Served_Sequence']),
     (MyComparisionDF.Served_Sequence.isnull())]

choices = ['Yes Correct Order', 'Not Applicable']

for  i in range(sr) :
    MyComparisionDF['Compliance_Adherence'] = np.select(conditions, choices, default='Wrong Order')
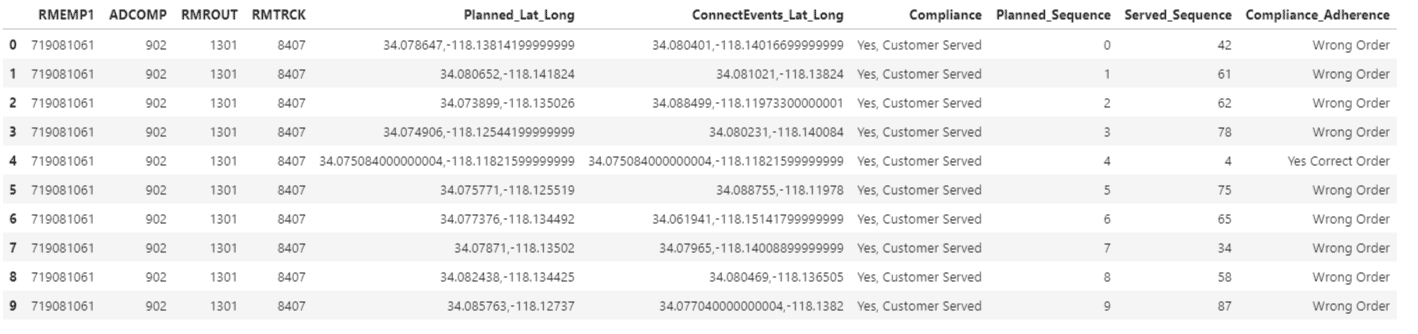
We print the first 15 lines of the dataframe, MyComparisionDF, with the newly appended column, Compliance_Adherence.
"""Printing the first 15 lines of the MyComparisionDF after appending the Compliance_Adherence column"""

MyComparisionDF.head(15)

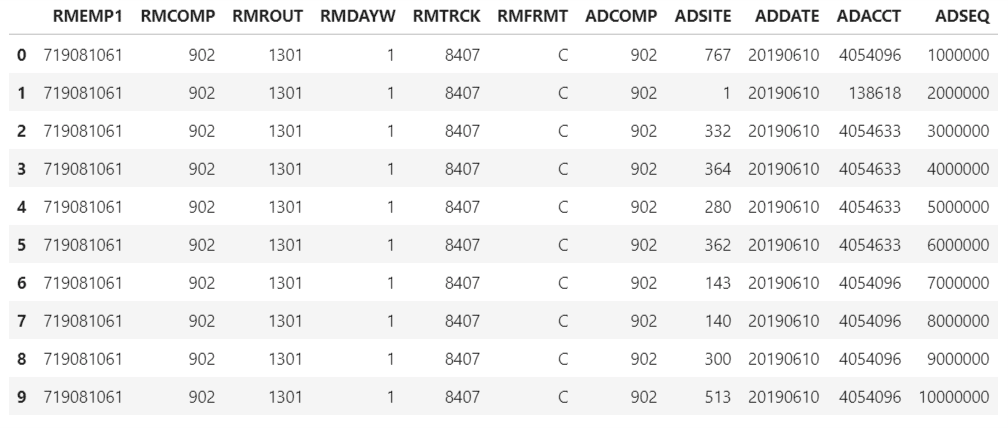
""" Merging Employee and planned_df dataframes into one single dataframe"""


df_planned= pd.merge(left=div_EmpDiv[['RMEMP1','RMCOMP','RMROUT','RMDAYW','RMTRCK','RMFRMT']], right=planned_df[['ADCOMP','ADSITE','ADDATE','ADACCT','ADSEQ']], how='inner',left_on=['RMCOMP'], right_on=['ADCOMP'])

df_planned.head(10)
Now we merge the df_planned and the ‘MyComparisionDF’ into one single dataframe, result.
""" Merging df_planned dataframe and MyComparisionDF into one single dataframe"""


result = pd.concat([df_infopro_planned, MyComparisionDF], axis=1, join='inner')
result.head()
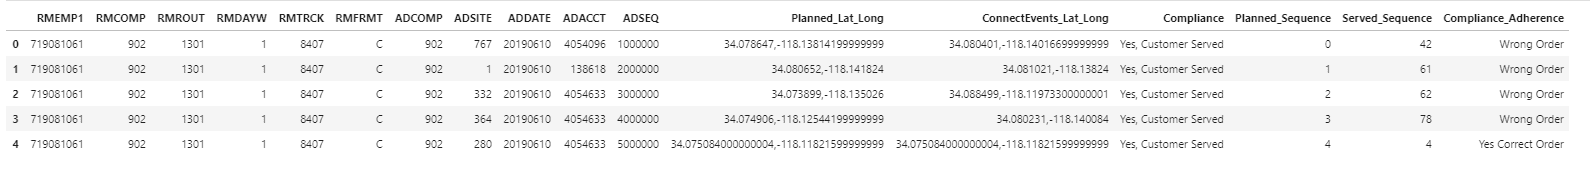
Next, we retain only the required columns.
""" Retaining only the required columns from the results dataframe and printing the sample 10 lines of the
    manipulated dataframe"""


result = result[['RMEMP1','ADCOMP','RMROUT','RMTRCK','Planned_Lat_Long','ConnectEvents_Lat_Long','Compliance','Planned_Sequence','Served_Sequence','Compliance_Adherence']]

result.head(10)
Next, we can calculate the compliance adherence for this route as follows:
""" Calculating the Compliance percentage for this route"""


sr= len(result['Compliance_Adherence'])
x=0
for i in range(sr):
    if result.Compliance_Adherence == "Yes Correct Order":
        x = x+1

print("The Compliance Adherence for this route is ", colors.green(str(round((x/sr)*100,2)) + '%91$s))of the manipulated dataframe"""

To make this look better, we apply a font color, blue, and highlighting:
print("\033[1;36;34m The Compliance Adherence for this route is :\033[1;37;40m", str(round((x/sr)*100,2)))![]()
Summary
This method of comparing two lists, planned vs. actual, by extracting just the latitude longitude coordinates from both the dataframes and comparing this geospatial data using the Haversine distance formula can be used to address business use cases like Service Verification or Detecting missed customer stops. Creating a geofence with the planned event coordinates as the centroid and looping over the actual data points from the GPS pings to determine the matched coordinates is an efficient mathematical method, but this may also yield to some false positives, which need to be dealt with cautiously.
The truck speed equal to zero, could be also the case when the truck or the van is standing at a traffic light or near the customer location. In that case, the model would still predict as the customer being served. In such a scenario, we can incorporate a time function into the model, which will eliminate such false positive occurrences and increase the performance of the model. Also, the determination of the radius ’r’ for the geofence varies depending upon the business use case.
Finding the sequence of the matched datapoints in the actual events vs. the planned events can help address business use cases such as Route Compliance/Route Adherence to determine if the customers have been serviced in the same sequence or if there was a deviation in the actual sequence adopted. This will help the business gain useful insights to answer specific questions as to why the driver not adhere to the ‘optimized’ route generated by the route editor software and if a genuine business reason for such a route-noncompliance was present.
Next Steps
Here, we have looked at using a previously cleaned ready to use data frame (as one of the data sources) to do advanced data analytics by incorporating built in functions from the mathematical libraries of Python and advanced mathematical functions such as Haversine Distance on this dataset to answer questions such as service verification and route compliance/route adherence for various business units within the organization.
To gain a holistic overview of how Diagnostic, Descriptive, Predictive and Prescriptive Analytics can be done using Geospatial data, read my recent paper, which has been published on advanced data analytics use cases pertaining to that. To read more about IoT technologies and how the convergence of OT and IT can cause expansion of the threat landscape and attack surfaces for organizations (transportation, logistics, manufacturing) visit my most recent peer-reviewed paper. This paper also discusses the cybersecurity best practices and strategies in mitigating such threats.