

Have you ever been asked: when did that table get modified, dropped or created? Had an auditor ask when the last time the sa id logged in to your SQL Server, and login auditing is turned off? Or asked any question that if only Profiler had been collecting the data, the question could have answered either before it was asked or the data supplied quickly.
SQL Server 2005 has some new tools and views that can help out in a pinch but what about all of us still using SQL Server 2000? Many of us are, either because of compatibility issues, budget restraints, or some other reason.
In this article we’ll walk through a solution that has been implemented on servers that are SOX Compliant and servers where the developers just have too much access for a DBA's piece of mind. Or at least this DBA.
The included template tracks DDL statement execution. The attachment at the end of this article contains 9 files, each of which is highlighted here and then explained later on:
- DTS - SQL_TRACE_WORKFLOW – stop current trace, loads data and restarts trace
- DTS – SQL_START_TRACE – called by SQL_TRACE_WORKFLOW to start trace
- DTS – SQL_CHECK_TRACE – verifies current trace is running and restarts if necessary
- audit_traceserver.sql – executed on audit server and creates required database and objects
- audit_repository.sql – executed on the storage server and creates required database and objects
- Audit Server and Repository can be shared or separate
- Audit_check_job.sql – job which verifies trace is running and restart if necessary
- Audit_job.sql – start trace when sql agent starts and cycles log file at predefined interval
- Sqltrace.trc – empty file required for initial start of auditing
- SQLProfiler_Audit.tdf – trace template that was used to build audit script
As mentioned above, the server being audited and the repository server can be the same server or separated. This method allows storage of data on a server that can be shared by many collection processes.
To install follow the steps below:
Connect to the traced server and open the script file audit_traceserver.sql. This script will create a database named trace_repository along with the following objects:
- Tbl_traceconfig – stores configuration data for the trace options, the default values should be modified to match your environment
- Path - location to store trace file, should be UNC accessible from both trace and repository server
- Filesize – rollover file size default 512mb
- Currtraceid – populated after trace is started and used to verify trace is active
- Archive – location to archive trace files, subdirectory with current date and time is created
- Archivefile – 1, archive files 0, do not archive files
- Archivedays – days to keep records in active trace table, this is keyed on starttime, not all events record endtime
- Dsp_trace_create_start – stored procedure that contains trace definition, events columns and filters, this can be customized using the following process: (view SQLProfiler_Audit.tdf for example file)
- Open SQL Profiler
- Select Create a New Trace
- Set Events and Filters until audit criteria is correct
- Select File/Script Trace/For SQL 2000
- After Saving the file open in a text editor
- Select all text inside the file between
- set @on = 1 and -- Set the trace status to start
- Copy the selected text
- Open the store procedure in Trace_Repository on the TraceServer called dbo.dsp_trace_create_start
- Replace all text between the same two tags in the procedure and apply the changes, then exit
- Dsp_trace_stop – stops current trace using value stored in tbl_traceconfig.currtraceid
Execute the script once values for tbl_traceconfig have been verified.
Save the file sqltrace.trc in the directory specified in the Path location specified in tbl_traceconfig.
Connect to the repository server and open the script file audit_repository.sql. This script will create the following objects if needed:
- Database – the trace_repository, if on the traced server, the repository database will already be created from previous step
- Dsp_trace_load_data – load data into tbl_stage_trace, created by DTS package and then moves to tbl_trace
Execute script once verified.
DTS Packages: Installation/Configuration/Explanation (all are stored repository server)
- SQL_START_TRACE – does the actually starting of the trace using values from global variables
- Set Instance – set monitored instance, passed in from calling Packages
- Gather Configuration – set values for rollover size and trace output path
- Start Trace – executes dsp_trace_create_start, which is stored on the monitored server.

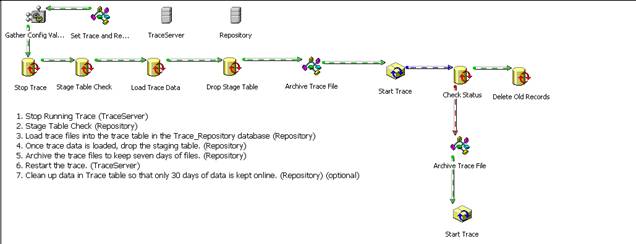
- SQL_TRACE_WORKFLOW – stop current trace, load data, restart trace
- Trace Server/Repository connections to SQL Instances
- Set Trace and Repository – uses global variables to set value for SQL connections these values are passed in through job (***)
- Gather Config Values – dynamic properties task to set trace options bases on values in tbl_traceconfig, archive days is stored as positive and converted here
- Stop Trace – calls dsp_trace_stop to stop currently running trace if any, uses trace_id set in Gather Config Values
- Stage Table Check – drops tbl_stage_trace if it exists
- Load Trace Data – uses fn_trace_gettable to load data into tbl_stage_trace, an intermediate step is needed since fn_trace_gettable is used select into to load empty table, this table then either uses insert into or select into based on check if tbl_trace exists, the path of the trace data to pass in is set by Gather Config Values and passed into this procedure
- Drop Stage Table – drops tbl_stage_trace, previous check is to ensure it does not exists
- Archive Trace File – moves current trace file to archive location or deletes if archive flag is not set, archive flag and archive path are both set using Gather Config Value
- Start Trace – execute package task to start DTS Package SQL_Start_Trace. The server name will need to be changed to match the SQL Instance where the package is stored. After changing the name, reselect the package SQL_START_TRACE or paste the name into the text box. Follow this process for both Execute Package Tasks.
- Check Status – if trace has started, verified by executing fn_trace_getinfo on server being traced, trace_id is set in the global variables, the value is updated in the Start Trace package task
- Delete Old Records – if trace restarts then delete records from tbl_trace with endtime older than the archive days
- Archive Trace File
The package is executed by job Audit_job, which is executed from the repository server
- SQL_CHECK_TRACE – verifies current trace is running
- Set Instance – set trace server instance to value passed in
- Gather Trace Config – dynamic properties task to set trace options based on values in tbl_traceconfig, only currtraceid is required in this process
- Check Status – verifies trace is active by executing fn_trace_getinfo on server being traced
- Restart Trace Workflow execute package task to start DTS Package SQL_Start_Trace. The server name will need to be changed to match the SQL Instance where the package is stored. After changing the name reselect the package SQL_TRACE_WORKFLOW or paste the name into the text box.
Package is executed by job Audit_Check_Job which is executed from the repository server
Jobs:
- Audit_job – executed from repository server to call SQL_TRACE_WORKFLOW, described above. The jobs defaults to both the Trace and Repository server being on the same default instance. If this is in correct then lines 10 and 11 should be modified:
select @dbserver = convert(varchar(32),serverproperty('servername'))
select @traceserver = convert(varchar(32),serverproperty('servername'))
This job should be set to execute on regular schedule as it will recycle the output file. The default schedule is 12:05 am nightly and at SQL Agent startup.
- Audit_Check_Job – executes from the repository server to call SQL_CHECK_TRACE, described above. The jobs defaults to both the Trace and Repository server being on the same default instance. If this is in correct then lines 10 and 11 should be modified:
select @dbserver = convert(varchar(32),serverproperty('servername'))
select @traceserver = convert(varchar(32),serverproperty('servername'))
This job should be scheduled to run every 5 minutes to reduce chance of data loss, which is the default schedule.
Miscellaneous Notes:
- If TraceServer and Repository server are different:
- Right Click SQL_TRACE_WORKFLOW on the Jobs Menu and select Properties
- On the Steps Tab double click step 1 and change the value for the trace server being passed into the correct instance:
- "TraceServerInstance":"8"="yourservernamehere"
- Click OK, Click OK
- Right Click Trace_Check_Status and repeat the process
- Job Alerts:
- If jobs are monitored the following are common issues associated with job failure
- Failure of Job Meaning
- SQL_TRACE_WORKFLOW – load of data and restart has failed, data is not being collected during the failure
- Trace_Check_Status – Trace has stopped unexpectly and will be retried automatically, if a failure of SQL_TRACE_WORKFLOW follows then data is not being collected
- Parameters in Execute SQL Tasks:
- Several of the Execute SQL Tasks parameters are used when calling system functions or stored procedures. The DTS Designer errors when attempting to perform this action directly so a workaround was used to allow the passing of parameters. Each of the SQL Tasks that has this issue was first coded to do a select from sysobjects using a parameter, ie. Select * from sysobjects where name = ?. Once the parameter(s) were coded into the calls that code was commented out and the actual coded added with the parameter, ie. -- if not exists(select * from ::fn_trace_getinfo(?)). Each of the Check Status tasks uses this method to verify the trace is running the code snippet is pasted here.
--select * from sysobjects where name = ?
if not exists(select * from ::fn_trace_getinfo(?))
 select * from sysobj
The components explained here have been developed to allow tracing of any data that can be collected by SQL Profiler. Auditing can be automated and history kept for the data collected. Native SQL tools have been used to create this process and although it may not be as powerful as third party tools it has a very low price tag. We have not gone into detail of how the system functions and procedures work as that is available in Books Online.
