

Introduction
Azure Data Factory is the cloud-based ETL and data integration service that allows you to create data-driven workflows for orchestrating data movement and transforming data at scale. We can create and schedule data pipelines which can move data between various supported data stores. We can also use for data transformation before loading it into the target data store.
A quick overview of the capabilities of Azure Data Factory:
- Connect and collect: You can connect various sources and move data from both on-premises and cloud source data stores into a centralization data store in the cloud for further analysis.
- Transform and enrich: We can process the data or transform it before loading it into the destination data store.
- CI/CD and publish: Full support for CI/CD using Azure devops and GitHub.
- Monitor: You can monitor each scheduled activity or manual runs. Azure Data Factory has built-in support for pipeline monitoring via Azure Monitor, API, PowerShell, Azure Monitor logs, and health panels on the Azure portal.
An overview of what we will be doing:
- Create an Azure SQL Database for our sink (Destination data store).
- Provision an Azure Data Factory service.
- Create a Storage account and upload the csv file into a container, this will be the source.
- Load the csv file into the Azure SQL database via ADF pipeline using Manual/Automated trigger.
- Trigger the pipeline manually and on a schedule
- Monitor the pipeline runs.
Pre-requisites:
- An Azure Subscription with contributor or owner role, or an administrator role.
- Basic Azure portal knowledge
- Basic knowledge on Azure SQL database and Storage account
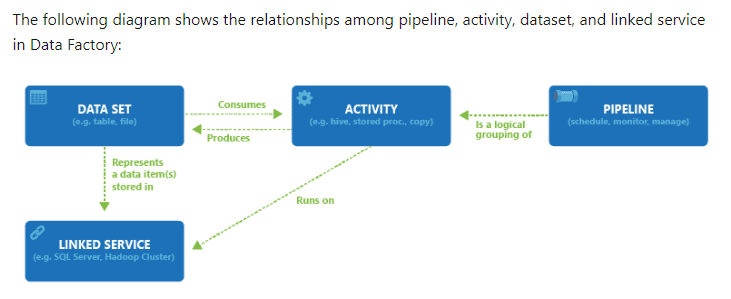
In this article, we will create our first Azure data pipeline and schedule it to run daily and will load the data in csv file from blob storage into Azure SQL database. The below figure (Fig 1) will give a visualisation of the setup we will be doing in this article.
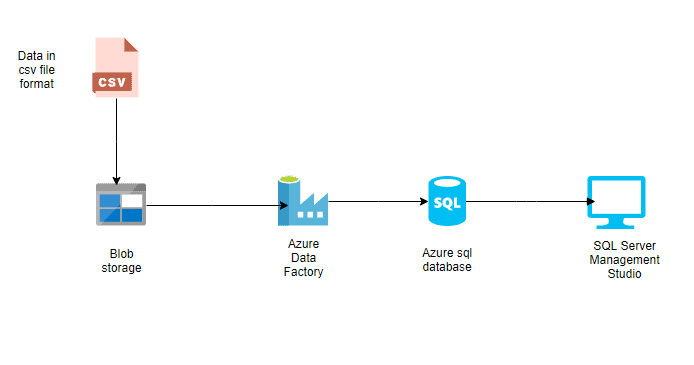
Fig 1. Diagram representation of the workflow
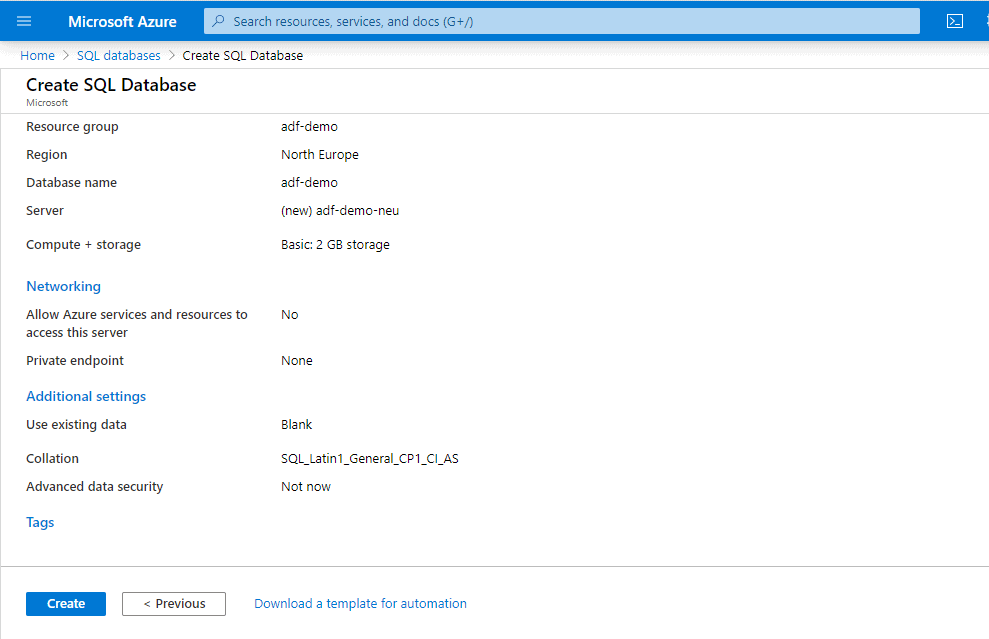
Creating Azure SQL Database
This will act as our Sink. Sink is the destination/target data source when it comes to Azure Data Factory.
- Resource group: adf-demo
- Region: North Europe
- Server: adf-demo-neu (This must be a unique name)
- Database name: adf-demo
We will use this blank database as a destination to load a csv file. We will use same region and Resource group for all our resources.
Once the resource is created, we will need to add our IP (Internet Protocol) in Firewall and Virtual Networks settings. Click ' + Add Client IP' to do this. It will allow us to connect the database via SSMS locally from our laptop. For my case it was 90.195.58.138
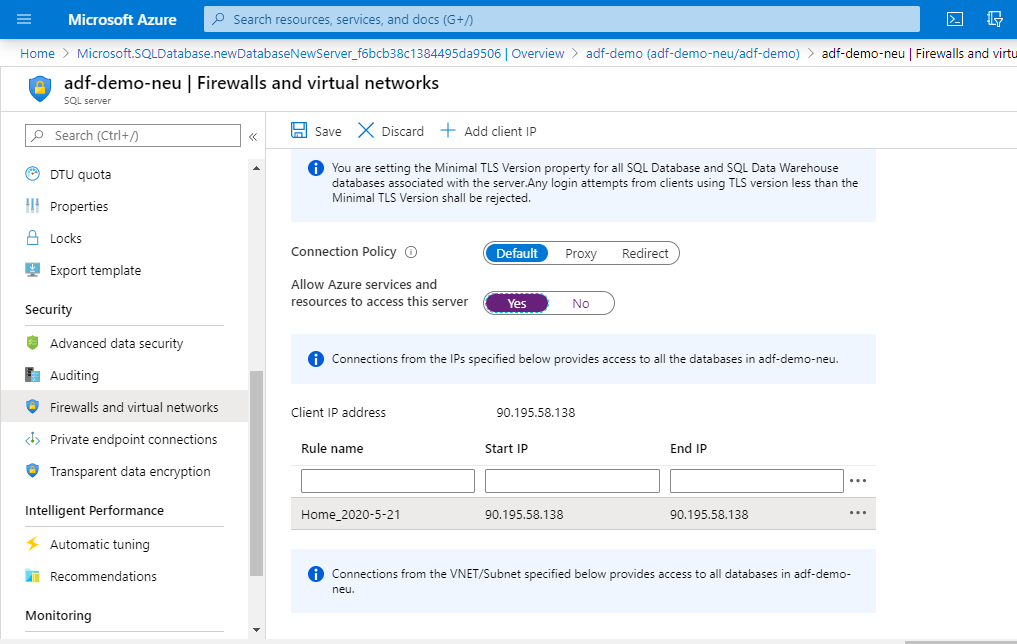
Once the firewall was opened for the specific public IP, we were able to connect the database.
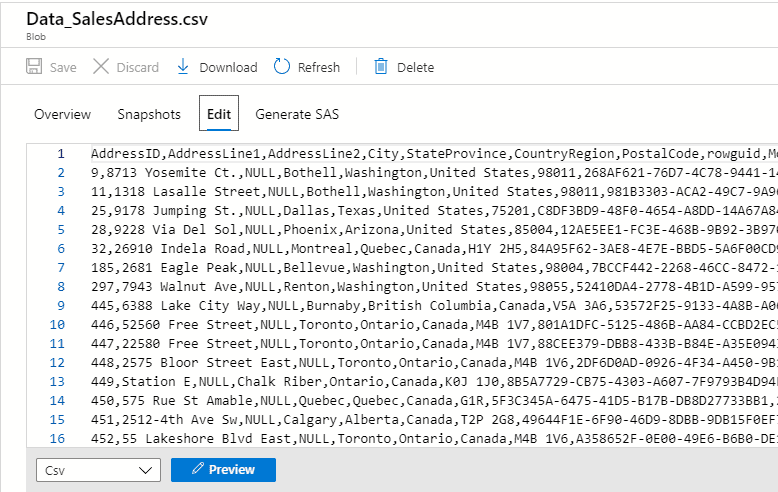
We have a csv file, Data_SalesAddress.csv, saved locally. This file looks like the below screenshot. It has some comma separated data from an address table. We will create a table with similar schema in our destination data store. This is to make sure we can load this data into the target data store.
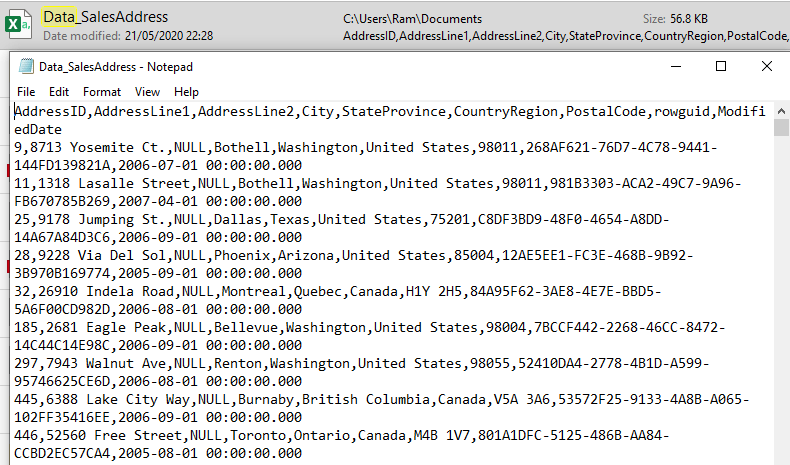
You can copy the below data into a csv file and use it while working on this article.
AddressID,AddressLine1,AddressLine2,City,StateProvince,CountryRegion,PostalCode,rowguid,ModifiedDate
9,8713 Yosemite Ct.,NULL,Bothell,Washington,United States,98011,268AF621-76D7-4C78-9441-144FD139821A,2006-07-01 00:00:00.000
11,1318 Lasalle Street,NULL,Bothell,Washington,United States,98011,981B3303-ACA2-49C7-9A96-FB670785B269,2007-04-01 00:00:00.000
25,9178 Jumping St.,NULL,Dallas,Texas,United States,75201,C8DF3BD9-48F0-4654-A8DD-14A67A84D3C6,2006-09-01 00:00:00.000
28,9228 Via Del Sol,NULL,Phoenix,Arizona,United States,85004,12AE5EE1-FC3E-468B-9B92-3B970B169774,2005-09-01 00:00:00.000
32,26910 Indela Road,NULL,Montreal,Quebec,Canada,H1Y 2H5,84A95F62-3AE8-4E7E-BBD5-5A6F00CD982D,2006-08-01 00:00:00.000
185,2681 Eagle Peak,NULL,Bellevue,Washington,United States,98004,7BCCF442-2268-46CC-8472-14C44C14E98C,2006-09-01 00:00:00.000
The table schema looks like the below script. We will create the table in destination with below script.
/****** Object: Table [dbo].[Address] Script Date: 28/05/2020 00:40:57 ******/SET ANSI_NULLS ON
GO
SET QUOTED_IDENTIFIER ON
GO
CREATE TABLE [dbo].[Address](
[AddressID] [int] IDENTITY(1,1) NOT NULL,
[AddressLine1] [nvarchar](60) NOT NULL,
[AddressLine2] [nvarchar](60) NULL,
[City] [nvarchar](30) NOT NULL,
[StateProvince] [nvarchar](50) NOT NULL,
[CountryRegion] [nvarchar](50) NOT NULL,
[PostalCode] [nvarchar](15) NOT NULL,
[rowguid] [uniqueidentifier] NOT NULL,
[ModifiedDate] [datetime] NOT NULL
)
GO
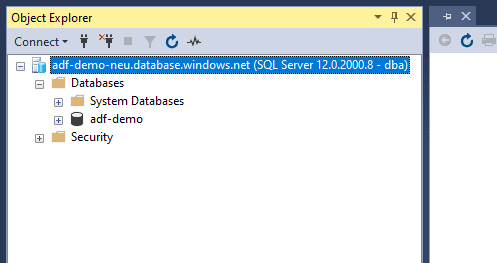
We run this script in SSMS.
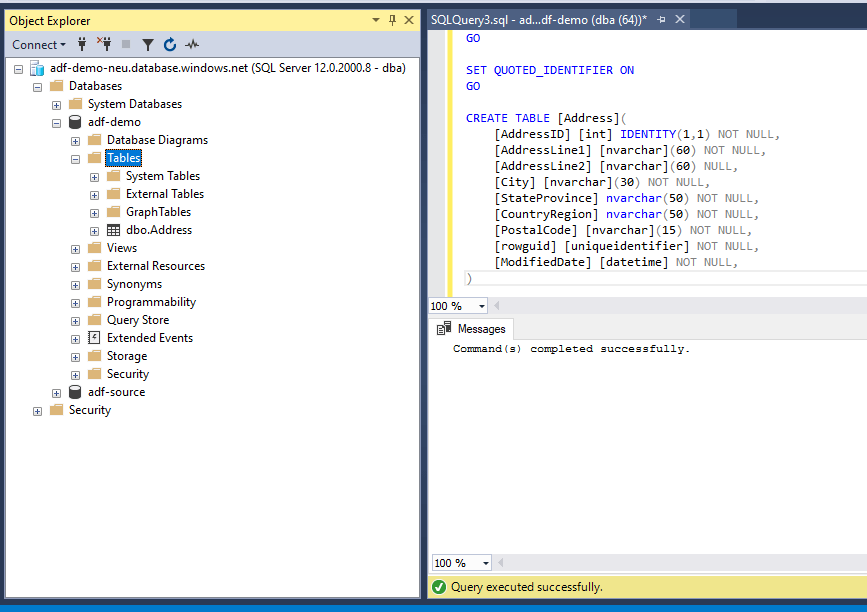
The script completed successfully.
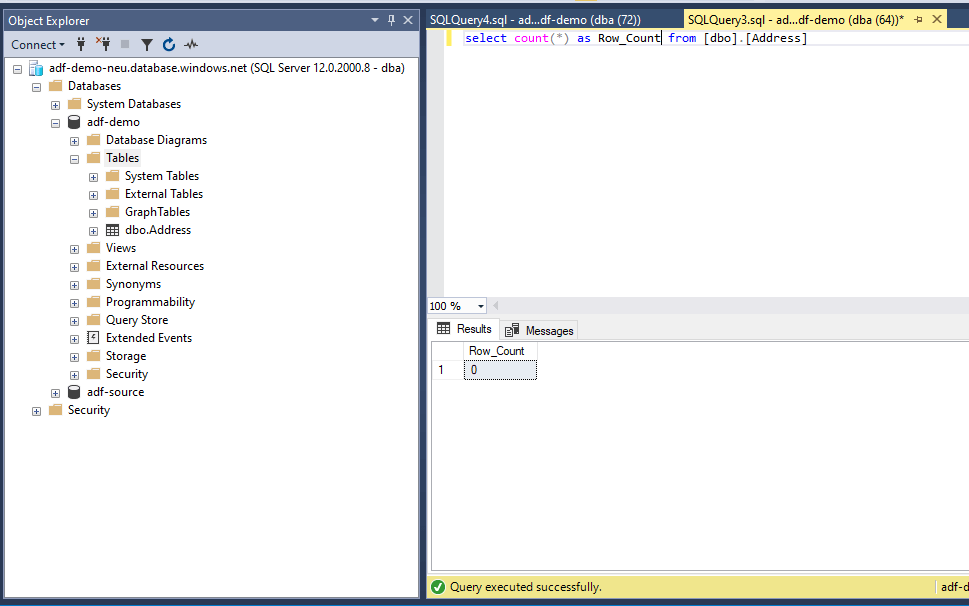
Our Destination is now ready and does not have any data. We will now create other parts that will be used in our workflow.
Creating the Data Factory
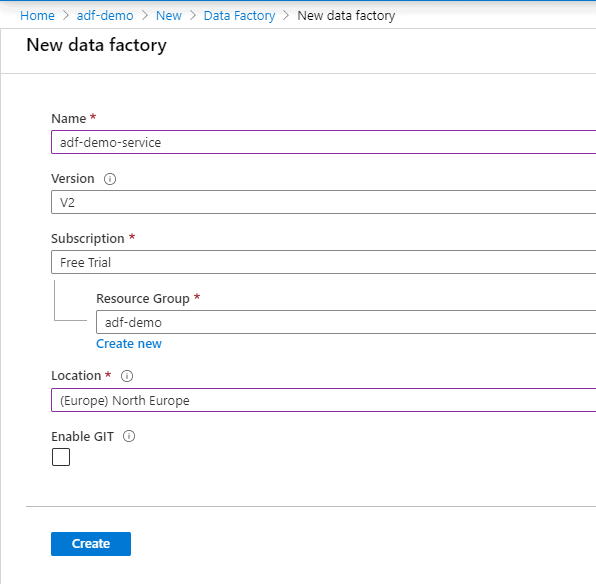
Use the portal, Select ‘Add a resource’ and quick search ‘Data Factory’. Create a ‘Data Factory’ resource with you own naming convention. Use Version V2 for the best experience, V1 will soon be deprecated. I will be using the values shown below:
- Name: adf-demo-service
- Version: V2
- Resource group: adf-demo
Click ‘Create’.
To read more about the Azure Data Factory version comparison (V2 vs V1) please go through: https://docs.microsoft.com/en-us/azure/data-factory/compare-versions
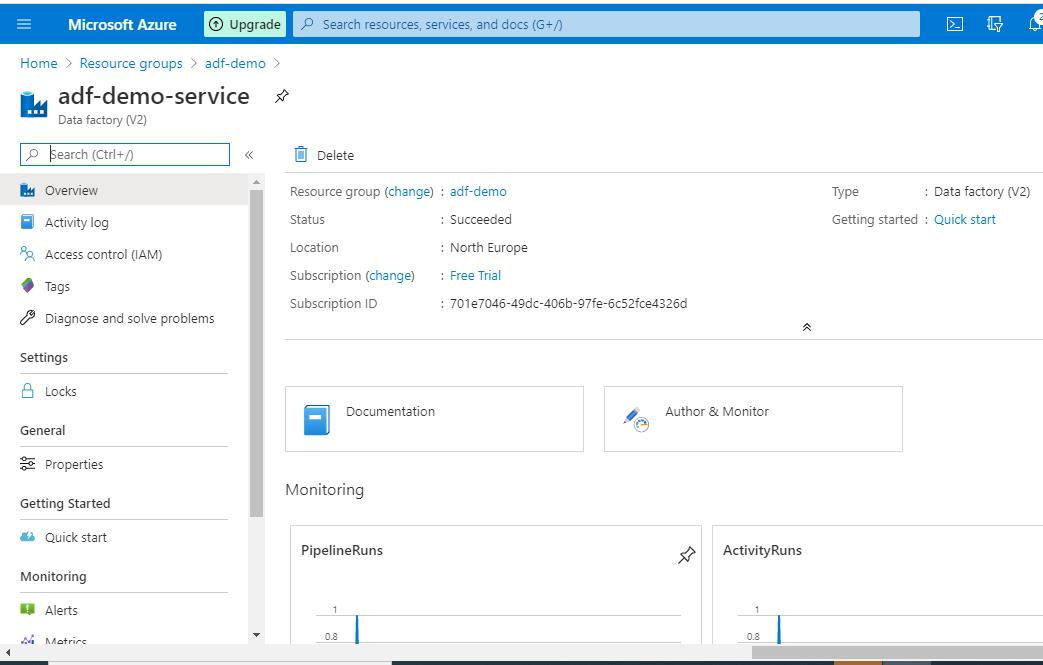
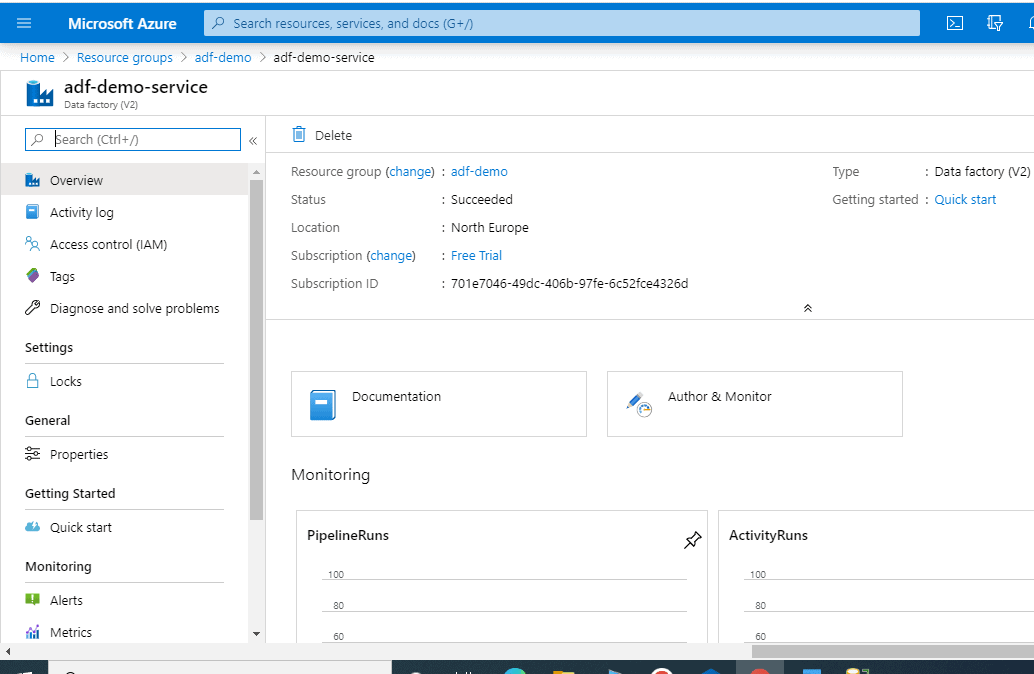
Once created, you can go to the resource to have a look at the overview.
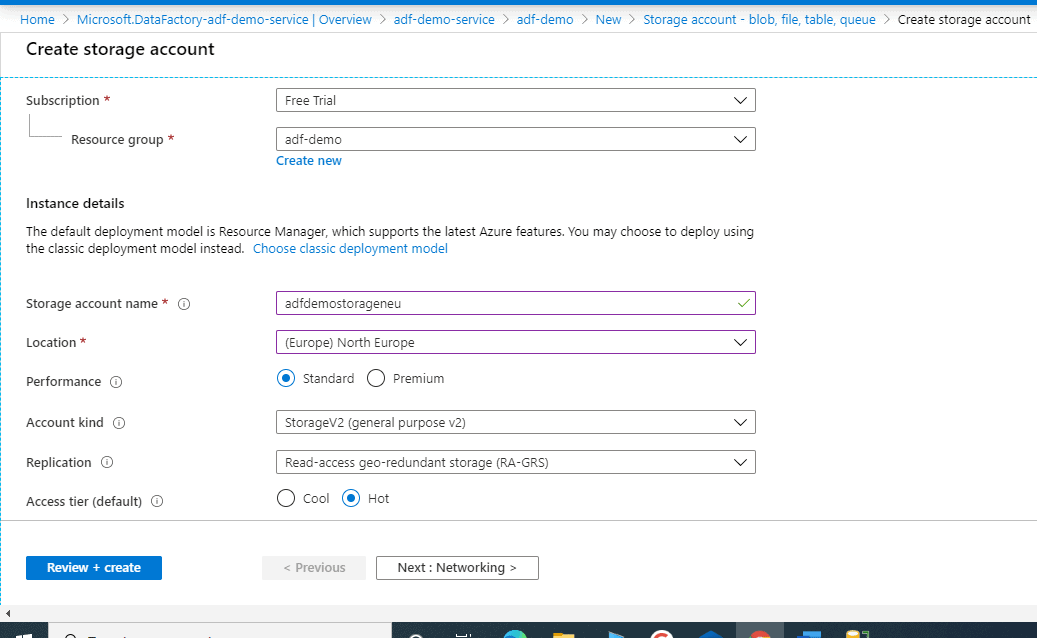
Creating the Storage Account
We will now create the storage account where we will upload the csv file which will be used in our data pipeline. We will use this as our source.
- Resource group: adf-demo
- Storage account name: adfstorageneu (This must be a unique name)
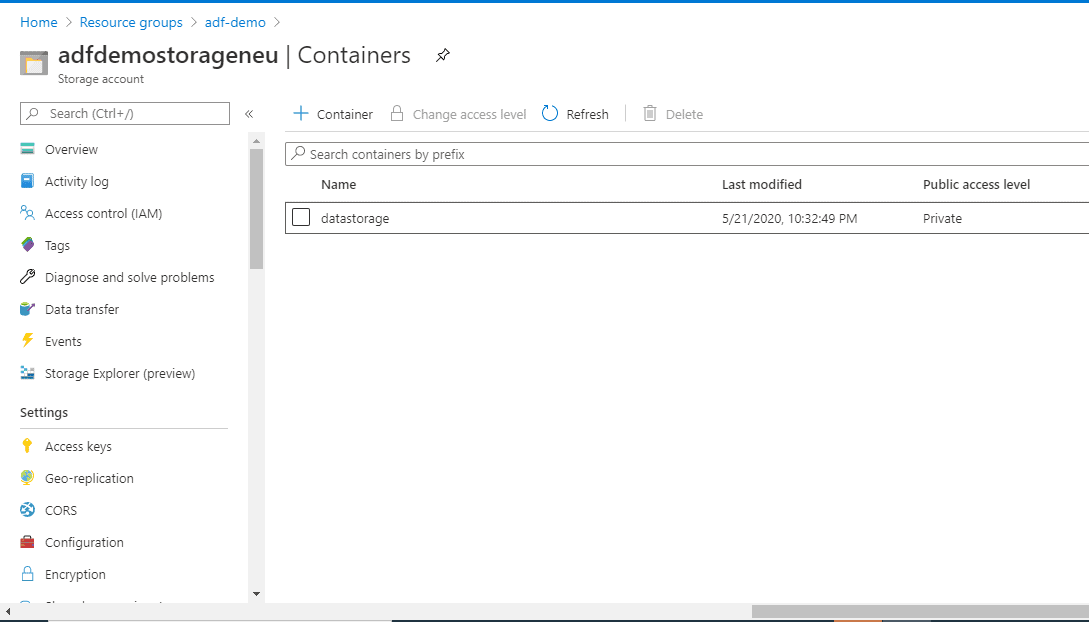
Once the storage account is created successfully, create a container to store our csv file. We will call it ‘ datastorage ’.
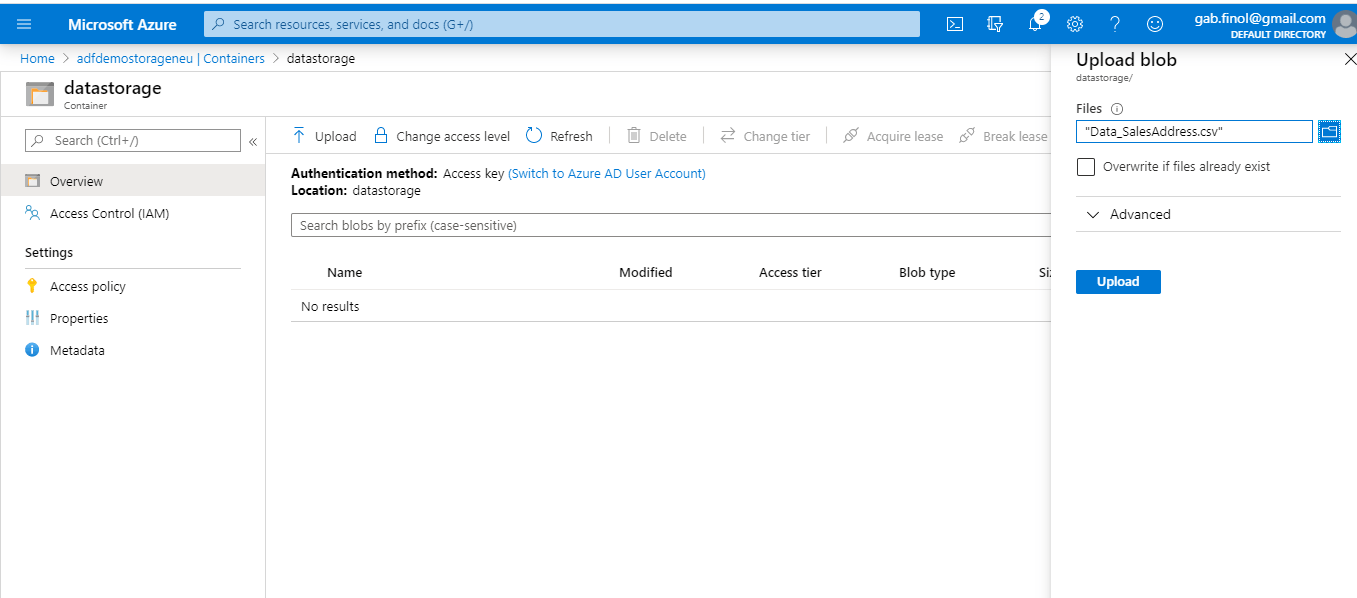
Click on the Upload button and upload the csv file into the container.
Below is how the csv file, Data_SalesAddress.csv, looks when viewed from the portal
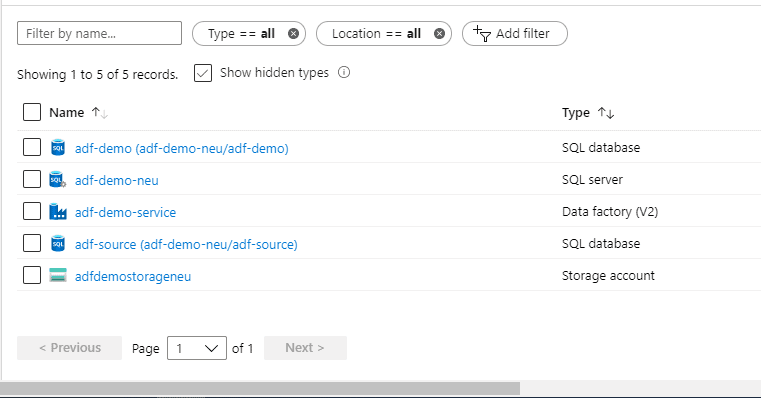
We have all our resources ready to be used. Please ignore the database 'adf-source' in the below screenshot.
Creating our Data Factory Data pipeline
Select the ADF resource [adf-demo-service] and click ‘Author & Monitor’.
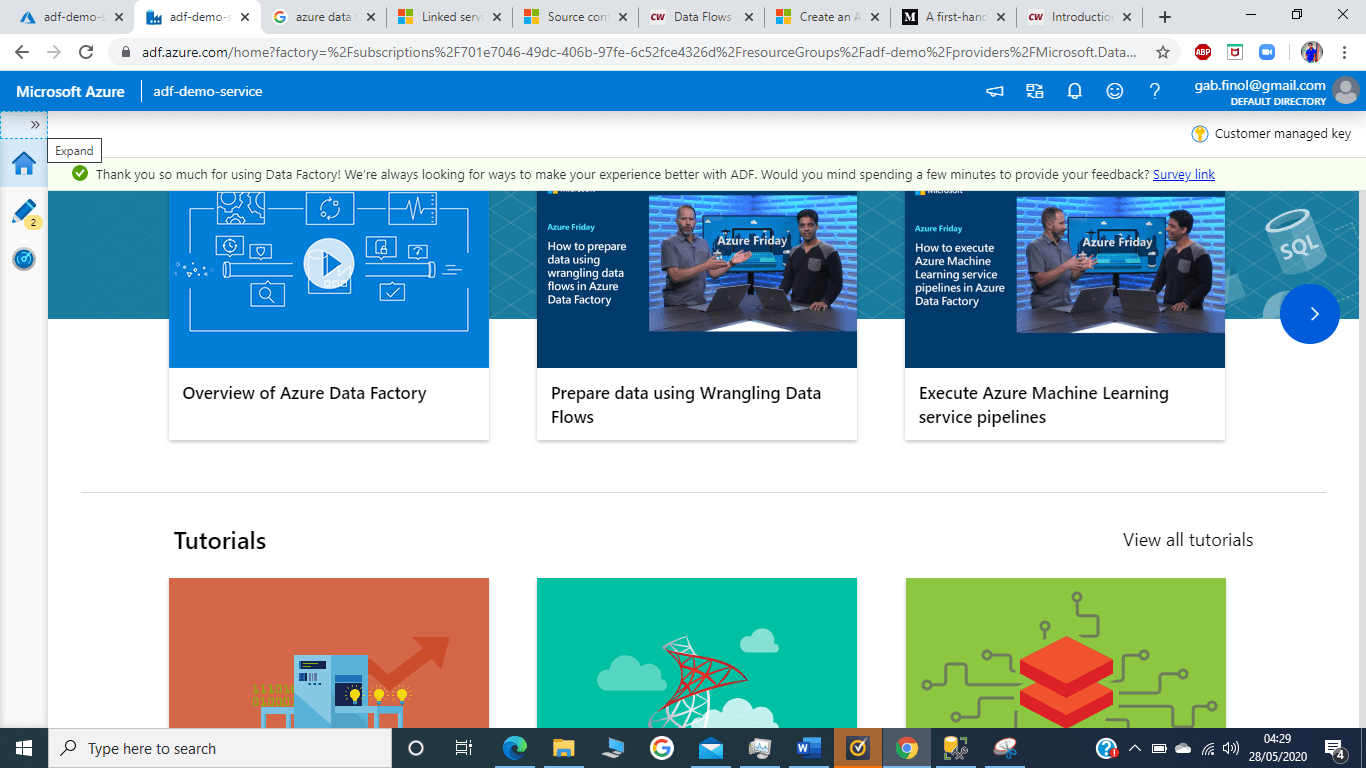
Once you click ‘Author & Monitor’ , a new tab will open which will look like the below figure. This is where all the Data Factory magic will take place.
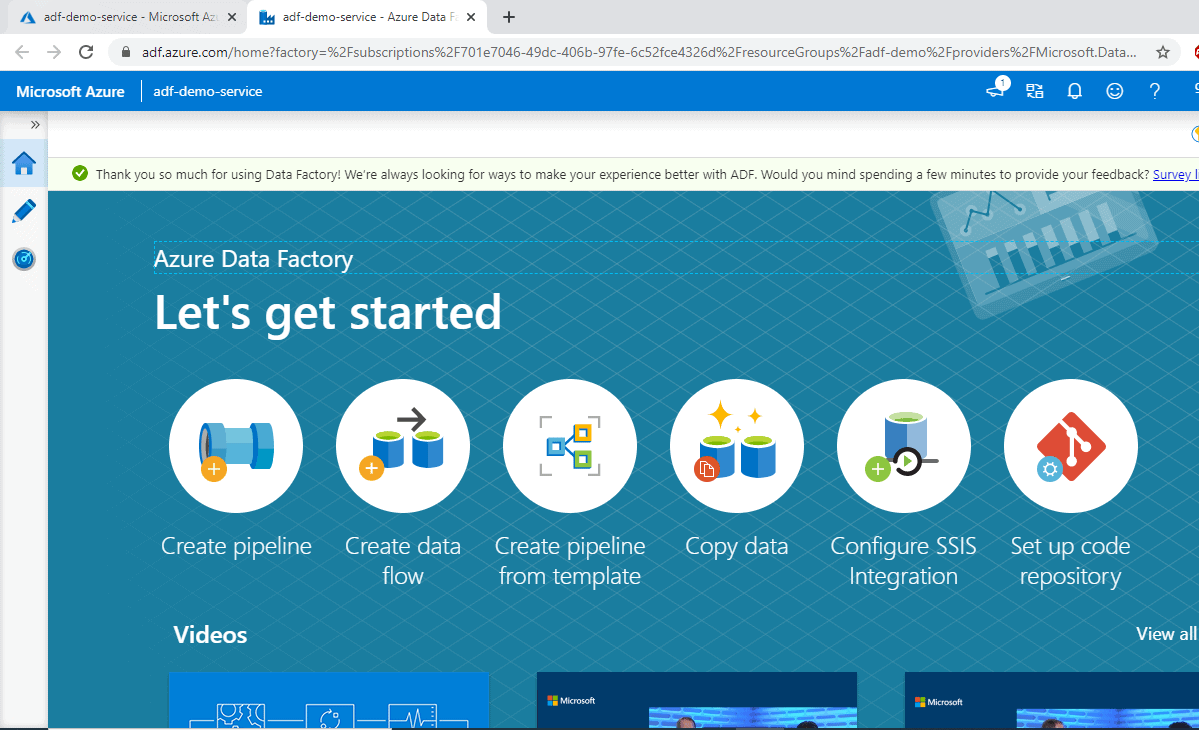
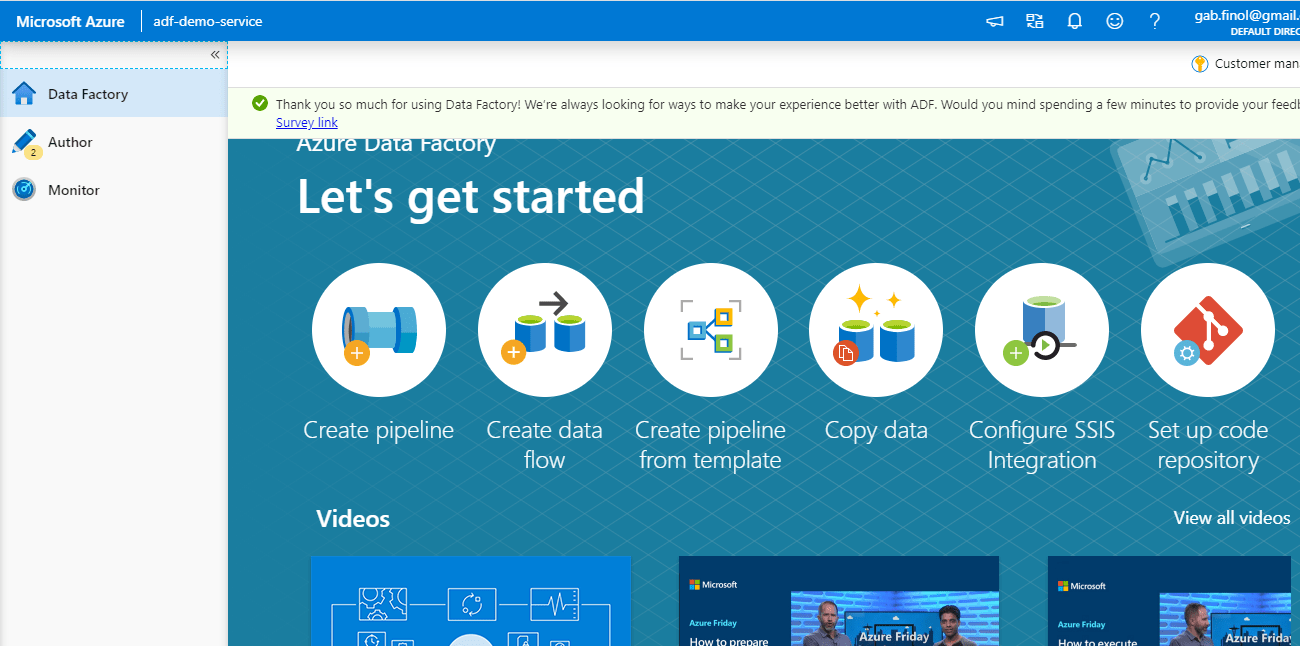
This new tab has multiple options which you can use. We will be creating a pipeline from scratch. However, let’s take a high-level look at the options available:
Create pipeline: This will let you create a data pipeline from scratch. We will be using this for our purpose.
Create Data flow: It allows you to develop graphical data transformation logic that can be executed as activities within ADF pipelines.
Create pipelines from template is self-explanatory
Copy data: It is pre-defined activity for copying data data stores located on-premises and in the cloud. We can use this for our purpose; however, we will create a pipeline from the scratch which will copy data from blob storage to SQL Database.
Configure SSIS Integration: It is basically used for utilising the SSIS packages in Azure environment. More information can be found here: https://docs.microsoft.com/en-us/azure/data-factory/create-azure-ssis-integration-runtime
Setup code repository: This will enable you to configure a Git repository with either Azure Repos or GitHub. More about this can be found here: https://docs.microsoft.com/en-us/azure/data-factory/source-control
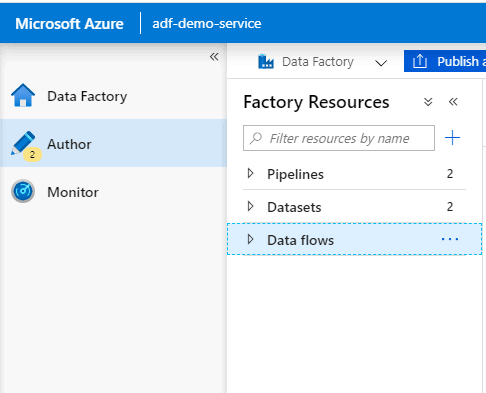
Click on the expand button >> on the top-left
Now you can see all the three tabs available:
- Data Factory Overview
- Author: This is where we will do all our ETL work
- Monitor: This is where we monitor our various task runs
We will click on ‘Create pipeline’ in Data Factory Overview tab and below page will be presented. This is where we will create our first data pipeline. Give a name to your pipeline and let is be as it is. We will come back to this later once we are done with Linked services and Datasets.
Our data pipeline name: [LoadData-BlobToSqlDatabase]
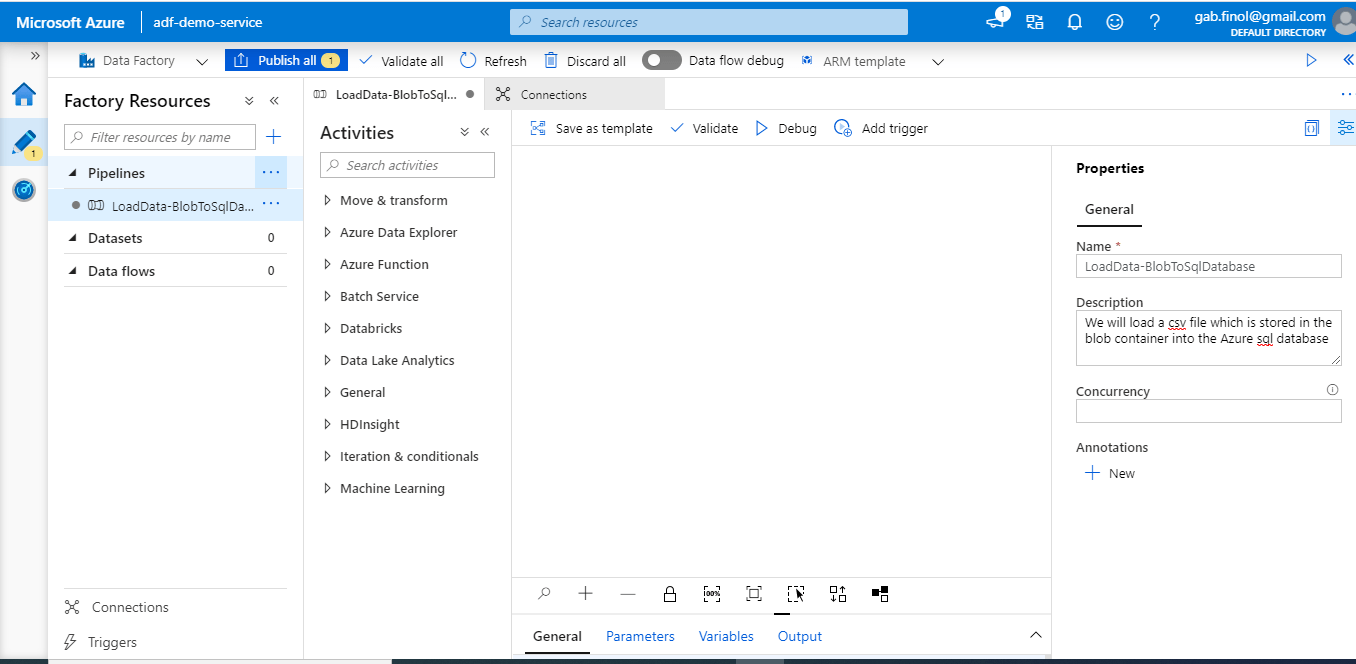
Here is some high level information about the various components in Azure Data Factory:
- Pipelines: A data factory can have one or more pipelines. A pipeline is just a container for activities.
- Datasets: These are named views or just representation that points to the data we will use as input and output.
- Activities: Activities are definitions of what actions to perform on your data, e.g. using the copy activity to move data from one data store to another data store. A pipeline can have one or more activities which can be configured as per requirement.
- Linked Service: are much like connection strings, which define the connection information needed for Data Factory to connect to external resources. This is what helps us connect to various data sources.
- Triggers: You can schedule a pipeline to kick off at a certain time and this can be viewed in the triggers tab at the bottom.
Creating the pipeline and testing
We have already named our pipeline; however, it is empty as of now. So, we will need to first create ‘Linked services’ and then use it to create ‘Datasets’ Once we have our ‘datasets’, we will configure the pipeline.
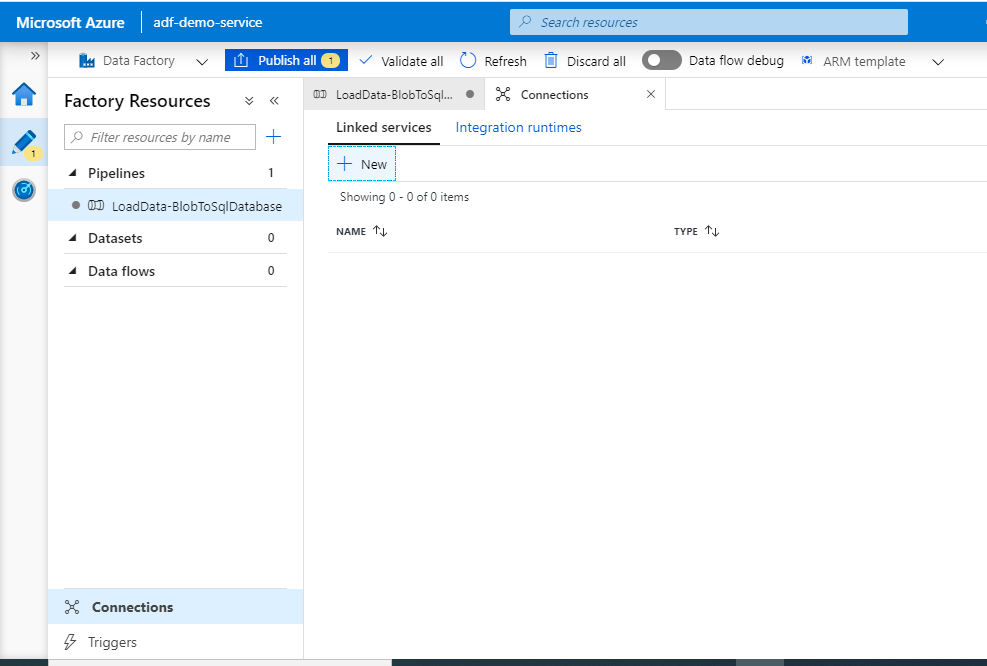
Creating Linked Services
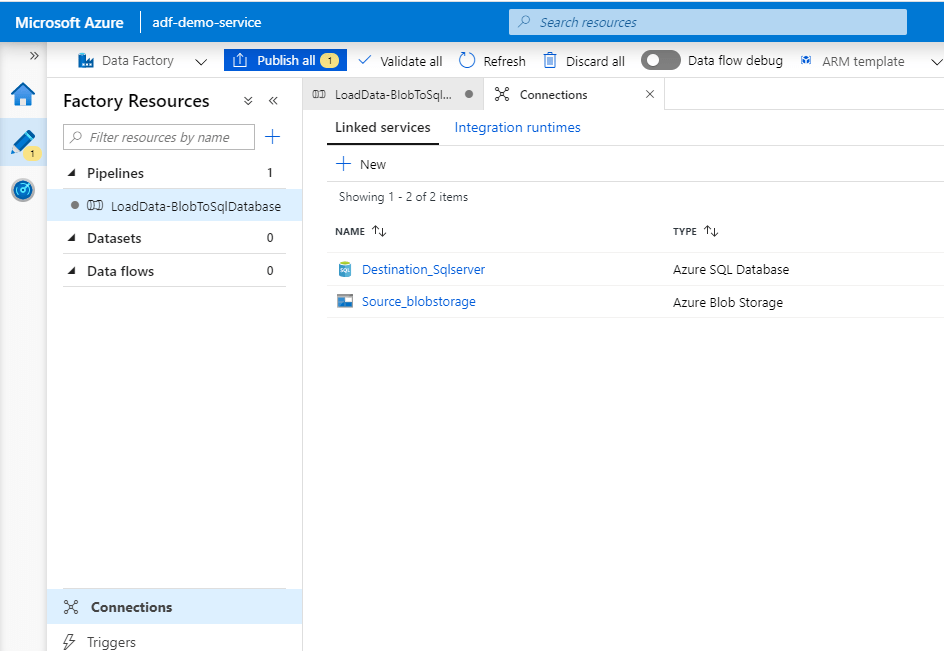
Click on ‘Connection’ at the bottom left, this is where we will create our ‘Linked service’. The source and destination for our pipeline will be created and the connection will be tested. Then click ‘+ New’
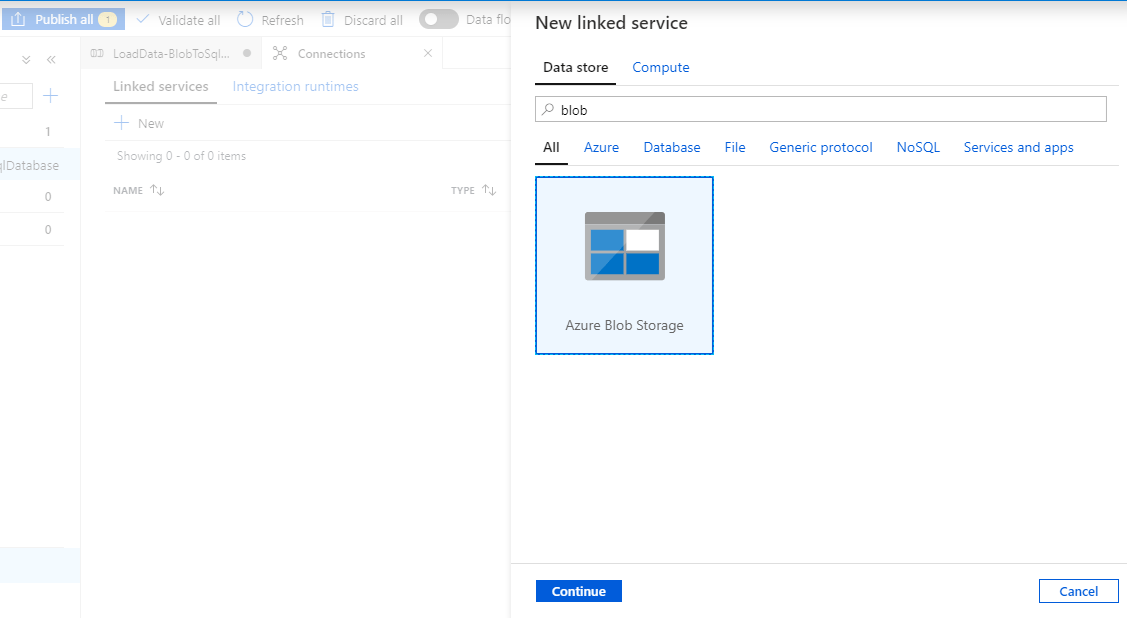
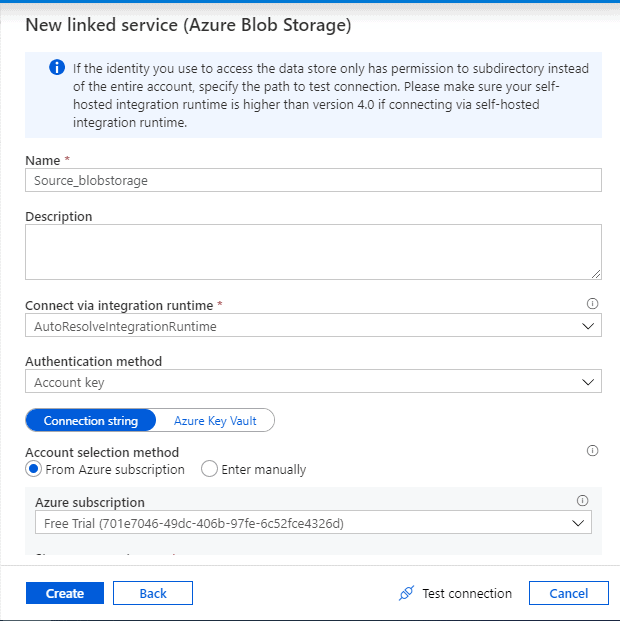
Source linked service: Our csv file is stored in blob container so we will search blob and select ‘Azure Blob Storage’ and click ‘Continue’
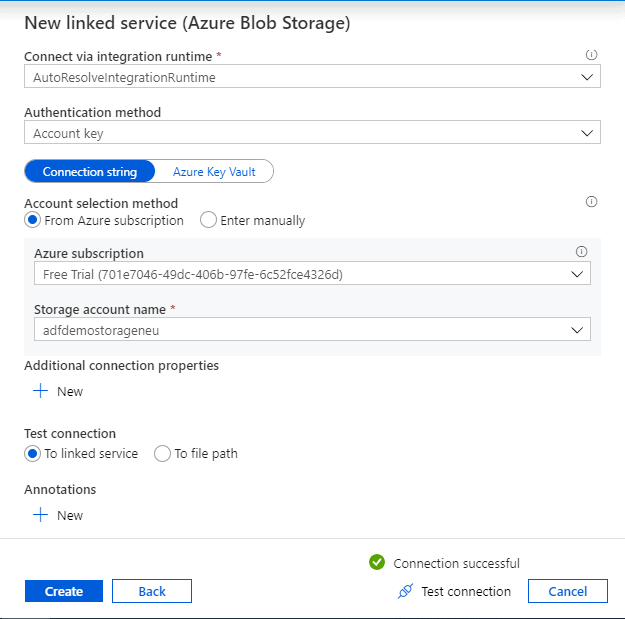
Provide a suitable name and our storage account details which was created in Step 3. Select the subscription and the storage account while leaving the other options as below. Click ‘Test Connection’. Once successful, click ‘ create’. This will create our ‘Source’ linked service.
Name: Source_blobstorage
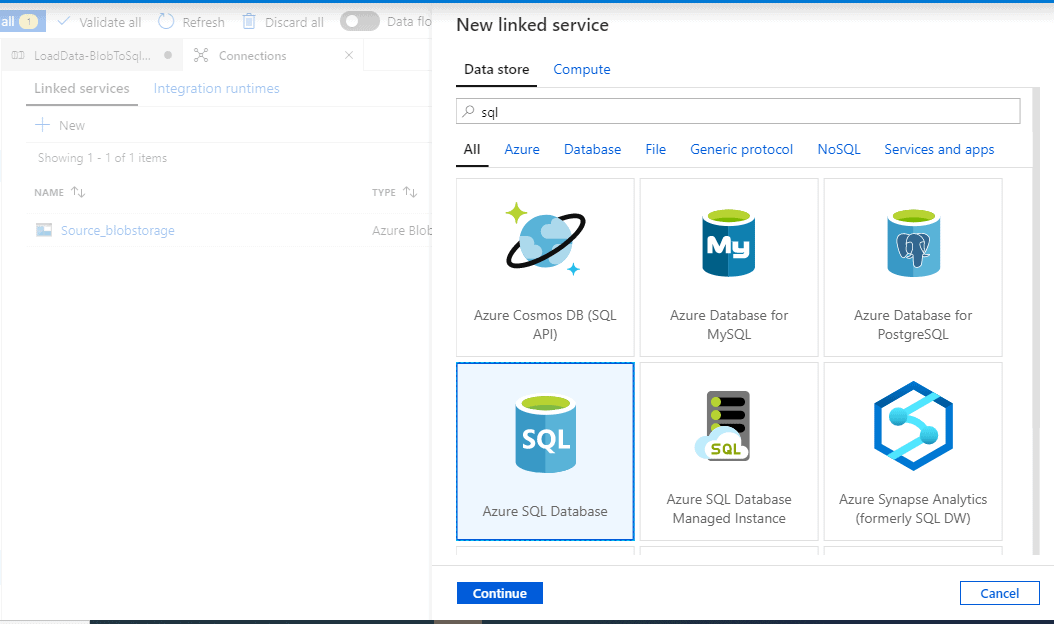
Destination linked service: Just as we created the source, click on the ‘Connection’ tab and Select ‘+New’.This time search for 'SQL' and select ‘Azure SQL Database’. Click ‘Continue’
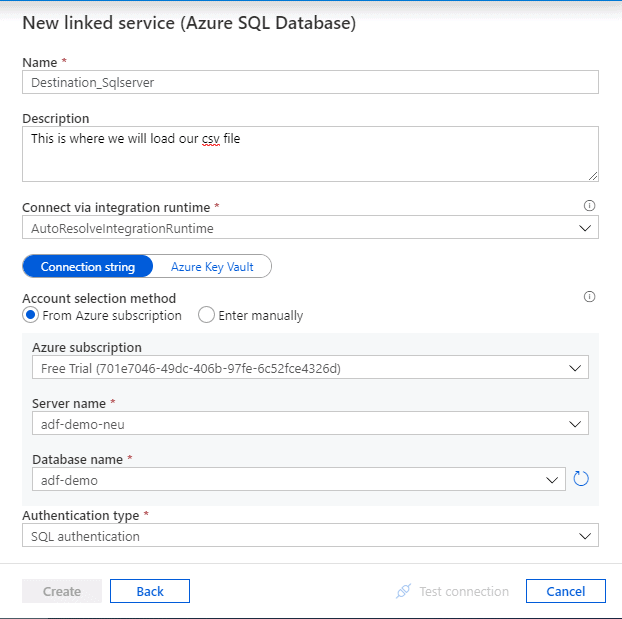
Provide a convenient name for the destination data store and enter the details of our demo SQL database and test connection.
- Server name: adf-demo-neu
- Database name: adf-demo (Blank database with the table created in Step 1)
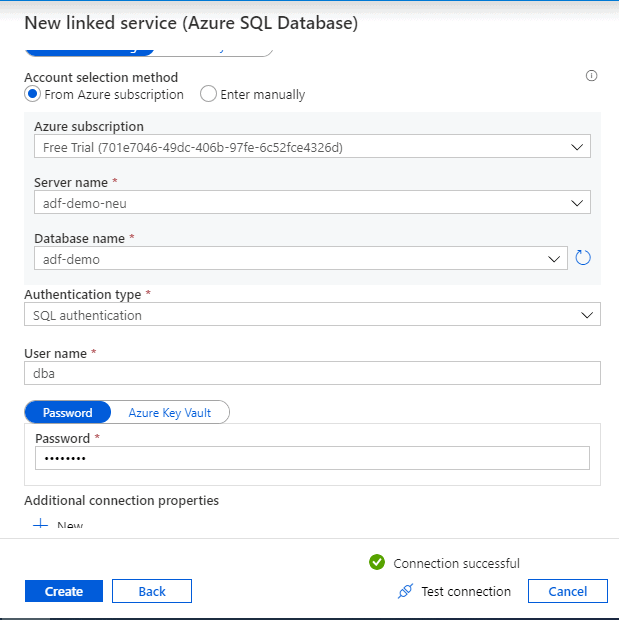
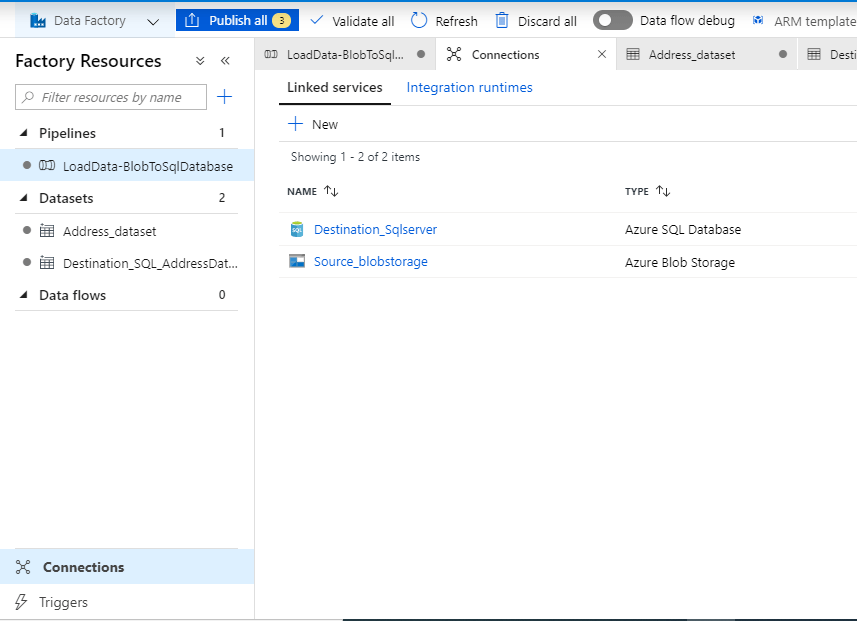
Now we have both the Linked services ready to be used.
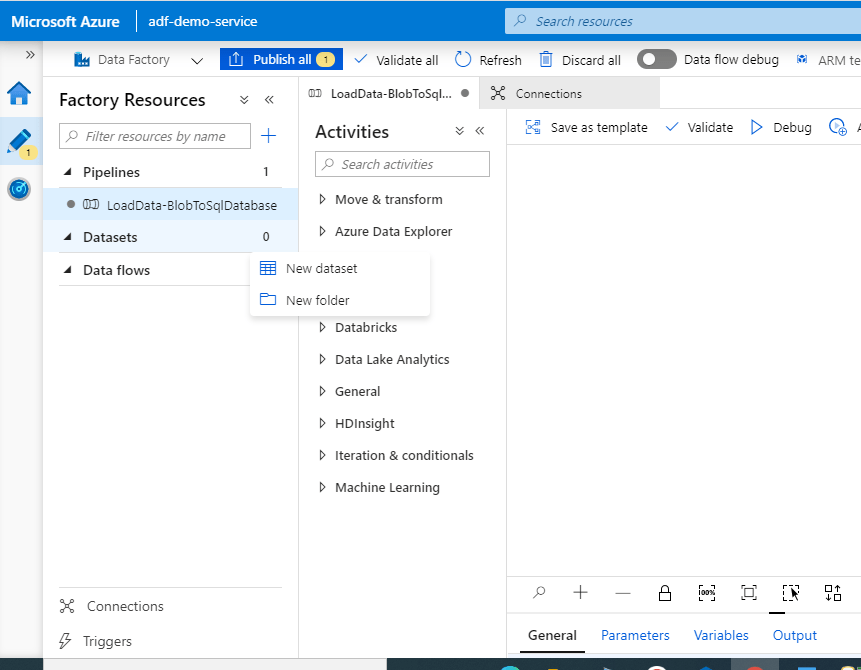
Creating the Datasets
Go to the ‘Datasets’ tab, click on the ellipsis and select ‘New dataset’
Source dataset
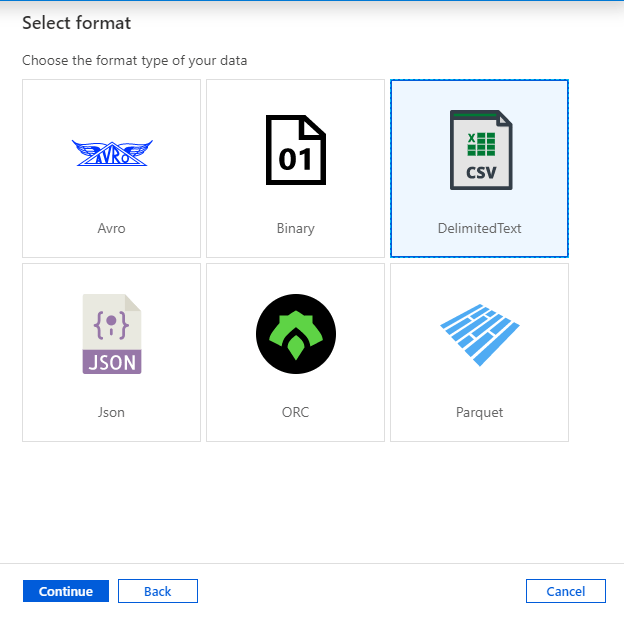
Search for blob and select ‘Azure Blob Storage’.
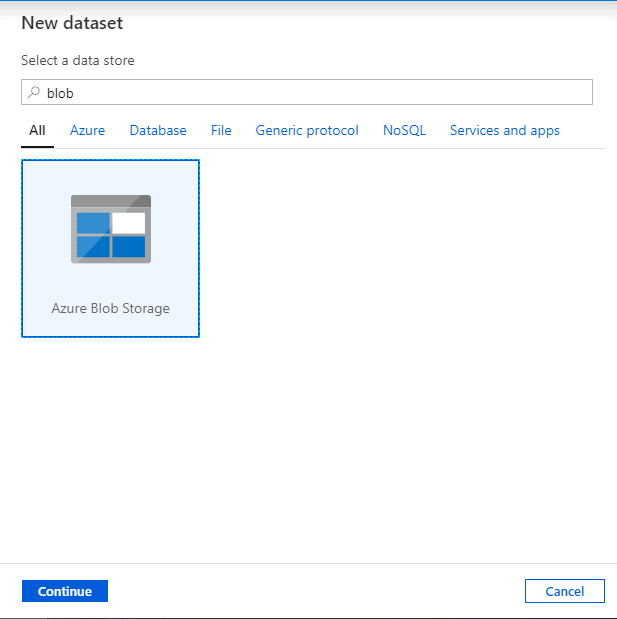
Select Format as ‘DelimitedText’ (csv) and continue
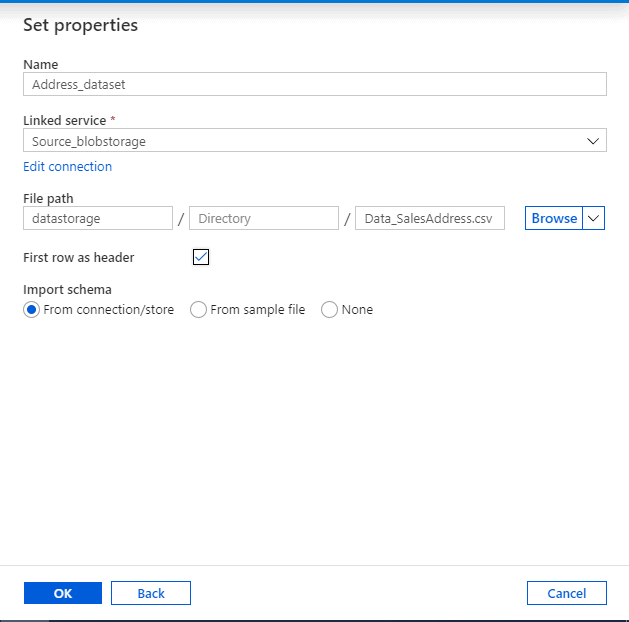
Now we need to set properties to point to the csv file we had uploaded earlier and click ‘OK’
- Name: Address_dataset (Any name)
- Linked service: Source_blobstorage ( The source linked service created earlier)
- File path: Use the browse button or enter manually
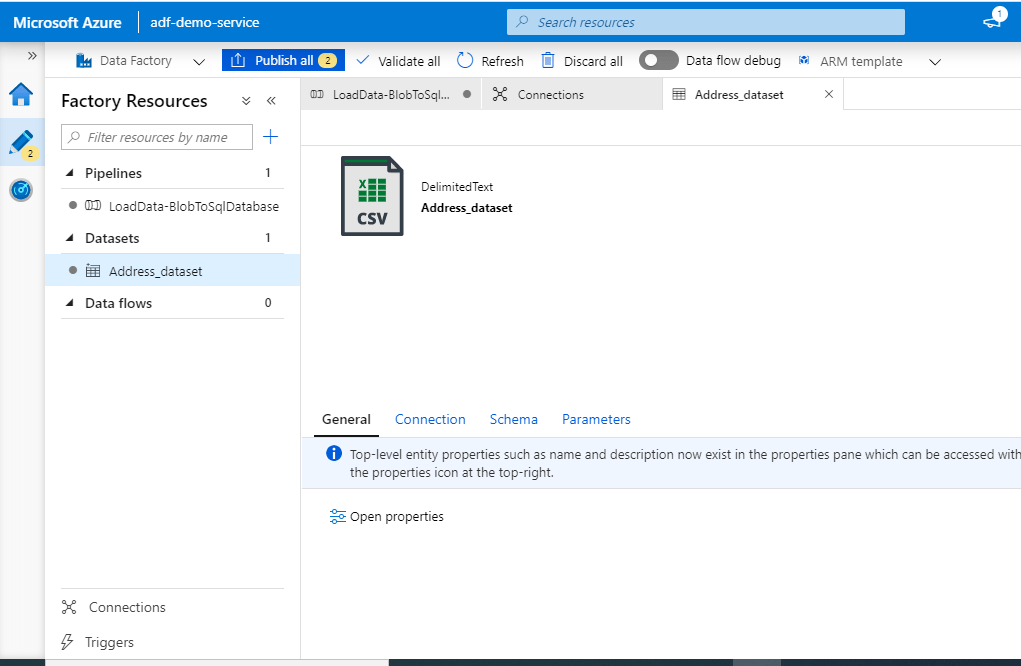
Source Dataset is now ready to be utilised later.
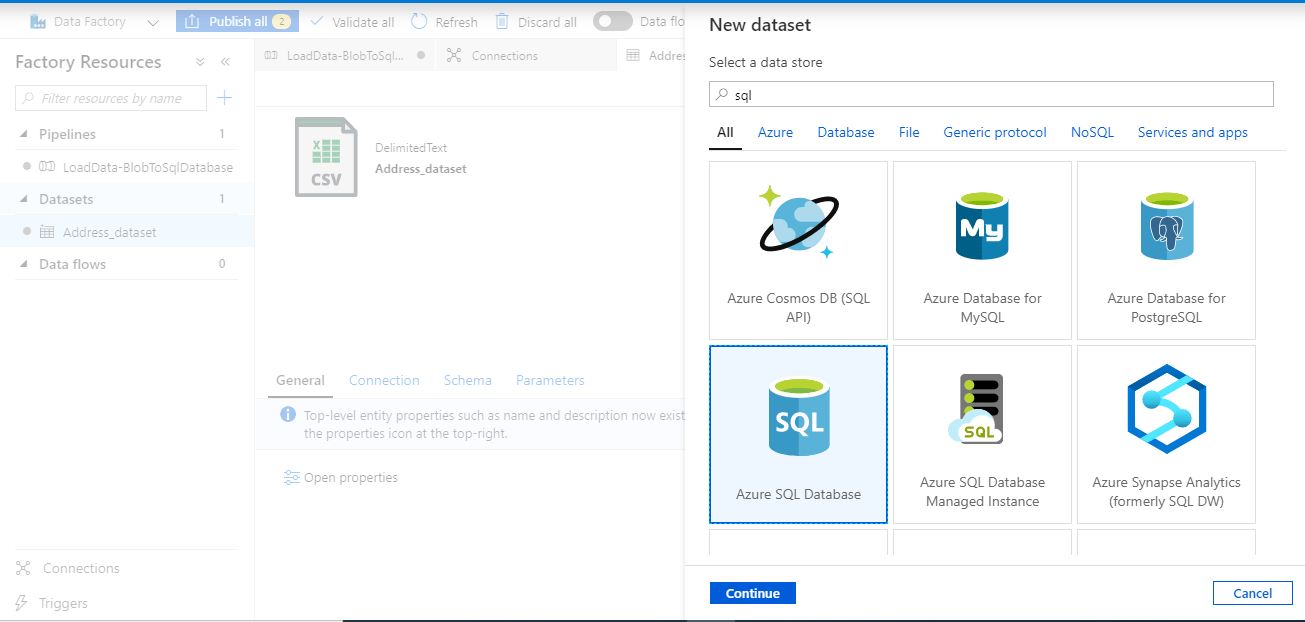
Creating destination or Sink Dataset
Go to the ‘Datasets’ tab, click on the ellipsis and select ‘New dataset’. Search for ‘sql’ and select ‘Azure SQL Database’.
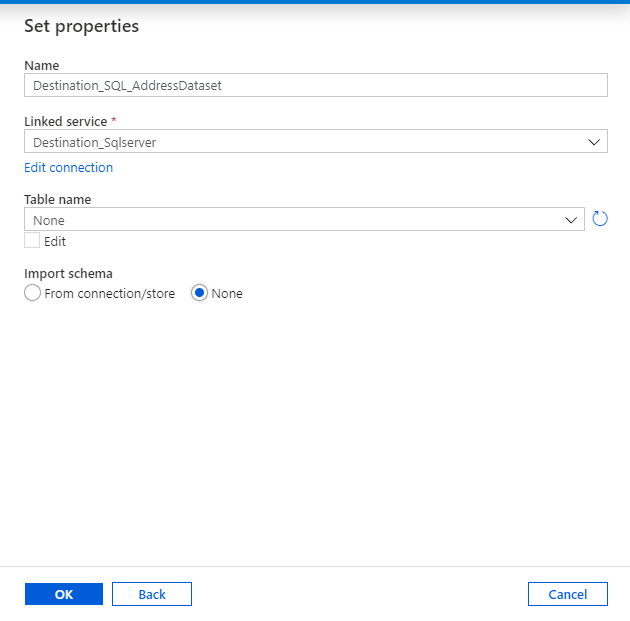
Set properties for the Sink dataset (destination).
- Name: Destination_SQL_AddressDataset (Any name)
- Linked service: Destination_Sqlserver ( The one we had created earlier)
- Table name: dbo.Address ( The blank table which we had created earlier from the script)
Click on the ‘Destination_SQL_AddressDataset’ and Test connection.
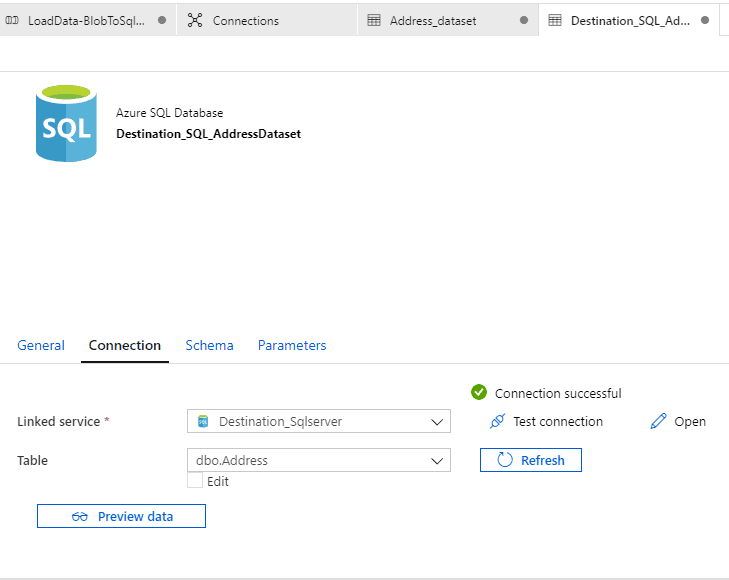
The source and sink are ready now.
Creating the data pipeline
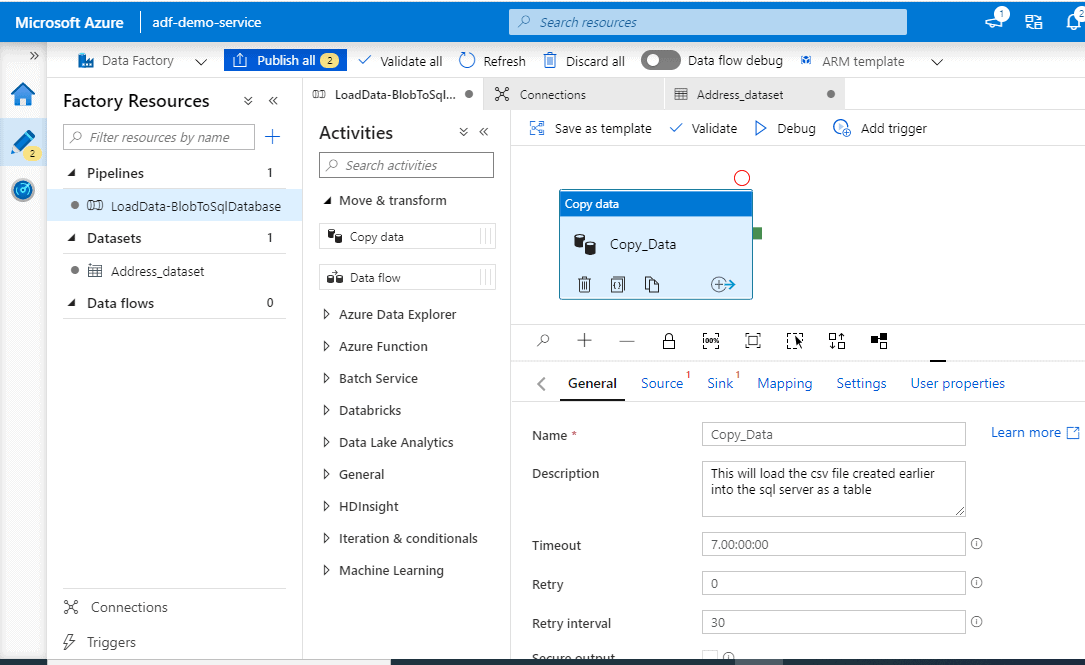
Go to the blank pipeline created earlier. In the Activities tool box, expand the Move and Transform category, and drag and drop the Copy Data activity from the tool box to the pipeline designer surface.
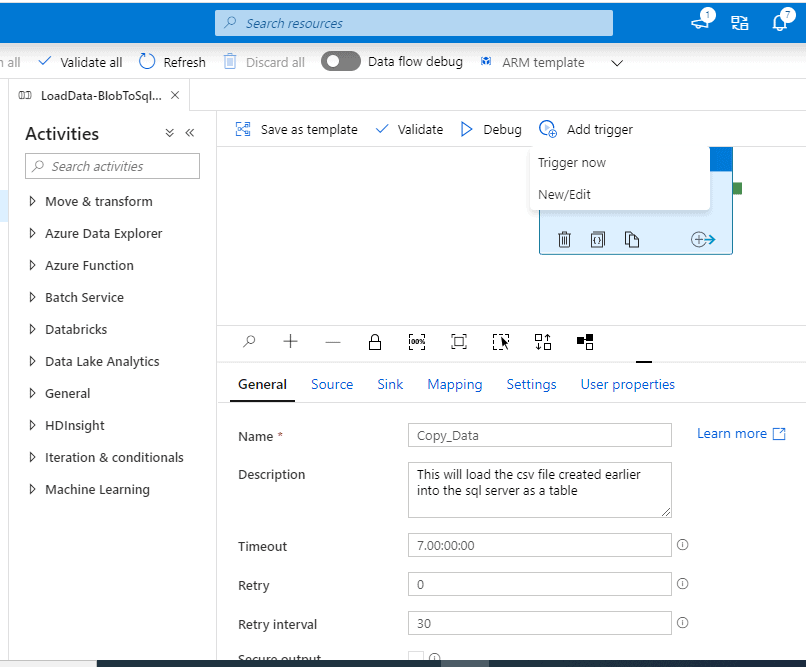
Configuring the Copy data activity
On the General tab, provide a name for the activity. In my case, I left it as ‘Copy data’.
Source
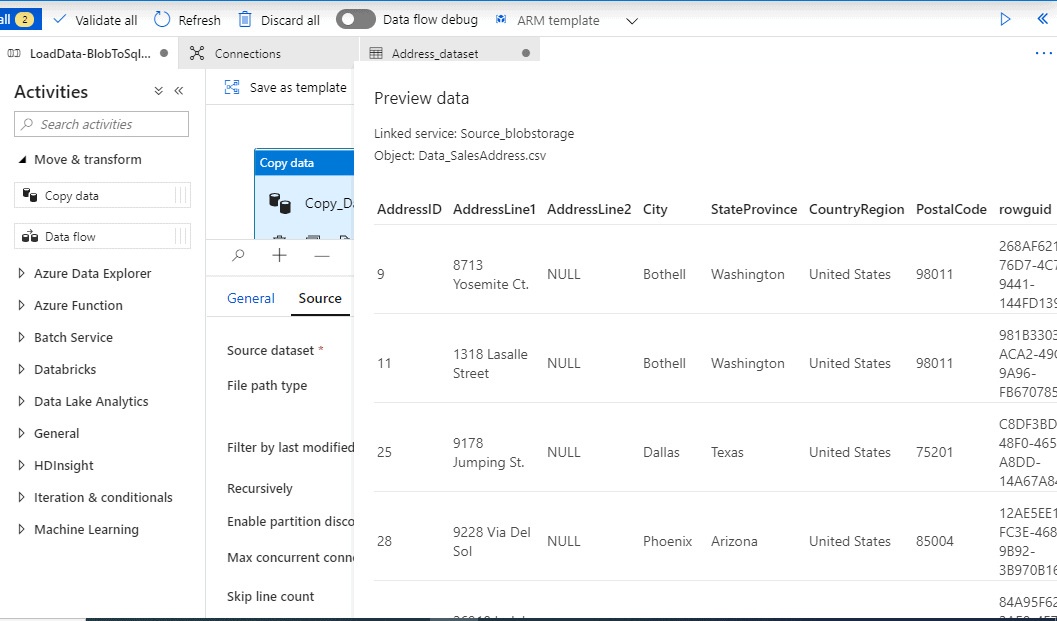
Click the drop down and select our source dataset which is ‘Address_dataset’. Click ‘ Preview data’
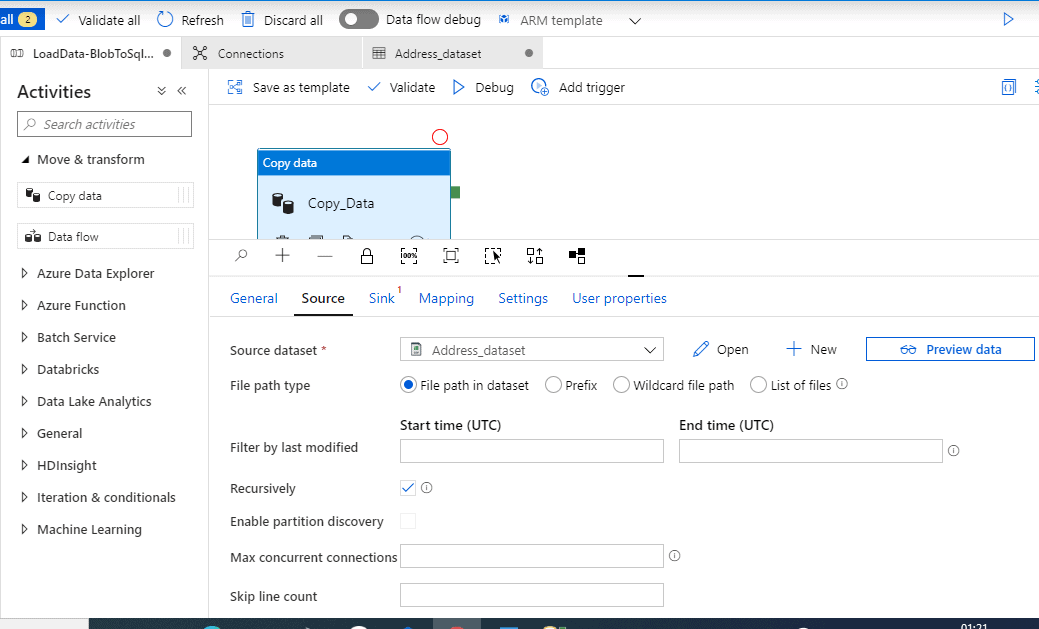
The data is visible which completes our Source configuration.
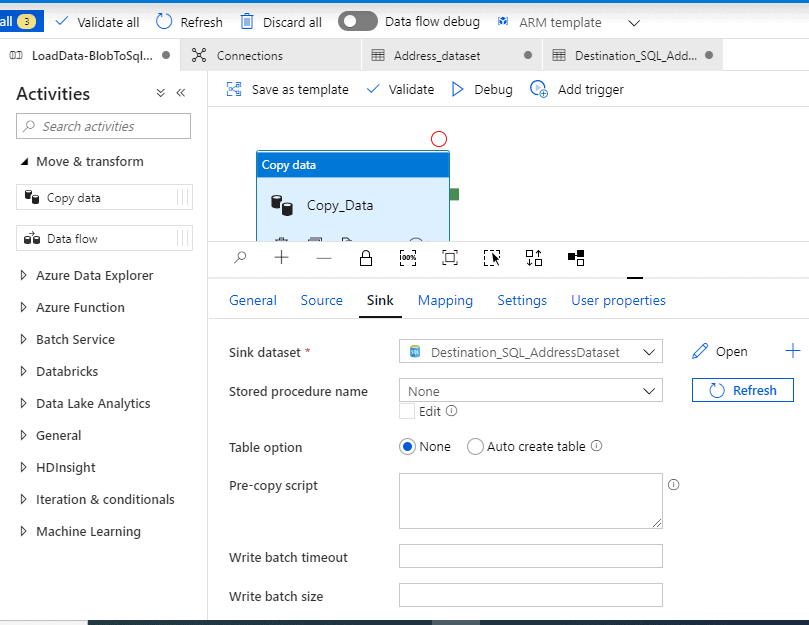
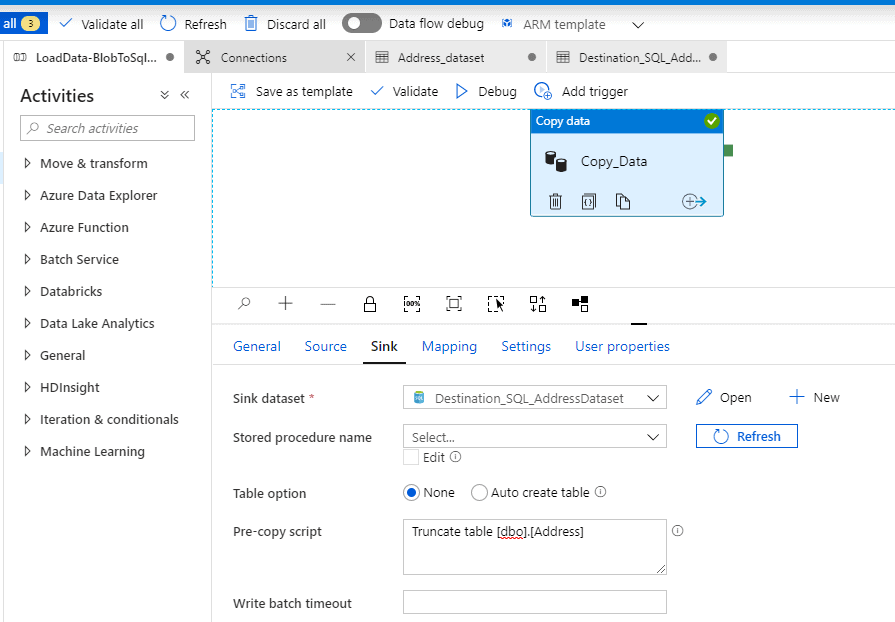
Sink (Destination/Target)
Click the drop down and select the destination dataset we had created earlier.
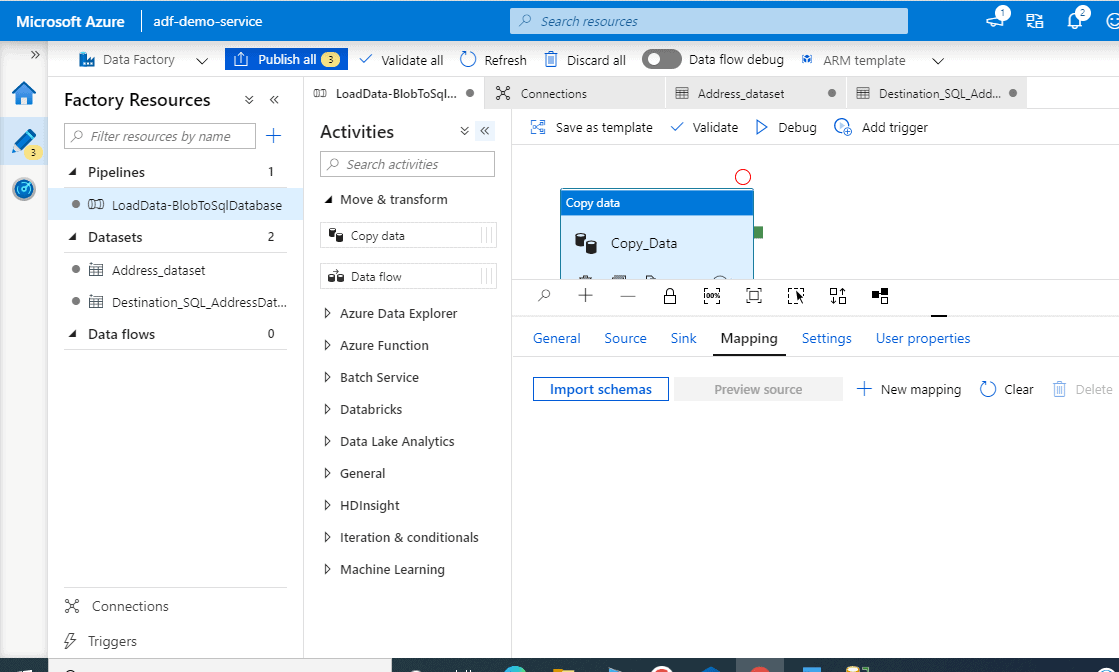
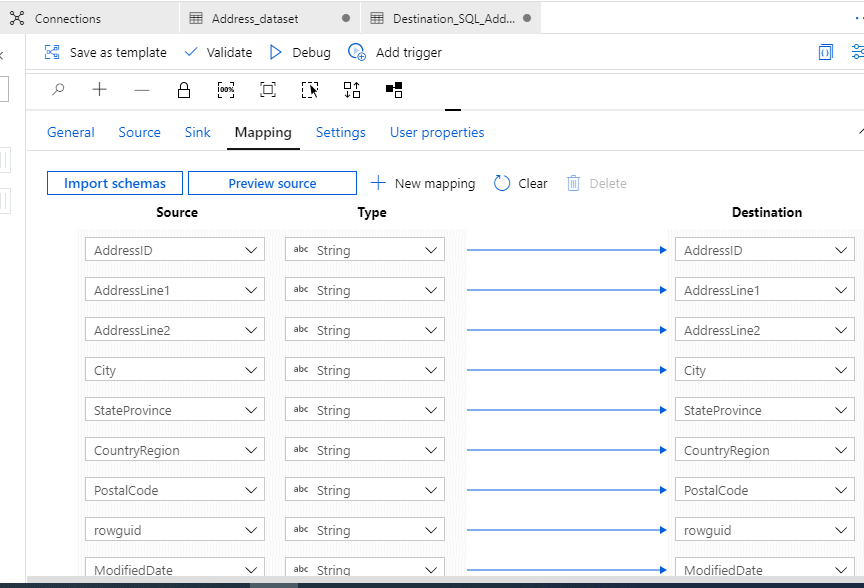
Mapping
Click on Import schemas. This will give you a very quick mapping information. You can play around with it to know more about the mapping. However, we will proceed as we are happy with it.
We will leave the ‘Settings; and ‘User properties’ as is.
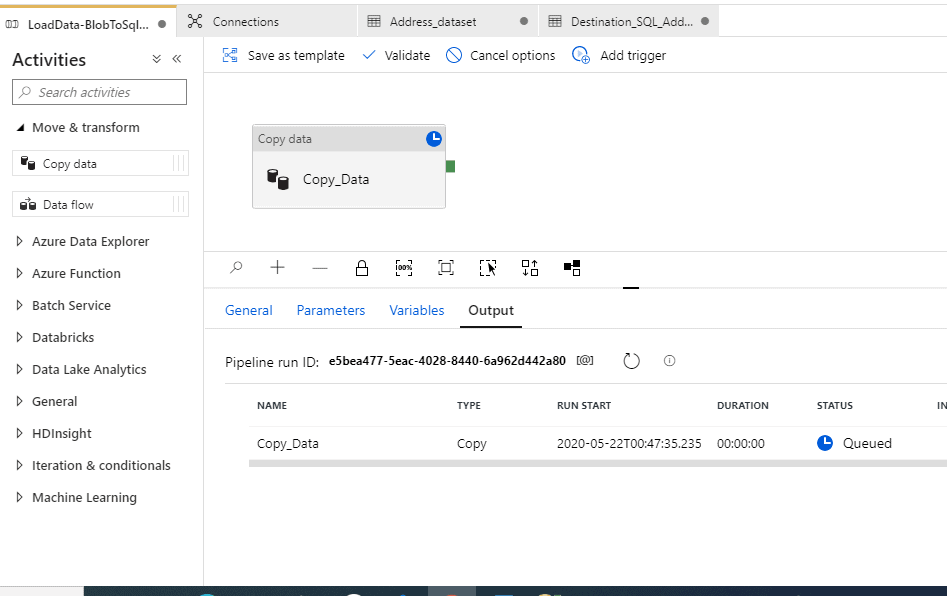
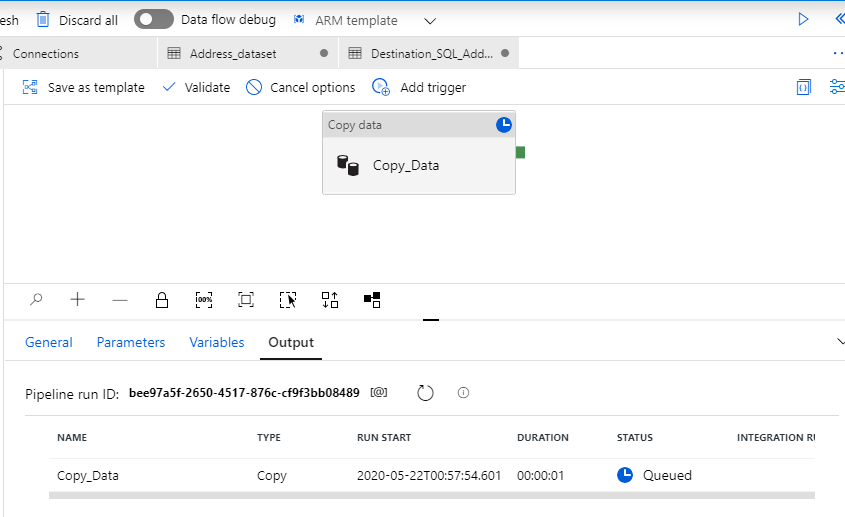
Debugging the pipeline.
To debug the pipeline, select Debug on the toolbar. You see the status of the pipeline run in the Output tab at the bottom of the window.
The debug completed successfully.
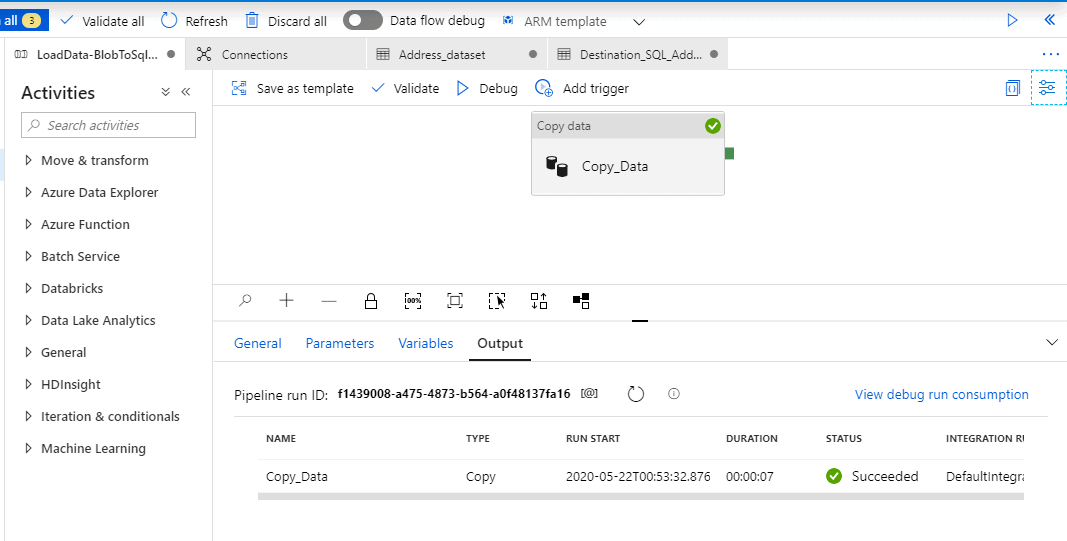
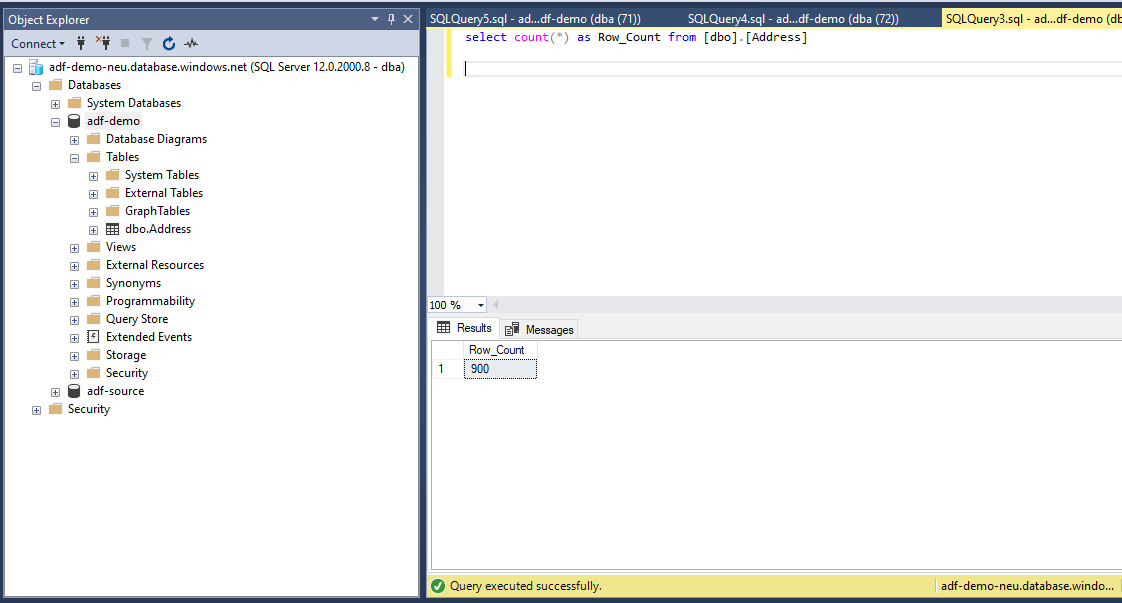
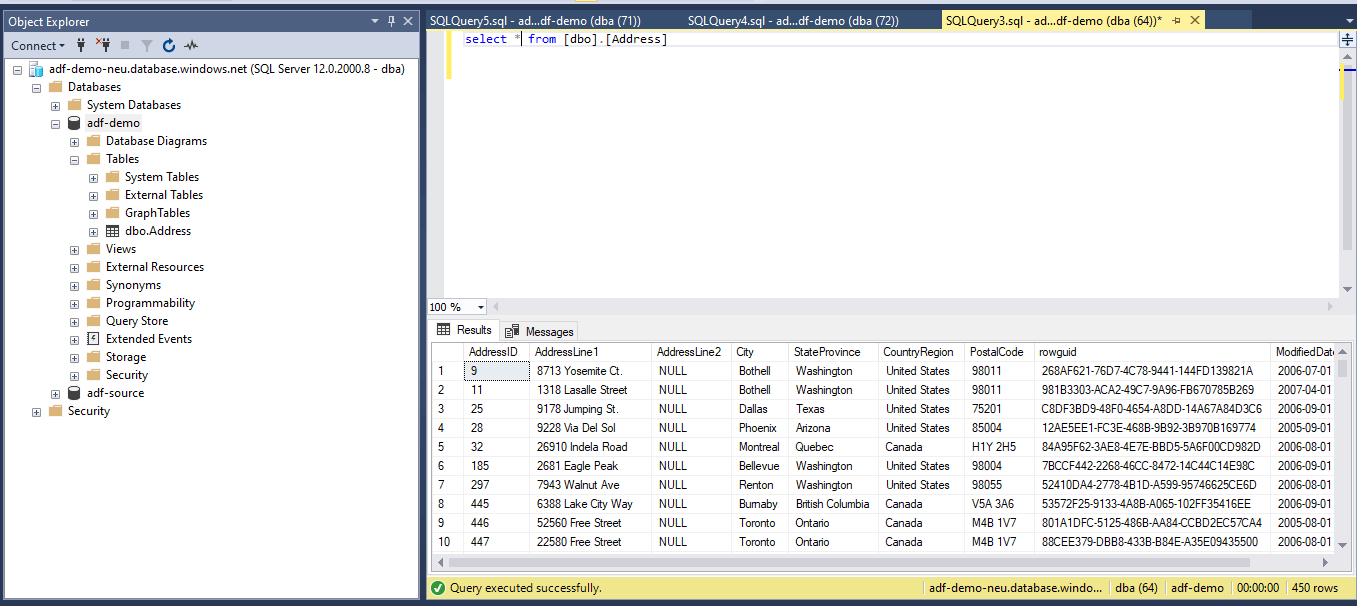
A quick ‘Select count(*) from dbo.Address’ will show us that the data copy was indeed successful.

Debugging Again will push the same 450 records again into the SQL table.
So now we have 900 records in the table. This isn’t good, how can we fix it in a way that we do not have redundant data.
Go to the Sink properties and select the ‘Pre-copy Script’ . This is such a cool thing; you can use this to run a script prior to the pipeline execution. So, what I will do is truncate the table before pulling new records .
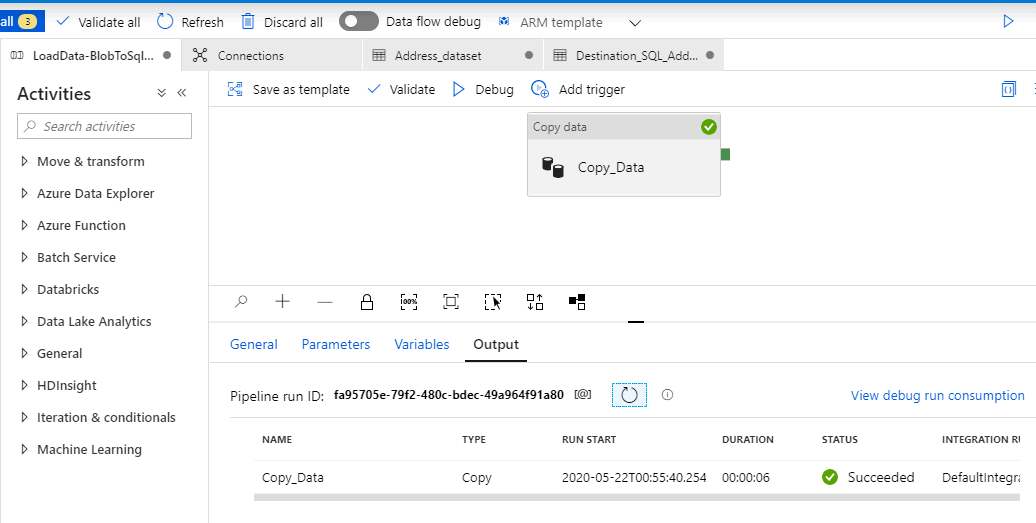
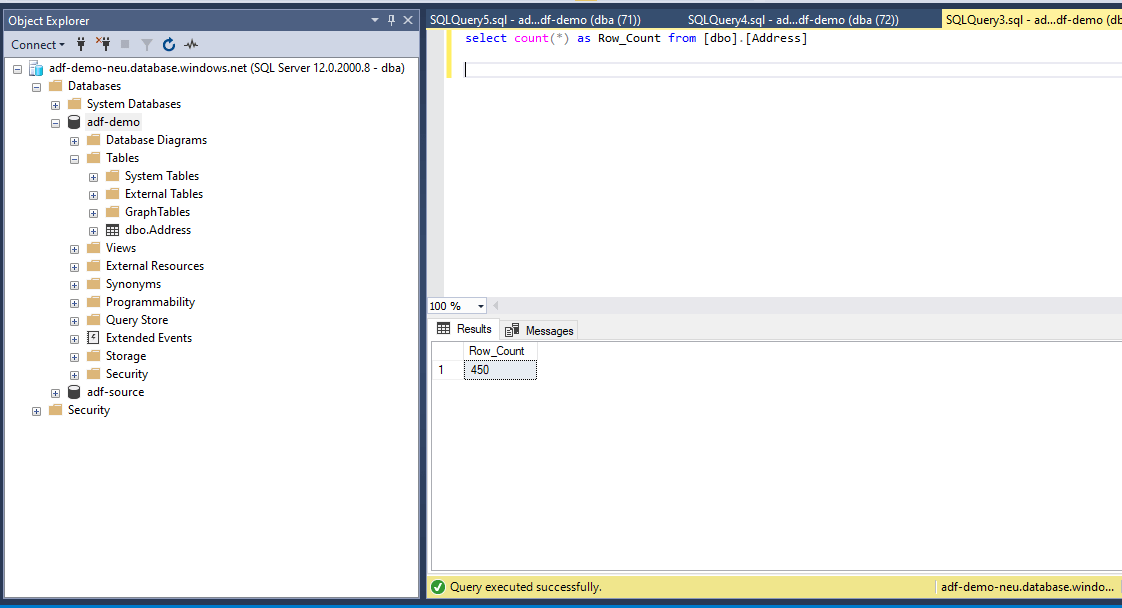
‘Truncate table dbo.Address’ will do the job for us. Let’s test it by debugging again.
Voila! Now we are back to the 450 records. The ‘pre-copy script’ did the job.
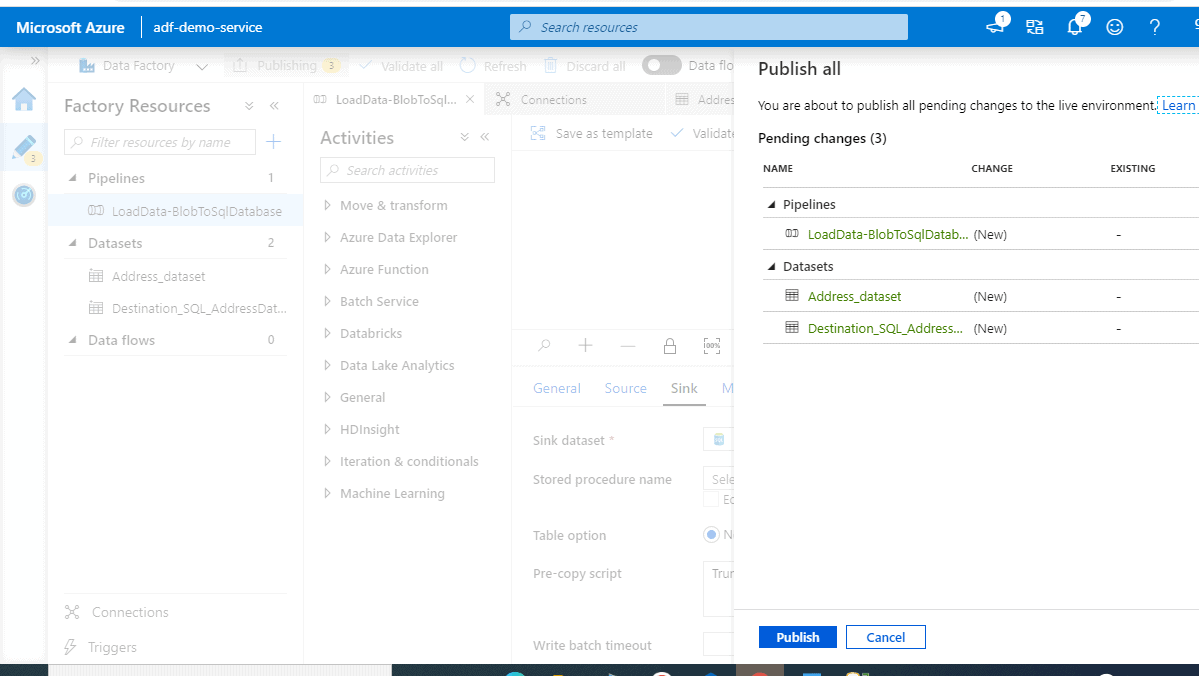
Publishing the Pipeline
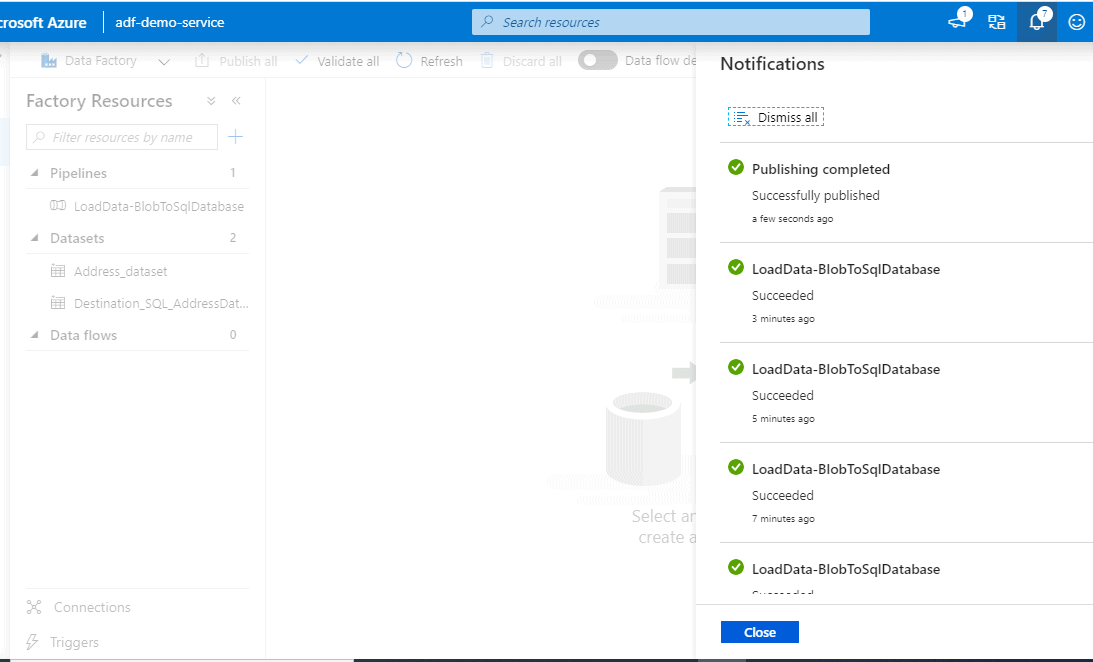
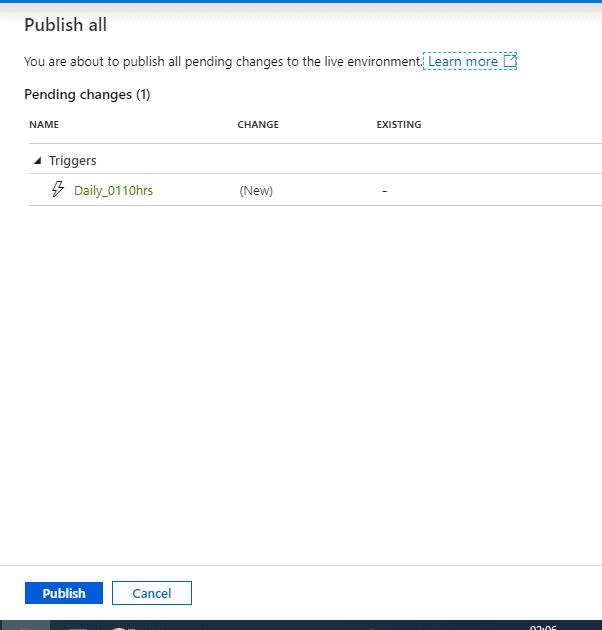
Now that we have tested it quite well, let’s publish it. In the top toolbar, select Publish all. This action publishes entities (datasets, and pipelines) you created to Data Factory. Wait until you see the Successfully published message.
Triggering the pipeline.
We have 2 options either to Trigger now or ‘New/Edit’. The Trigger now will kick off the pipeline immediately while ‘New/Edit’ will let us schedule the run.
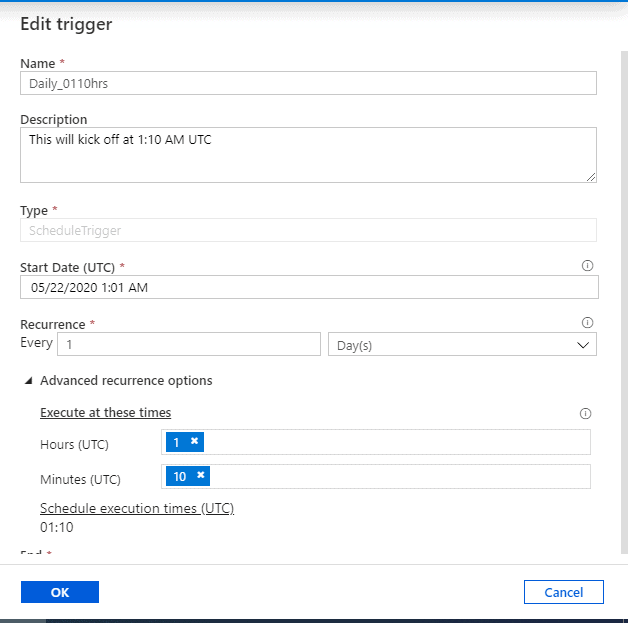
- Scheduling the trigger
Let me schedule the trigger to kick off the pipeline at 01:10 hours UTC.
Note: The time is in UTC.
Click ‘OK’ and Publish.
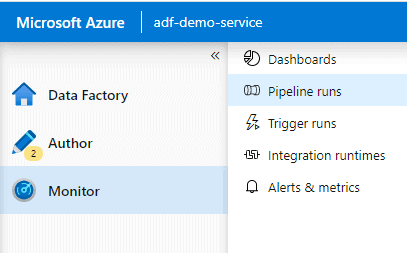
Monitor
You have the 5 options shown here:
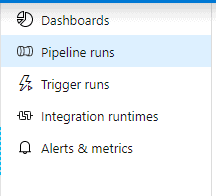
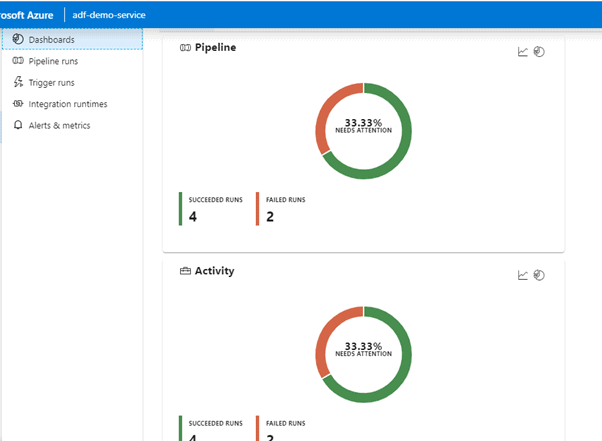
Dashboards: Overall stats of all pipeline/activity/trigger runs.
Pipeline runs: All the runs of the pipelines created in your ADF.
Trigger runs: All scheduled trigger runs.
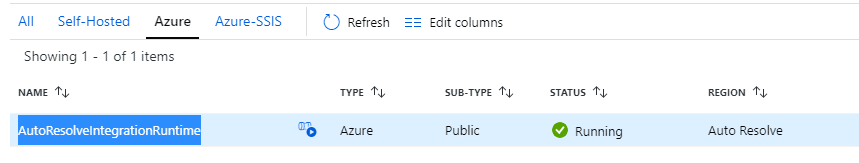
Integration runtimes: The Integration Runtime (IR) is the compute infrastructure used by Azure Data Factory to provide the following data integration capabilities across different network environments. There are three tabs: Self-hosted IR, Azure (AutoResolveIntegrationRuntime) and Azure-SSIS. It will show you the status of your IR and give you option to Start-Stop the IR you create. Please go through this link for more information on IR.
Alerts & metrics: We can monitor and set-up alerts for our pipelines.
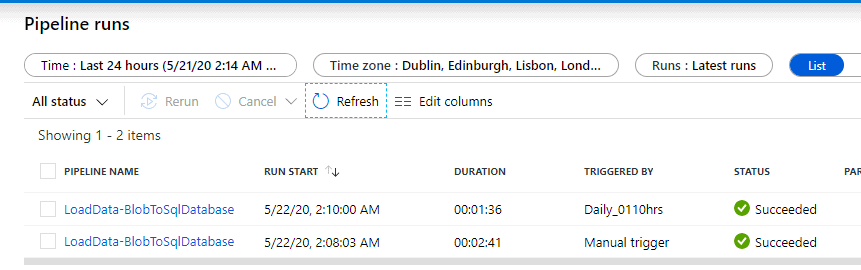
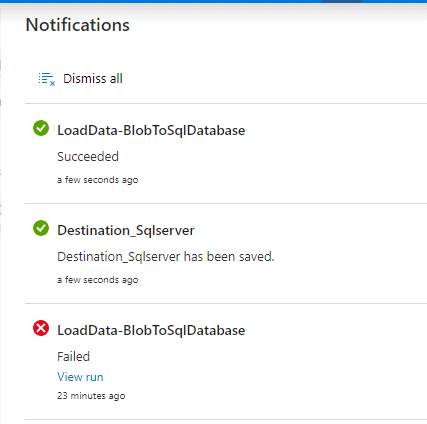
Now coming back to our pipeline. Go to the Monitor tab on the left. You can use links under the PIPELINE NAME column to view activity details and to rerun the pipeline. You can see the Duration, Triggered By, Status and other details. After a while I went back to the Monitor to check and could see the Scheduled trigger had kicked off and was in progress.
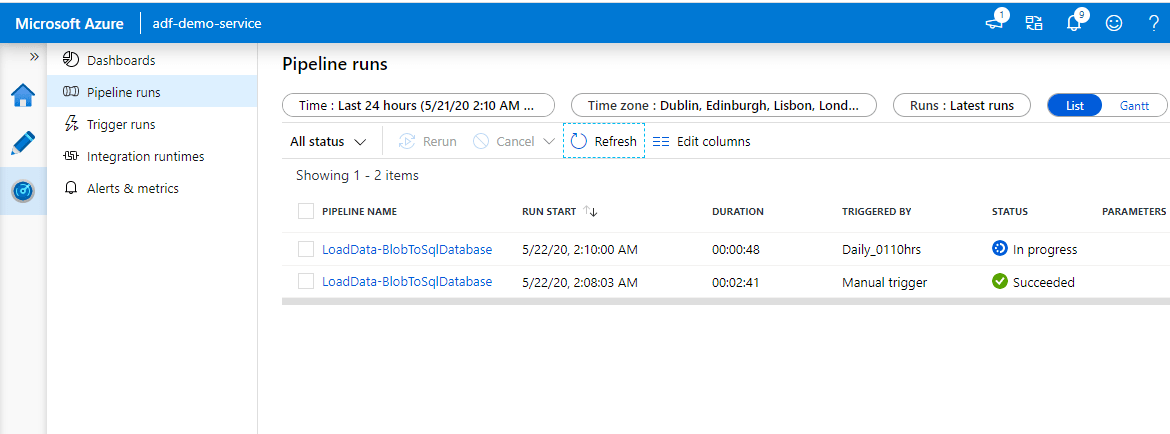
Both the manual and the scheduled runs were successful.
Cross checking the data in the sink. We have the same 450 records.
Let's set-up an alert for our pipeline. Go to the Alerts & metrics and click New alert rule.
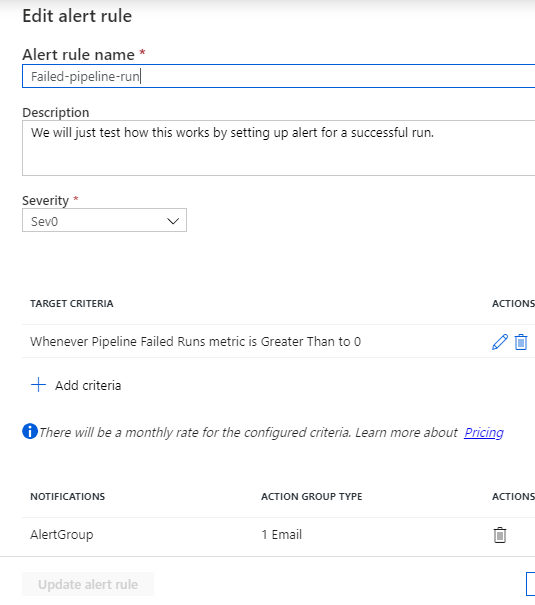
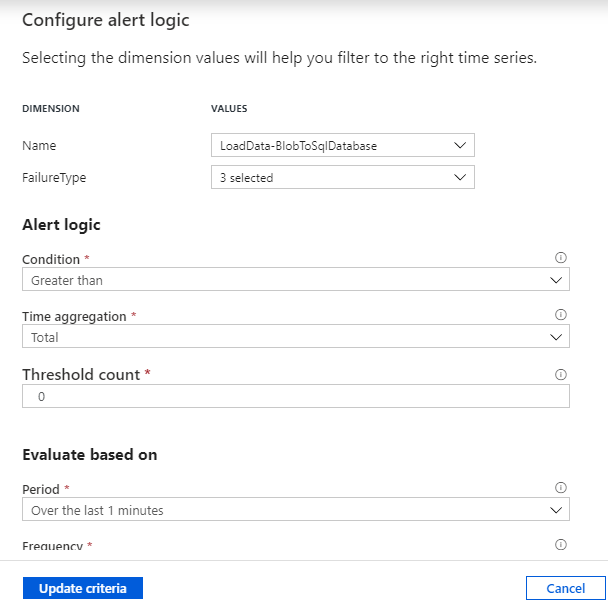
Select the target data factory metric for which you want to be alerted. We will set-up an alert for Failed pipeline run which will send us an email notification and then Select the dimension values so it could filter on the right time series. Here the dimensions are pipeline name and failure type. These dimensions vary for each data factory metrics.
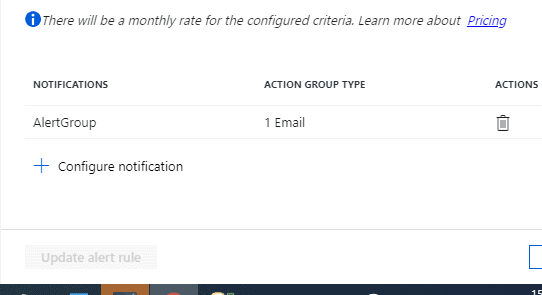
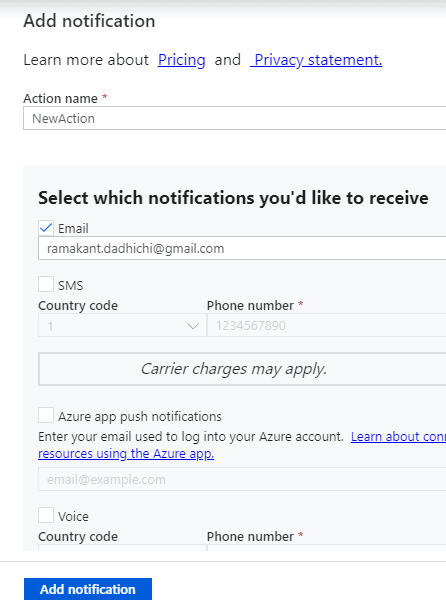
Added a Notification configuration that will send email to an action group.
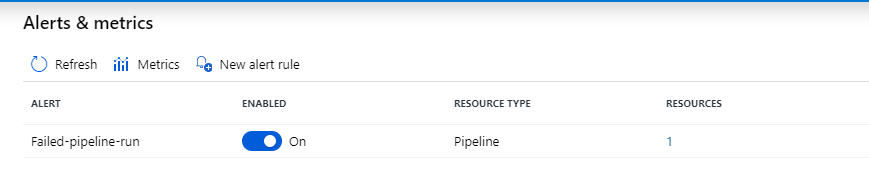
The created Alert can be viewed in Alerts & metrics. Now we will test this by making the pipeline run to fail. I keyed in wrong password in Sink ‘SQL Database’ credential in the Linked Service. As a result, the connection failed along with the pipeline run.
Let's trigger a Manual Pipeline run from the Pipeline runs tab in Monitor.
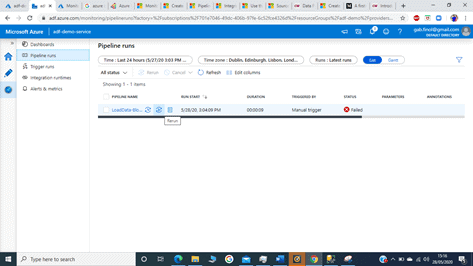
The run Failed as expected with below error:
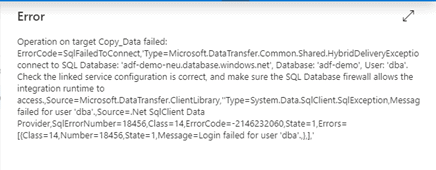
The Alert rule should trigger an email notification. Logged in into the Gmail account and found Failed pipeline alert email.
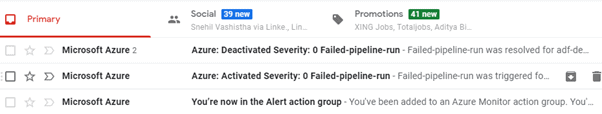
The alert looks like below:
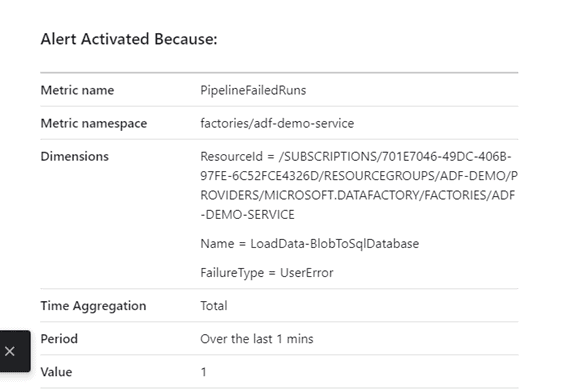
Let’s go back and correct the change we made in the Sink Linked Service and re-run if needed. We are back to business.
The Dashboards in ‘Monitor’ will show you overall graphical statistics of the pipeline/Activity/Trigger runs and we can see that we have around 33.33% Failed run.
Conclusion
We have successfully created our first data pipeline with Azure Data Factory and loaded data from a csv file into an Azure SQL database. We have learnt how to:
- Create a data factory.
- Create a pipeline with a copy activity.
- Test run the pipeline.
- Trigger the pipeline manually.
- Trigger the pipeline on a schedule.
- Monitor the pipeline and activity runs.