

Introduction
In this article, we will discuss the pricing of the Azure data factory data pipeline. It will be helpful to understand how each component affects billing in the data factory pipeline. There are many components or small activity which affects the overall cost of the Azure data factory. For example, if we perform a connectivity test in the pipeline dataset then it incurs some costs.
Azure Data Factory Pipeline pricing is calculated based on three categories below:
- Pipeline orchestration and execution.
- Data flow execution and debugging.
- Number of Data Factory operations such as create pipelines and pipeline monitoring.
We will discuss more on these three categories.
Pipeline orchestration and execution
We need to pay data pipeline orchestration by activity runs and activity executions by integration runtime hours. Integration runtime charges are prorated by the minute and rounded up.
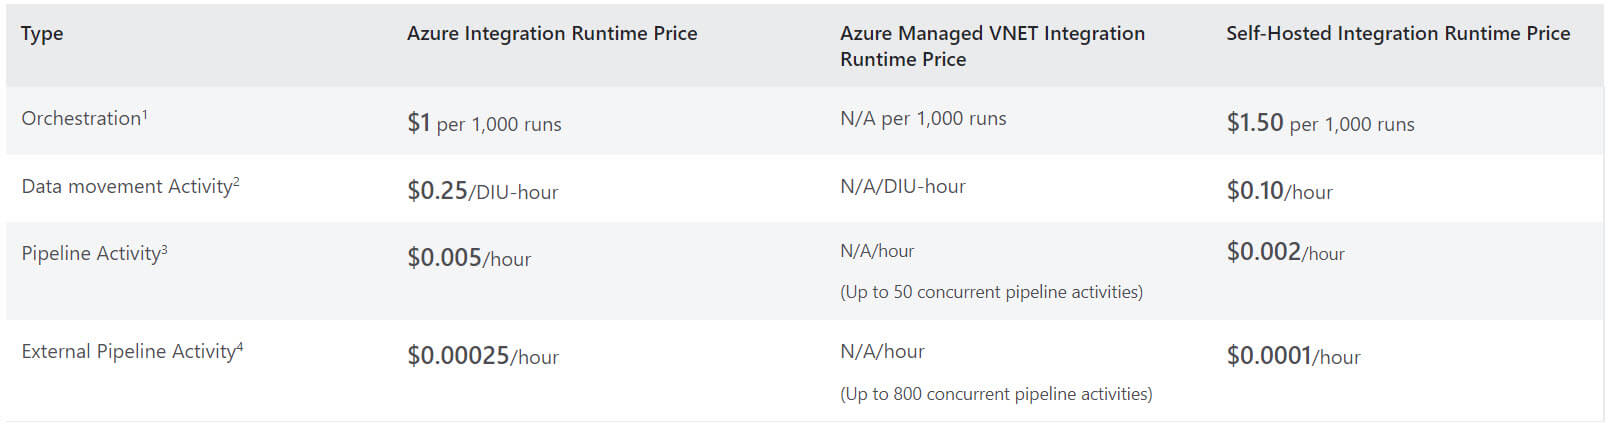
There are four categories in pipeline orchestration and execution:
- Orchestration - means activity runs, trigger executions, and debug runs.
- Data movement activity - The Azure copy data activity can move data across various data stores, as the data volume increases, the integration run time can be scaled to meet the needs. While using copy activity if we copy data out of the data center, it will incur additional bandwidth charges which will show up separately in the bill as outbound data charges.
- Pipeline Activity - Pipeline activities include Lookup, Get Metadata, Delete and schema operations during authoring (test connection, browse folder list, get schema and preview data)
- External Pipeline Activity - External activities include stored procedures, Data Lake Analytics U-SQL activity and many more.
Data Flow Execution and Debugging
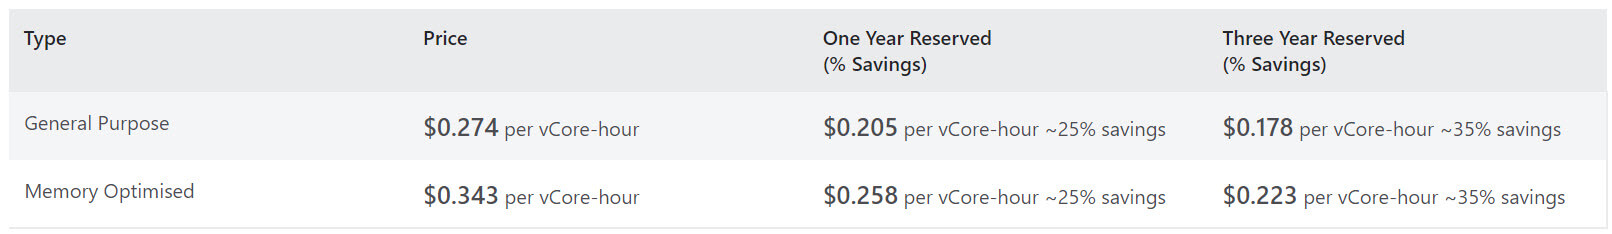
We can design data flow transformations inside the pipeline. We need to pay for only data flow cluster execution and debugging time per vCore-hour. Execution and debugging charges are prorated by the minute and rounded up. There are two types of vCore available:
- General Purpose - Best for the most common business workload that requires balanced compute and memory with scalable I/O throughput.
- Memory Optimised - For high-performance workloads for faster processing and high throughput.
Data Factory Operations
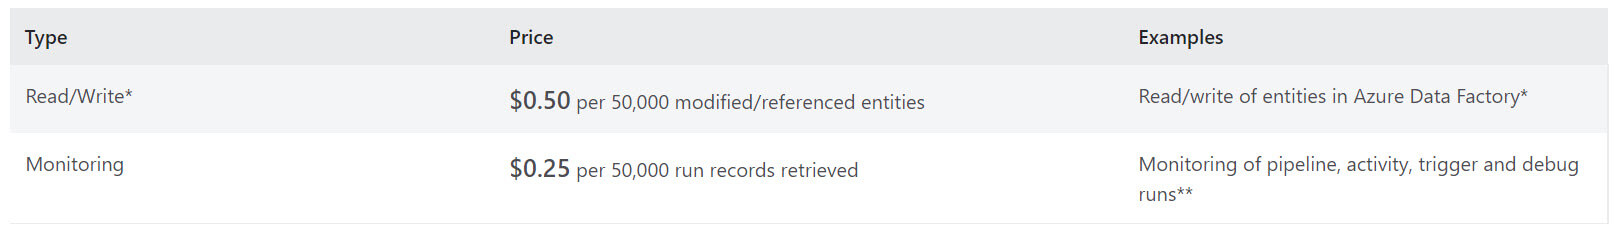
Data Factory Operations includes read, write and monitoring.
- Read/Write - Operations include create, read, update and delete for datasets, linked services, pipelines, integration runtime
- Monitoring - It includes pipeline, activity, trigger and debug runs.
Copy data from AWS S3 to Azure blob storage
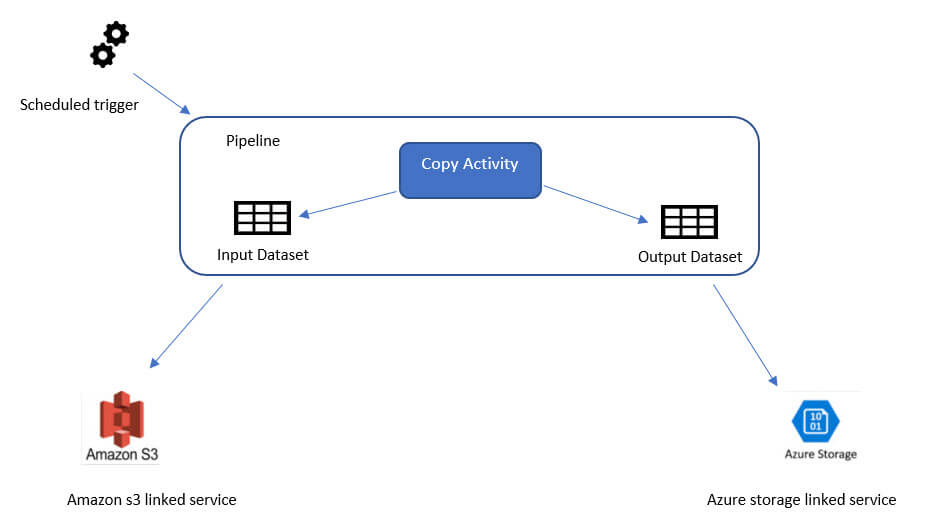
In this example, we will copy data from Amazon s3 to Azure blob storage using copy activity on an hourly schedule. To achieve the goal, we need to create the below objects:
- An input data set for the source data from Amazon S3
- A Copy activity with input from Amazon S3 and output to Azure storage.
- An output data set for the data on Azure storage.
- A schedule trigger to execute the pipeline on an hourly schedule.
The below tables provides a list of operations required to achieve the task along with types and units:
| Operations | Types and Units |
| Create Linked Service | 2 Read/Write entity |
| Create Datasets | 4 Read/Write entities (2 for dataset creation, 2 for linked service references) |
| Create Pipeline | 3 Read/Write entities (1 for pipeline creation, 2 for dataset references) |
| Get Pipeline | 1 Read/Write entity |
| Run Pipeline | 2 Activity runs (1 for trigger run, 1 for activity runs) |
| Copy Data Assumption: execution time = 10 min | 10 * 4 Azure Integration Runtime (default DIU setting = 4) |
| Monitor Pipeline Assumption: Only 1 run occurred | 2 Monitoring run records retrieved (1 for pipeline run, 1 for activity run) |
Total Scenario pricing: $0.1681
- Data Factory Operations = $0.00010
- Read/Write = 9*0.00001 = $0.00009 [1 R/W = $0.50/50000 = 0.00001]
- Monitoring = 2*0.000005 = $0.00001 [1 Monitoring = $0.25/50000 = 0.000005]
- Pipeline Orchestration & Execution = $0.168
- Activity Runs = 0.001*2 = $0.002 [1 run = $1/1000 = 0.001]
- Data Movement Activities = $0.166 (Prorated for 10 minutes of execution time. $0.25/hour on Azure Integration Runtime)
Mapping data flow debug for a normal workday
Let’s say you are designing, developing, and testing mapping data flow on pipelines every day. You log in to the ADF portal every day morning and enables debug mode for data flow. You work for 8 hours each day. The default debug session or TTL is 60 minutes. If the debug session never expires, therefore your charges for each day will be:
8 (hours) x 8 (compute-optimized cores) x $0.193 = $12.35
Let’s take another example, where you work for ETL design and development work but you do not work the entire day, only spend 1 hour each day. So, the data flow debugger is live for 1 hour each day and your charges for each day will be:
1 (hour) x 8 (general purpose cores) x $0.274 = $2.19
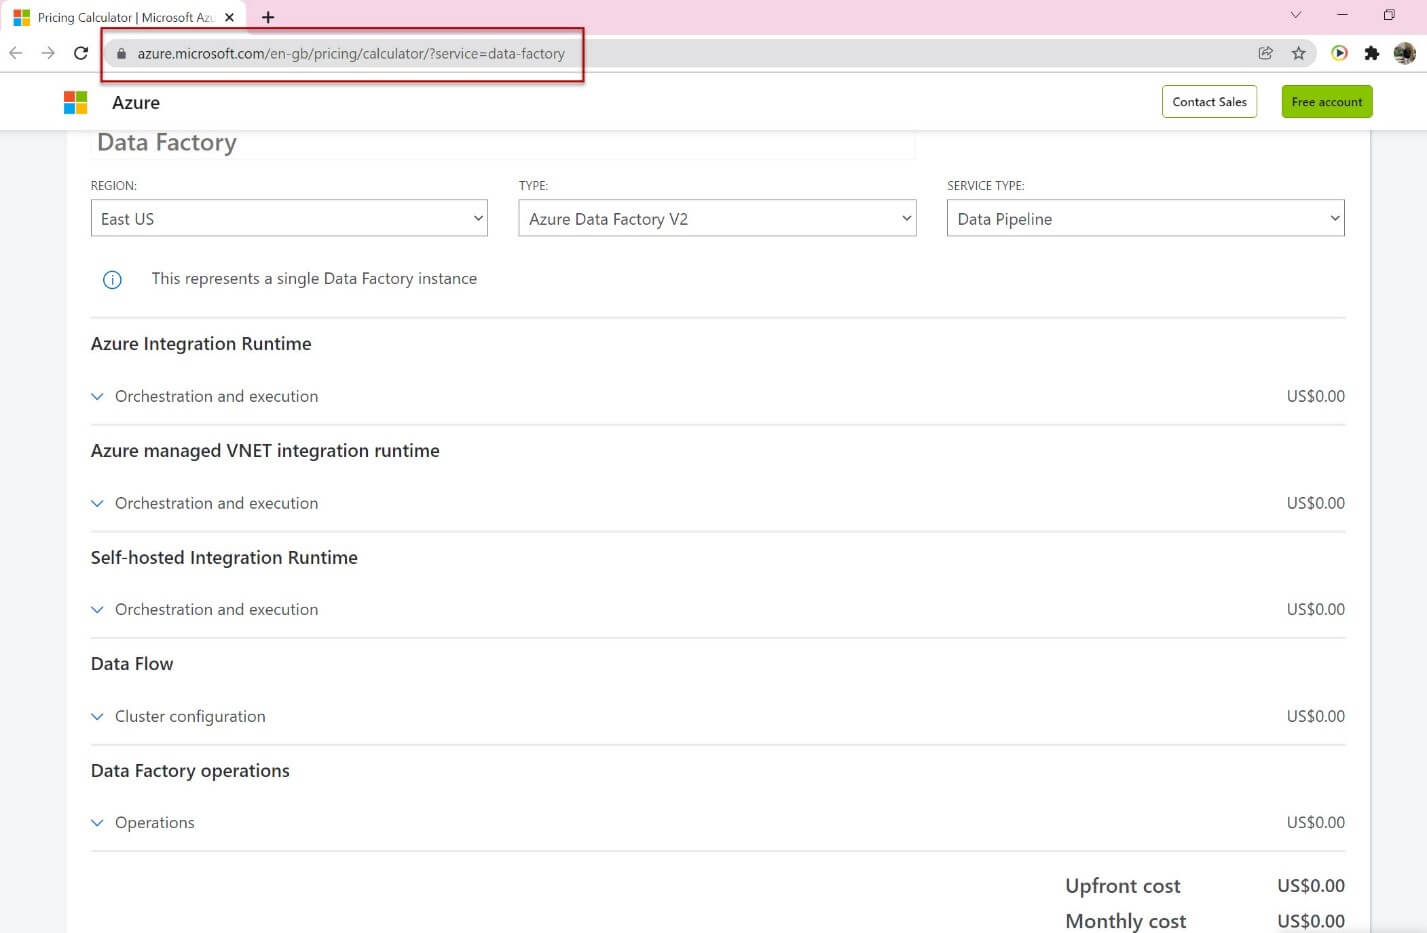
Estimate costs before using Azure Data Factory
You can use Azure Pricing Calculator to get an estimation of the pipeline running cost before using the Azure data factory. You have to provide details such as region, the number of activity runs, the number of data integration unit hours, type of compute used for Data Flow, Data Factory operations, core count, instant count, and so on.
You can try running a trial run using sample data set to understand the consumption for Azure Data Factory
Monitor consumption at the pipeline-run level
Your pipeline may contain multiple activities based on data movement and transformations need, so azure billing depends on pipeline complexity.
You can view the different amounts of consumption at each pipeline run on the azure data factory monitor page.
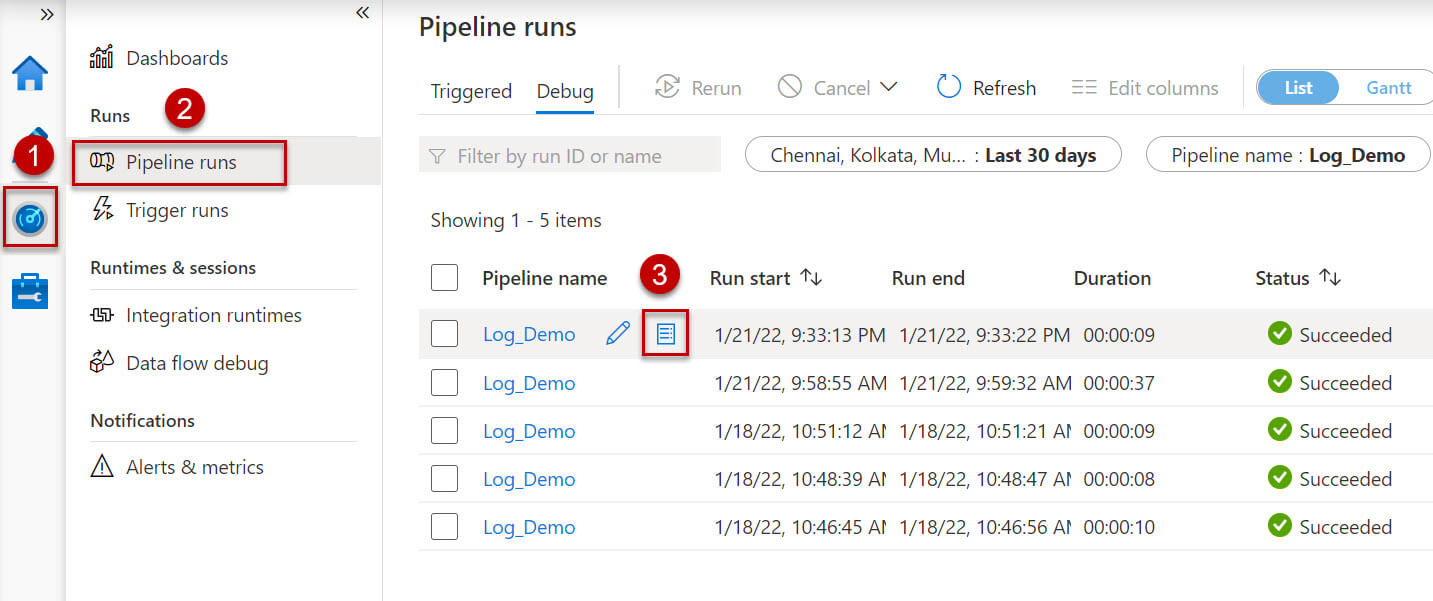
Follow the below steps to open the monitor page:
- Click on the monitor and manage tile in the azure data factory blade or click on the monitor icon on the left sidebar if you are already in ADF UX.
- The select pipeline runs.
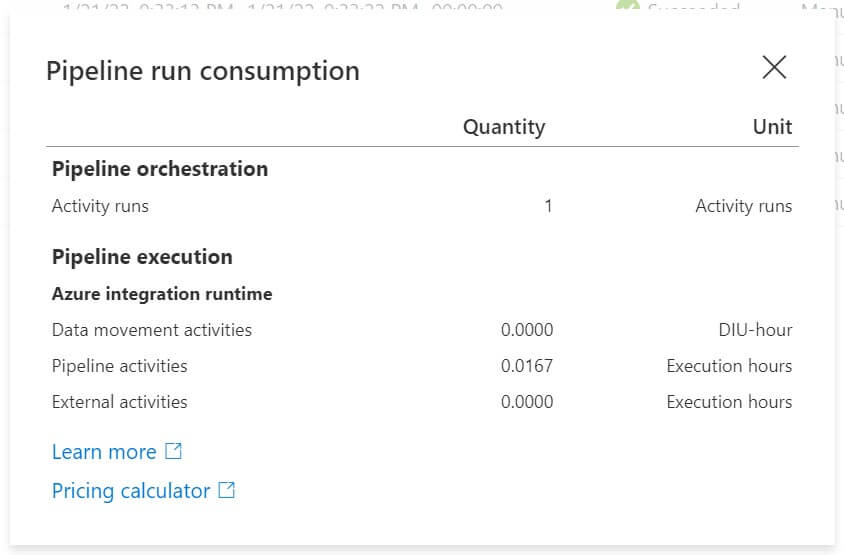
- Click on consumption button, it will open a new pop-up window that shows pipeline consumptions for all activities aggregated within the pipeline.
Monitor consumption at the activity-run level
In the above section, we discussed pipeline level azure cost, sometimes we need to find the most costly activity in the pipeline.
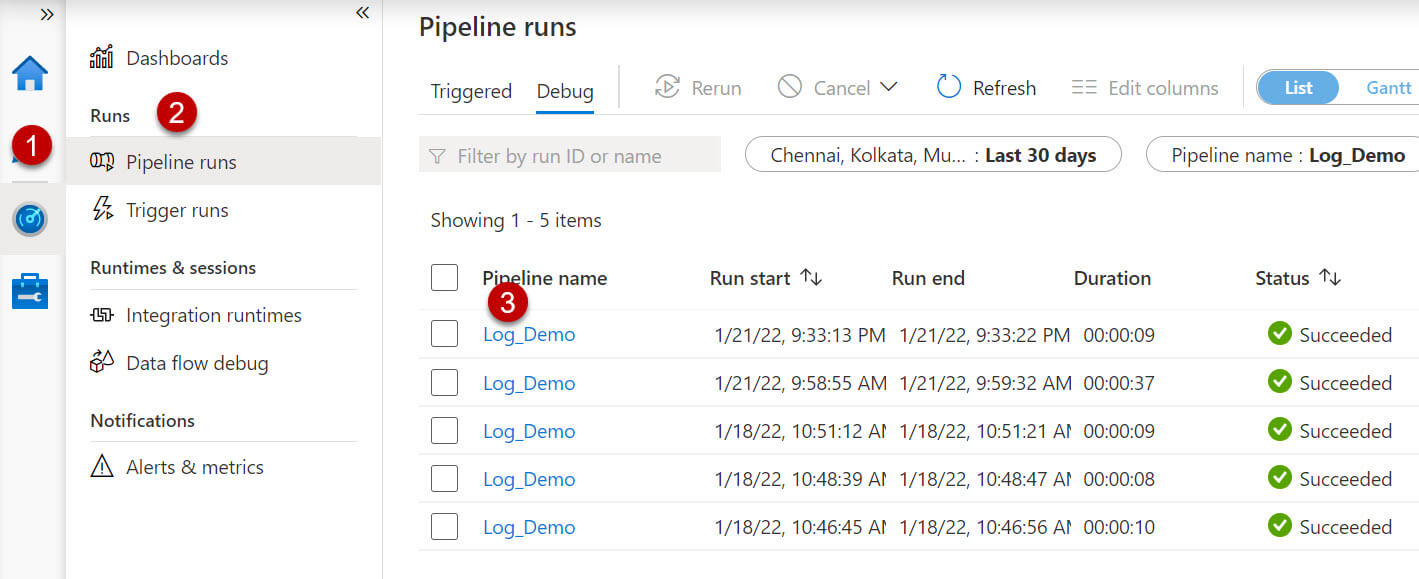
We can view consumptions at the activity level:
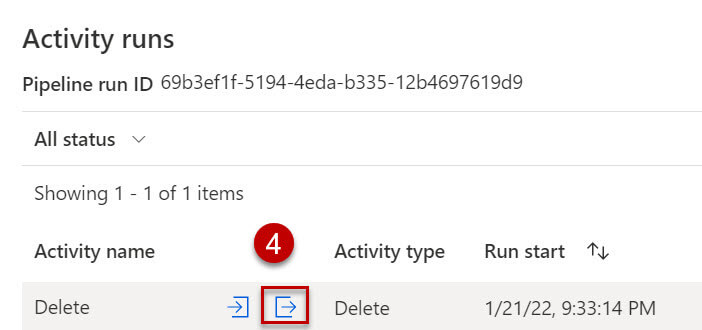
- Click on monitor icon on the left side.
- Select Pipeline runs option.
- Click on the pipeline name from the pipeline list to view all the activities in the pipeline.
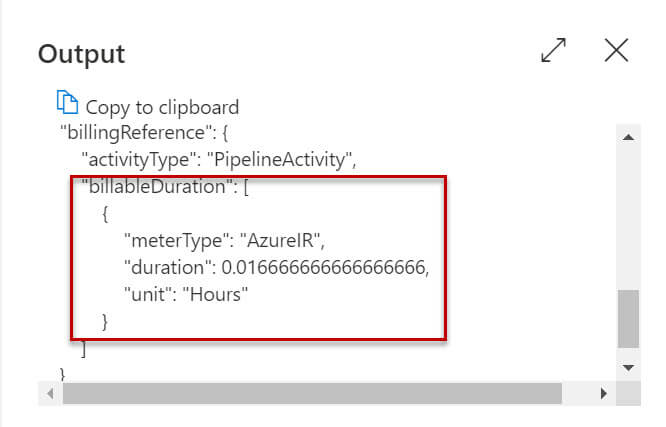
- Click on the output button just after the activity name, it will open a new pop-up window and search for billableDuration.
Sample output for a delete activity:
Create budgets to manage costs
You can create budgets to manage azure data factory costs more effectively, based on your budgets you can create alerts so that it can notify stakeholders about overspending of the resources. Budget and alerts can be created at azure subscriptions and resource levels. You can also apply further filters and create budgets specific to resources or services. So that you accidentally don’t create unnecessary resources which cost you more money.
Export Cost Data
If you want to do additional data analysis on the azure data factory cost, you can do so by exporting the cost data to a storage account. You can export the data on a daily, weekly, or monthly schedule or on a custom data range. By exporting the data, you will retrieve the cost datasets and data can be further analyzed using excel or power bi.
Azure data factory allows a maximum of 50 concurrent activities. If you try the 51st activity at the same time it will be queued and wait for free slots to open. For external activities, a maximum of 800 concurrent activities are allowed.
Conclusions
In this article, we discussed azure data factory pricing using various factors and components.