

A few weeks ago, someone asked me a simple question: "Are our SQL Server databases encrypted?"
At the time we had several dozen SQL Server instances spread across AWS EC2, Azure SQL Managed Instance, Azure SQL Database, and AWS RDS. Four platforms, three authentication methods, and multiple teams managing them. Nobody had a single view of the entire fleet.
I could have opened SSMS, connected to a Central Management Server group, and run a query. That would answer the question once. But the next question would follow: "What about backups?" Then "Who has sysadmin?" Then "Are we patched?"
So I decided to build something that answers all of those questions at once, and keeps answering them every time we run it.
This article walks through the architecture of that tool, the queries at its core, the design decisions that made the report useful to leadership, and the lessons learned along the way.
The High-level Approach
The tool has three layers.
The first is a server inventory: a YAML config file that lists every SQL Server instance with its hostname, port, authentication method, platform, environment, and owner. This is the single source of truth for what exists in the fleet.
The second is a connection factory that reads the inventory and builds the correct ODBC connection string for each server. Windows Authentication for domain-joined EC2 instances, Azure AD Interactive for Azure Managed Instances, and SQL Authentication for RDS. The operator does not choose how to connect; the config determines it automatically.
The third is a set of diagnostic SQL queries that each return a consistent result shape. Encryption status, backup health, security posture, configuration compliance, version information, disk capacity, and database activity. Each query is a standalone ".sql" file that works on any SQL Server version from 2016 through 2022.
The execution flow runs in four stages: load the inventory, connect to all servers in parallel using a thread pool, run every diagnostic query on every server, then combine the results by section and generate an HTML report with an executive summary, severity classification, and detail tabs.
+------------------------------------------------------------+
|  1. Server inventory (YAML)                                |
|     hostname, port, auth type, platform, environment, owner|
+------------------------------------------------------------+
                          |
                          v
+------------------------------------------------------------+
|  2. Connection factory                                     |
|     builds an ODBC string per auth type                    |
|     Windows Auth  |  Azure AD  |  SQL Auth                 |
+------------------------------------------------------------+
                          |
                          v
+------------------------------------------------------------+
|  3. Parallel execution (thread pool, 10 workers)           |
|     every diagnostic query against every server            |
|     three to five seconds for the whole fleet              |
+------------------------------------------------------------+
                          |
                          v
+------------------------------------------------------------+
|  4. HTML report generator                                  |
|     executive summary with health score                    |
|     severity-classified issues                             |
|     detail tabs with filters and sorting                   |
+------------------------------------------------------------+
This design means adding a new check is just dropping a ".sql" file into a folder. Adding a new server is one line in the YAML. The framework handles the rest.
The Queries at the Core
The encryption check was the query that started the project. It reads sys.dm_database_encryption_keys and translates the numeric "encryption_state" into something a human can read. The "LEFT JOIN" matters. A database with no row in sys.dm_database_encryption_keys has never had TDE enabled, which is exactly what we want to flag. The "ORDER BY" pushes unencrypted databases to the top so they are the first thing you see.
SELECT
    @@SERVERNAME AS server_name,
    d.name AS database_name,
    CASE
        WHEN dek.encryption_state IS NULL THEN 'Not Encrypted'
        WHEN dek.encryption_state = 3 THEN 'Encrypted'
        WHEN dek.encryption_state = 2 THEN 'Encryption In Progress'
        WHEN dek.encryption_state = 1 THEN 'Unencrypted'
        ELSE 'Other'
    END AS encryption_status,
    dek.key_algorithm,
    dek.key_length
FROM sys.databases d
LEFT JOIN sys.dm_database_encryption_keys dek
    ON d.database_id = dek.database_id
WHERE d.name NOT IN ('tempdb', 'master', 'model', 'msdb', 'rdsadmin')
ORDER BY
    CASE WHEN dek.encryption_state = 3 THEN 1 ELSE 0 END,
    d.name;
Backup health uses the same pattern against msdb.dbo.backupset, calculating hours since the last full backup:
SELECT
    @@SERVERNAME AS server_name,
    d.name AS database_name,
    d.recovery_model_desc AS recovery_model,
    MAX(CASE WHEN b.type = 'D' THEN b.backup_finish_date END) AS last_full_backup,
    DATEDIFF(HOUR,
        MAX(CASE WHEN b.type = 'D' THEN b.backup_finish_date END),
        GETDATE()) AS hours_since_full
FROM sys.databases d
LEFT JOIN msdb.dbo.backupset b ON d.name = b.database_name
WHERE d.name NOT IN ('tempdb', 'master', 'model', 'msdb')
  AND d.state_desc = 'ONLINE'
GROUP BY d.name, d.recovery_model_desc
ORDER BY hours_since_full DESC;
One caveat worth knowing: Azure SQL Managed Instance handles backups automatically through the platform, so an empty "last_full_backup" on Managed Instance does not mean a backup is missing. The report accounts for this by not flagging Azure-managed instances for stale backups. Little exceptions like this separate a tool people trust from one they learn to ignore.
Disk capacity uses sys.dm_os_volume_stats, which reports free space on every drive that holds a database file:
SELECT
    @@SERVERNAME AS server_name,
    vs.volume_mount_point AS drive,
    CAST(vs.total_bytes / 1024.0 / 1024 / 1024 AS DECIMAL(10,1)) AS total_gb,
    CAST(vs.available_bytes / 1024.0 / 1024 / 1024 AS DECIMAL(10,1)) AS free_gb,
    CAST(100.0 * vs.available_bytes / vs.total_bytes AS DECIMAL(5,1)) AS free_pct
FROM (
    SELECT DISTINCT
        vs.volume_mount_point, vs.total_bytes, vs.available_bytes
    FROM sys.master_files mf
    CROSS APPLY sys.dm_os_volume_stats(mf.database_id, mf.file_id) vs
) vs
ORDER BY free_pct ASC;
This became critical later, when we needed to plan a fleet-wide encryption rollout and had to know which servers had room for pre-encryption backups.
The remaining checks follow the same shape: security posture queries sys.server_principals for sysadmin members and the "sa" account status, configuration reads sys.configurations for max memory, MAXDOP and "xp_cmdshell", and version information comes from "SERVERPROPERTY". Each query is self-contained and returns a consistent result shape, which makes combining them across servers straightforward.
Solving the Mixed Authentication Problem
The one real technical challenge was authentication. Our fleet uses three different methods, and the connection layer needs to handle all of them transparently. The solution is a server config file where each entry declares its auth type:
servers:

  - name: PRODSQL01\INST01
    host: prodsql01.corp.local
    port: 1433
    auth: windows
    platform: ec2
    environment: prod

  - name: sqlmi-prod-01
    host: sqlmi-prod-01.database.windows.net
    auth: azure_ad_interactive
    platform: azure_mi
    environment: prod

  - name: prod-rds-sql-01
    host: prod-rds-sql-01.abcdef.us-east-1.rds.amazonaws.com
    port: 1433
    auth: sql
    platform: rds
    environment: prod
The connection factory reads the "auth" field and builds the appropriate ODBC connection string. For Windows Auth it sets "Trusted_Connection=yes". For Azure AD it uses "Authentication=ActiveDirectoryInteractive", which triggers a cached browser login with MFA. For SQL Auth it pulls credentials from environment variables. The rest of the tool never knows or cares which method was used; every connection looks the same once established.
Parallel Execution
Running a query against one server takes about two seconds. Run that sequentially across the fleet and you are waiting more than a minute. With a thread pool of ten workers, the full audit completes in three to five seconds.
That speed difference changes behavior. When a check takes five seconds, you run it often. When it takes two minutes, you put it off.
Designing a Report Leadership Will Read
The first version of the report was a CSV. It worked, and nobody looked at it. The second was an HTML table. Better, but still just raw data that a DBA could parse and an executive could not.
The version that finally landed had a health score, severity tiles counting critical, high, medium and low issues, and clickable findings that jump to a filtered detail view.
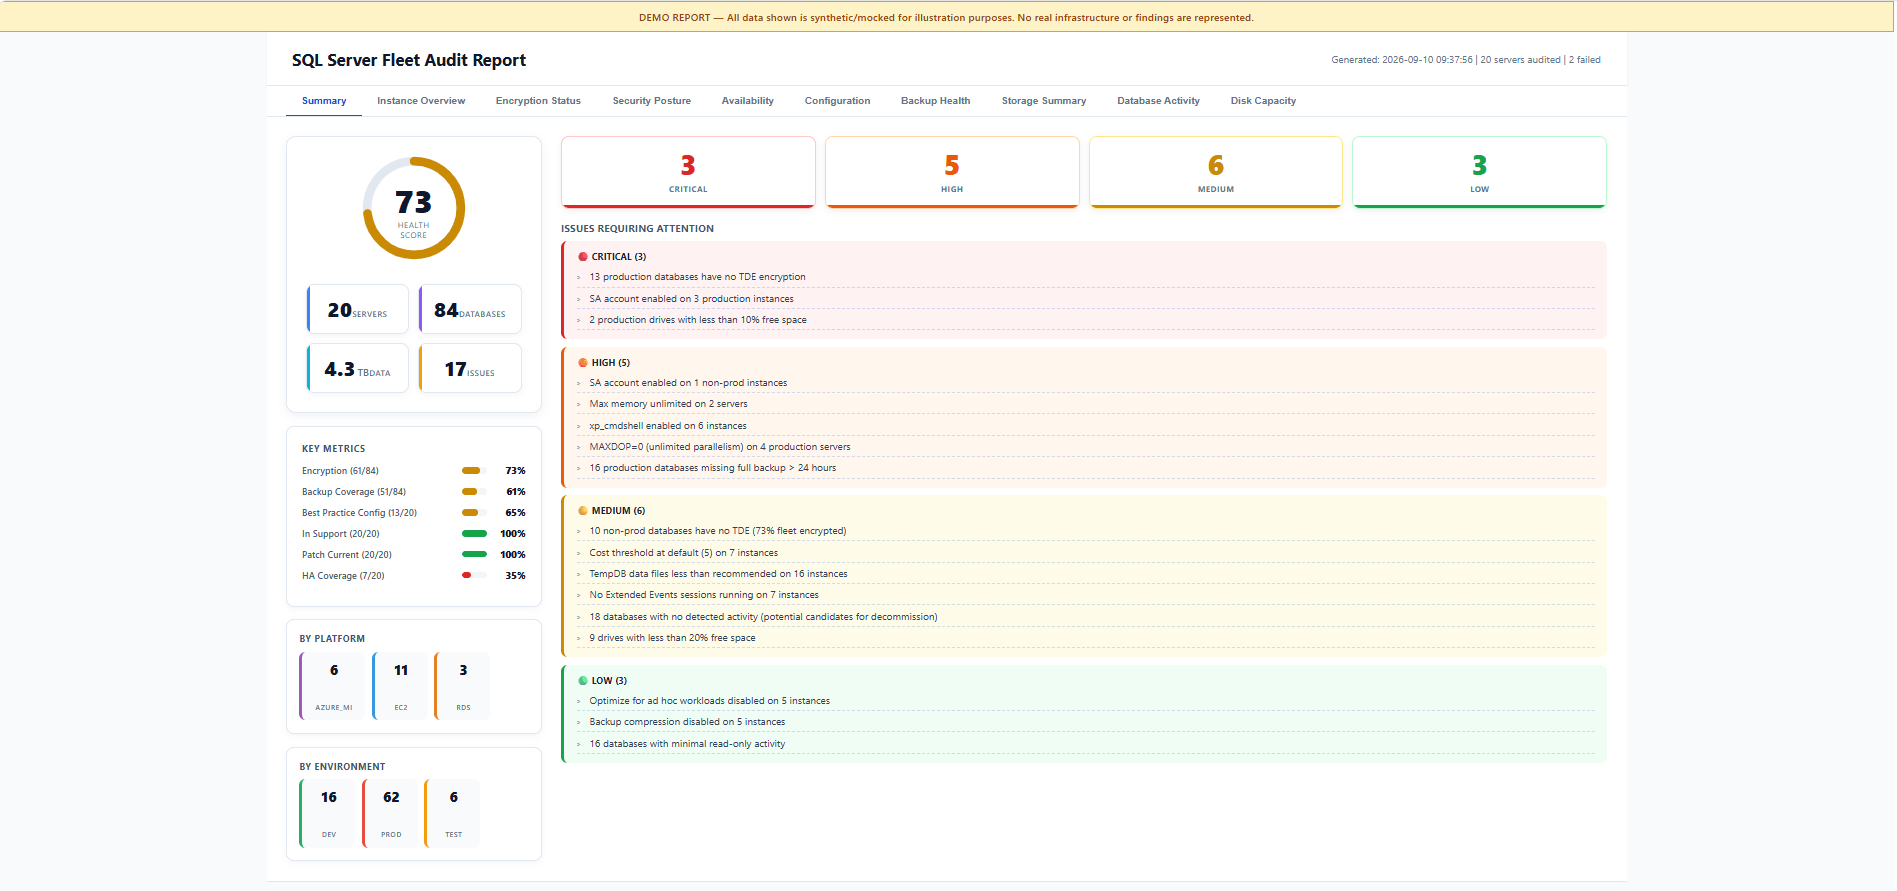
A senior leader looked at it for thirty seconds and asked why encryption coverage was so low. That one question kicked off a fleet-wide encryption project.
The health score took two tries. My first attempt was penalty-based: start at 100, subtract for every issue. It returned a single-digit score, which would have caused panic and was misleading. A penalty model punishes you for having a large fleet, since more servers means more findings.
I switched to a weighted average of key metrics:
| Metric                    | Weight   |
|---------------------------|----------|
| Backup coverage           |   25     |
| Encryption coverage       |   20     |
| Configuration compliance  |   15     |
| Support status            |   15     |
| Patch currency            |   15     |
| HA coverage               |   10     |
What came back was a fair reflection of a large estate with real gaps and real controls; still short of where we wanted it, honest about the work ahead, but not the five-alarm fire the penalty model implied. A health score is a communication tool. It has to drive action without triggering panic.
Severity classification needed the same care. "The 'sa' account is enabled" is a critical finding in production and a medium-priority cleanup item in a sandbox. The classification weights each finding by environment, so the same condition carries different severity depending on where it lives. This prevents the everything-is-critical fatigue that makes people tune reports out entirely.
What the First Run Found and What Happened Next
Running the full audit surfaced things nobody was actively tracking: production databases with no encryption at rest, privileged accounts enabled where they should not be, servers with memory left at unsafe defaults, instances on out-of-support versions, production databases without a recent backup, and several databases with no activity at all that were candidates for decommission.
None of these were new problems. What was new was seeing them together, ranked by severity, in one place. That visibility created accountability.
Within a week we had approval for a fleet-wide TDE encryption project, and the readiness data (database sizes, disk space, batch groupings) was already in the report. The audit became a running measure of progress, where the encryption percentage climbs with every batch we complete.
Lessons Learned
If I started over, I would add business-owner tagging from day one, so findings route to the right team without follow-up questions. I would enable DDL auditing before the first report, because when we found a missing database user, nothing had logged who removed it. And I would plan the backup story earlier, since the encryption project depends on solid backups and we found the gaps only when we went looking.
The tooling is almost beside the point. I built this in Python with pyodbc, but the same thing works in PowerShell with dbatools, or C#, or Go. The queries are standard T-SQL.
What matters is the approach: centralize an inventory with metadata, treat the fleet as one unit, make the tool fast enough to use daily, present output leadership will actually read, and let findings drive real remediation with progress tracking built in.
It all started with one question about encryption.

