

Excel, always Excel... I spent quite a bit of time over the years importing data into SQL Server, and most of that data was in Excel. I’ve been doing that kind of work since I can remember. I’ve used a lot of tools and tricks throughout the time, and now that I’m learning Python, I found DuckDB, which seems the ultimate tool for my needs. Can DuckDB also make your day?
I’ll focus only on the task-specific code here. For the complete code and instructions on how to run it, check the article’s GitHub repository.
Why DuckDB?
There are 3 reasons why I am now using DuckDB. I can find those features in other solutions, but I think DuckDB has the best mix:
- Interactive solution design: Using Jupyter I can test and enhance my queries interactively. It’s almost like SSMS but with the extra plus of good inline documentation;
- Scriptable: After I have the code I want, I can turn the notebook into a standalone Python script that I can easily run on the command line or schedule it as part of an automated workflow;
- SQL Code: Pandas or Polars can handle the previous requisites, but I am a SQL guy and still new to Python. Writing the same query in those libraries is, for me, a nightmare. DuckDB talks SQL, it feels like home.
Unfortunately, DuckDB doesn’t read XLS, only XSLX, and although Pandas used to support XLS and could be used to convert it, modern versions of Pandas no longer support it. If you have an XLS file, the simplest solution is to convert it beforehand.
DuckDB 101
In its simple form DuckDB is quite easy to run:
import duckdb
sampleRel = duckdb.sql("select * from 'orders.xlsx'")
First line is the usual import so you can use the library. After that you can start to use it and all you need is a simple select using the sql method. According to DuckDB documentation: This will run queries using an in-memory database that is stored globally inside the Python module. The result of the query is returned as a Relation. A relation is a symbolic representation of the query. The query is not executed until the result is fetched or requested to be printed to the screen.
Used like this, DuckDB reads the first sheet in the book, uses the first row as header and treats all the other rows as data. After creating the relation, you can evaluate and display its content just by referencing it on a line by itself:
sampleRel
In our example we get:
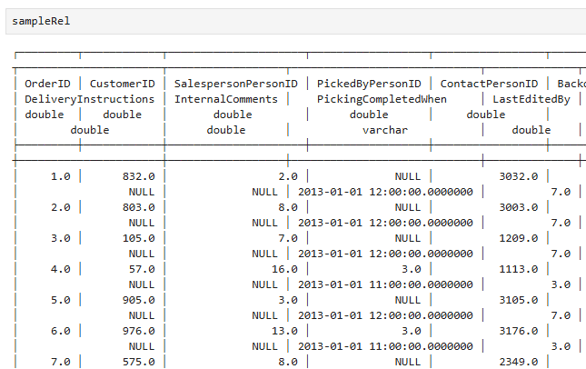
Figure 1 Relation output example
For greater control on what is returned we should use the read_xlsx function. For example, to get the suppliers sheet we do:
sampleRel = duckdb.sql("select * from read_xlsx('orders.xlsx', sheet='Suppliers')”)Which will give us:
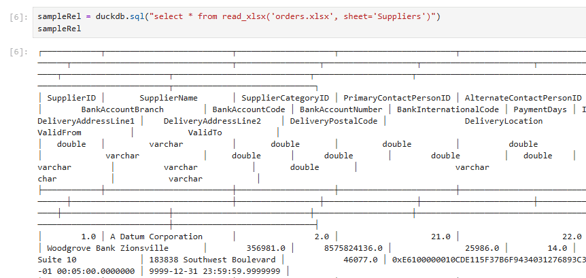
Figure 2 Relation output example with read_xlsx function
Here we used the sheet parameter, which is the most useful one; other parameters are available such as range to limit the area of the sheet to import. You may want to see the documentation for a complete description of all the parameters.
And as easy as it sounds, this is all we need from DuckDB to import XLSX! Let’s now view a more complex example.
Example Scenario
Our example will be based on the WideWorldImporters SQL sample database. We will use the data from the database to create an Excel file with the latest orders, respective stock items and its suppliers. Our focus is on the OrderLines table, especially the Quantity and PickedQuantity fields. The first is the ordered quantity and the second is the available quantity.
Based on that Excel file, our script will generate a table with all the missing items and its supplier and upload it to SQL server. There will be a line for each missing item, its supplier, and the sum of the missing quantity:
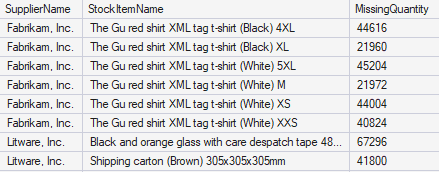
Figure 3 Example of the pretended result
In our scenario, the file would be generated with orders from, for example, the last hour, but to have a nice quantity of information we will use all the data from the orderlines table. The exported data looks like this in Excel:
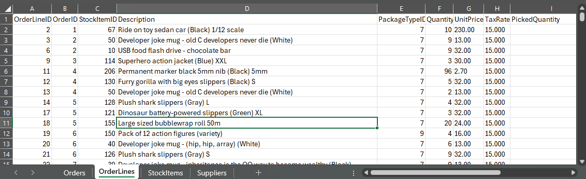
Figure 4 Excel file created by the ordering system
From Concept to Code
Using SQL, getting the result in Figure 3 from the data in Figure 4 is straightforward. We just need to join the excel sheets like they were tables, filter and group them:
rel = duckdb.sql("""
    SELECT Suppliers.SupplierName,StockItemName,sum(Quantity-PickedQuantity) MissingQuantity
         FROM read_xlsx('orders.xlsx', sheet='OrderLines') OrderLines
         INNER JOIN read_xlsx('orders.xlsx', sheet='StockItems') StockItems
             ON OrderLines.StockItemId=StockItems.StockItemId
         INNER JOIN read_xlsx('orders.xlsx', sheet='Suppliers') Suppliers
             ON StockItems.SupplierID=Suppliers.SupplierID
    WHERE Quantity <> PickedQuantity
    GROUP BY Suppliers.SupplierName,StockItemName
    ORDER BY SupplierName,StockItemName;
""")
This all-too-common SQL code will create the relation with the pretended data:
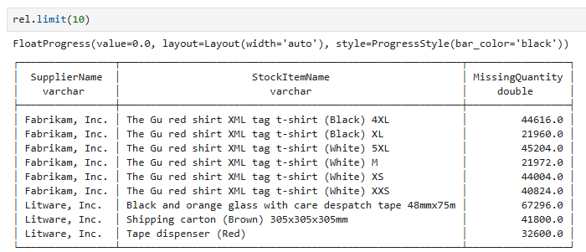
Figure 5 Query to import in SQL Server
That SQL statement is all we need to extract the code from EXCEL, now we just need to save it to SQL Server. And this is as simple as it gets! It’s a very simple, three-line snippet, but before that we need three libraries:
import pandas as pd
import pyodbc
from sqlalchemy import create_engine
And now we can export to SQL Server. DuckDB doesn’t support saving to SQL Server, but Pandas does, so we start by copying the DuckDB relation to a Pandas dataframe. After that, we use sqlalchemy and pyodbc to create a connection to SQL Server. Finally, we use the to_sql method from the dataframe to send it to the table MissingItems in SQL Server. In this example, we selected the options to replace the data in the table and not send the internal dataframe column index. The replace option deletes the table if it exists and then creates it with the columns contained in the dataframe. If you already have the table and want to keep the data, you should use exists=”append”.
df = rel.df()
engine = create_engine("mssql+pyodbc://<username>:<password>@<sqlserver>/<database>?driver=ODBC+Driver+17+for+SQL+Server")
df.to_sql("MissingItems", engine, if_exists="replace", index=False)
You can also add other columns to the table if you want. For example, I added an identity column for primary key and a column with getdate() as default to register the created date and time.
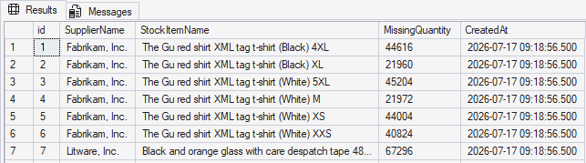
Figure 6 SQL Table with imported data
Command Line Mode
We have now tested our code, and everything looks good, so we can build a script to run the complete code from the command line. Our complete code, excel2sql.py, will look like this:
import duckdb
import pandas as pd
import pyodbc
import time
from sqlalchemy import create_engine
start = time.time()
rel = duckdb.sql("""
    SELECT Suppliers.SupplierName,StockItemName,sum(Quantity-PickedQuantity) MissingQuantity
         FROM read_xlsx('orders.xlsx', sheet='OrderLines') OrderLines
         INNER JOIN read_xlsx('orders.xlsx', sheet='StockItems') StockItems
             ON OrderLines.StockItemId=StockItems.StockItemId
         INNER JOIN read_xlsx('orders.xlsx', sheet='Suppliers') Suppliers
             ON StockItems.SupplierID=Suppliers.SupplierID
    WHERE Quantity <> PickedQuantity
    GROUP BY Suppliers.SupplierName,StockItemName
    ORDER BY SupplierName,StockItemName;
""")

df = rel.df()
n = len(df)
print(f"{n} missing Items")

if n != 0:
    engine = create_engine("mssql+pyodbc://mcpserver:mcpserver@127.0.0.1/WideWorldImporters?driver=ODBC+Driver+17+for+SQL+Server")
    df.to_sql("MissingItems", engine, if_exists="append", index=False)
    print("MissingItems database updated")

end = time.time()
elapsed = end - start
print(f"Task completed in {elapsed:.3f} seconds.")
To run it, we just call uv run excel2sql.py which should greet us with something like:
9 missing Items
MissingItems database updated
Task completed in 4.981 seconds.
Final thoughts
Could it be easier? I don’t think so! DuckDB is now one of my best friends and it doesn’t stop with Excel. DuckDB supports formats like JSON and Parquet. There are also a lot of community extensions that do amazing things like, for example, generating fake data or doing astronomical calculations. It’s a really cool library and I am eager to explore the existing extensions and see what exciting new ones will be coming out.
