

Taking SQL art from shamrocks and Easter eggs to something your DBA manager might actually care about.
If you've been following my SQL spatial art series — shamrocks, Easter eggs, Christmas trees — you'll know I have a habit of finding increasingly creative misuses for SQL Server's geometry data type. Most of them have been purely decorative. Fun, but not exactly something you'd put in a production runbook.
That changed the other day when I read How to Draw Line Graphs in SSMS by Brent Ozar. It's a great piece — go and read it if you haven't. It got me thinking: what if I took that idea and pushed it somewhere more practical? What if instead of drawing shamrocks, I used spatial geometry to actually visualise something useful?
Blocking. Of course it was going to be blocking.
The Idea
SQL Server blocking is one of those things that's easy to detect but sometimes hard to explain to people who aren't staring at sys.dm_exec_requests every day. You can see the numbers, but a chart tells the story much faster — which sessions are waiting, how long they've been waiting, and critically, who is causing it.
So here's what I built: a live blocking visualiser that pulls straight from sys.dm_exec_requests and renders:
- A line graph of wait time in seconds per session
- A second line showing the running count of blocked SPIDs
- A dot per SPID on the chart, coloured by status
- SPID numbers stamped above blocked sessions and the head blocker
- A diamond marker and HEAD BLOCKER label at the culprit session
- Vertical marker lines dropped from any blocking or blocked session to the X axis
All of it rendered in SSMS's Spatial Results tab. No external tools. No SSRS. No Power BI. Just T-SQL and geometry.
How It Works
Step 1: Capture the Snapshot
First we pull the blocking picture from sys.dm_exec_requests:
SELECT
    r.session_id                                    AS spid,
    r.blocking_session_id                           AS blocking_spid,
    ISNULL(r.wait_time / 1000.0, 0)                 AS wait_secs,
    CASE WHEN EXISTS (
        SELECT 1 FROM sys.dm_exec_requests b
        WHERE b.blocking_session_id = r.session_id
    ) THEN 1 ELSE 0 END                             AS is_head_blocker,
    CASE WHEN r.blocking_session_id > 0
         THEN 1 ELSE 0 END                          AS is_blocked,
    ROW_NUMBER() OVER (ORDER BY r.session_id)       AS plot_x
INTO #blocking
FROM sys.dm_exec_requests r
WHERE r.session_id > 50
  AND r.session_id <> @@SPID;
The key columns are wait_time (converted from milliseconds to seconds), blocking_session_id, and two derived flags — is_blocked and is_head_blocker. The head blocker is identified by checking whether any other session lists this one as its blocker. plot_x gives us the X position on the chart.
The script also includes a demo dataset that kicks in if no blocking is found, so it always renders something useful even on a quiet server.
Step 2: Scale to Chart Coordinates
The chart area is 18 units wide and 8 units tall. We scale each SPID's wait time and position to fit:
SET @currX = @originX + (CAST(@px AS float) / @maxX) * @chartW;
SET @currY = @originY + (@wait / @maxWait) * @chartH;
Simple normalisation — the longest wait always reaches the top of the chart, everything else scales proportionally.
Step 3: Draw the Lines and Dots
Each SPID gets a dot at its chart position. The dot colour tells you its status at a glance:
- Normal dot — session is running fine
- Blocked dot — session is being blocked by someone else
- Head blocker dot — this session is causing the queue
Line segments connect the dots to form the wait time trend line. A second line tracks the running count of blocked SPIDs.
Step 4: SPID Numbers Using the Pixel Font
Regular readers of this series will recognise the pixel font engine — a table variable of (character, row, column) coordinates stamped as tiny polygon squares. This time it's rendering SPID numbers rather than "HAPPY ST PATRICKS DAY", which feels like progress.
We only label the sessions that matter — blocked SPIDs and the head blocker. Normal running sessions just get a plain dot.
Font scale is set to 0.12 — learned the hard way that anything smaller collapses to a point after MakeValid() and causes SSMS to throw a geometry format error.
Step 5: The Head Blocker Diamond and Label
The head blocker gets a diamond shape, "HEAD BLOCKER" in pixel letters above it, and a vertical marker line to the X axis. The text sits in its own colour group so it renders separately from the diamond and SPID number — stops them merging into one unreadable blob, which they absolutely did on the first attempt.
Step 6: The Dummy Shape
Old friends will know this one. SSMS's spatial viewer assigns colours from a fixed 8-slot palette. Slot 4 is always purple. A microscopic off-screen point absorbs it:
INSERT INTO #graph VALUES
(geometry::Point(-0.5, -0.5, 0).STBuffer(0.01).MakeValid(), 'dummy');
The dummy shape. Series veteran. Undefeated.
Testing It With Real Blocking
To see the chart with real blocking, run these in separate SSMS windows.
First create the test table in any window:
USE tempdb;
GO
DROP TABLE IF EXISTS dbo.BlockingTest;
CREATE TABLE dbo.BlockingTest (id int PRIMARY KEY, val varchar(100));
INSERT INTO dbo.BlockingTest VALUES (1,'Row One'),(2,'Row Two'),(3,'Row Three');
Window 1 — Head blocker (leave this running, do not commit):
USE tempdb;
BEGIN TRANSACTION;
    UPDATE dbo.BlockingTest SET val = 'held' WHERE id = 1;
    WAITFOR DELAY '00:05:00';
ROLLBACK;
Window 2 — Blocked session 1 (will hang immediately):
USE tempdb;
SELECT * FROM dbo.BlockingTest WITH (UPDLOCK) WHERE id = 1;
Window 3 — Blocked session 2 (will also hang):
USE tempdb;
UPDATE dbo.BlockingTest SET val = 'Window 3 wants this' WHERE id = 1;
Then run the full visualiser script below in Window 4 and switch to the Spatial Results tab.
To clean up, run ROLLBACK in Window 1 and drop the table:
DROP TABLE IF EXISTS tempdb.dbo.BlockingTest;
What the Chart Tells You
At a glance you can see:
- Which sessions have the longest wait times — the highest points on the wait time line
- How many sessions are blocked — the second line climbing as the chain grows
- Exactly which SPID is the head blocker — diamond, label, vertical marker, hard to miss
- Which SPIDs are caught in the chain — different colour dots with their numbers visible
It won't replace sp_WhoIsActive or your favourite monitoring tool. But as a quick visual snapshot — especially for explaining blocking chains to someone who doesn't live in DMVs — it does a surprisingly good job.
SSMS Colour Slot Map
SSMS assigns its own palette — you can't specify actual colours, only control the order groups are returned. The slot map for this script is:
| Slot | SSMS Colour | Used For |
|---|---|---|
| 1 | Teal | Axes and grid |
| 2 | Orange | Wait time line |
| 3 | Blue | Normal dots |
| 4 | Purple | Dummy — off-screen, sacrificed as always |
| 5 | Grey | Blocked dots + markers |
| 6 | Beige | Blocked count line |
| 7 | Sage | Head blocker diamond + SPID number |
| 8 | Dark grey | HEAD BLOCKER text label |
The Full Script
USE tempdb;
GO
DROP TABLE IF EXISTS #blocking;
DROP TABLE IF EXISTS #graph;
GO
--------------------------------------------------------------------------------
-- 1) CAPTURE BLOCKING SNAPSHOT
--------------------------------------------------------------------------------
SELECT r.session_id AS spid,
r.blocking_session_id AS blocking_spid,
ISNULL(r.wait_time / 1000.0, 0) AS wait_secs,
r.wait_type,
r.status,
CASE
WHEN EXISTS
(
SELECT 1
FROM sys.dm_exec_requests b
WHERE b.blocking_session_id = r.session_id
) THEN
1
ELSE
0
END AS is_head_blocker,
CASE
WHEN r.blocking_session_id > 0 THEN
1
ELSE
0
END AS is_blocked,
ROW_NUMBER() OVER (ORDER BY r.session_id) AS plot_x
INTO #blocking
FROM sys.dm_exec_requests r
WHERE r.session_id > 50
AND r.session_id <> @@SPID; -- Demo data if no blocking found
IF NOT EXISTS (SELECT 1 FROM #blocking)
BEGIN
INSERT INTO #blocking
VALUES
(51, 0, 0.0, 'RUNNING', 'running', 0, 0, 1);
INSERT INTO #blocking
VALUES
(52, 51, 4.2, 'LCK_M_IX', 'suspended', 0, 1, 2);
INSERT INTO #blocking
VALUES
(53, 51, 6.8, 'LCK_M_S', 'suspended', 0, 1, 3);
INSERT INTO #blocking
VALUES
(54, 0, 0.5, 'RUNNING', 'running', 1, 0, 4);
INSERT INTO #blocking
VALUES
(55, 54, 2.1, 'LCK_M_U', 'suspended', 0, 1, 5);
INSERT INTO #blocking
VALUES
(56, 0, 1.2, 'PAGEIOLATCH', 'running', 0, 0, 6);
END;
CREATE TABLE #graph
(
shape GEOMETRY,
colour VARCHAR(30)
);
GO
--------------------------------------------------------------------------------
-- 2) ALL WORK IN ONE BATCH — no GO after this point
--------------------------------------------------------------------------------
DECLARE @maxX FLOAT =
(
SELECT MAX(plot_x)FROM #blocking
);
DECLARE @maxWait FLOAT =
(
SELECT MAX(wait_secs)FROM #blocking
);
DECLARE @maxCount FLOAT =
(
SELECT COUNT(*)FROM #blocking WHERE is_blocked = 1
);
DECLARE @chartW FLOAT = 18.0;
DECLARE @chartH FLOAT = 8.0;
DECLARE @originX FLOAT = 1.0;
DECLARE @originY FLOAT = 1.0;
IF @maxX = 0
SET @maxX = 1;
IF @maxWait = 0
SET @maxWait = 1;
IF @maxCount = 0
SET @maxCount = 1; -- -- DIGIT FONT (declared before cursor, used for SPID labels) ----------------
DECLARE @Digits TABLE
(
ch NCHAR(1),
r TINYINT,
c TINYINT
);
INSERT INTO @Digits
VALUES
(N'0', 0, 1),
(N'0', 0, 2),
(N'0', 0, 3),
(N'0', 1, 0),
(N'0', 1, 4),
(N'0', 2, 0),
(N'0', 2, 4),
(N'0', 3, 0),
(N'0', 3, 4),
(N'0', 4, 0),
(N'0', 4, 4),
(N'0', 5, 0),
(N'0', 5, 4),
(N'0', 6, 1),
(N'0', 6, 2),
(N'0', 6, 3),
(N'1', 0, 2),
(N'1', 1, 1),
(N'1', 1, 2),
(N'1', 2, 2),
(N'1', 3, 2),
(N'1', 4, 2),
(N'1', 5, 2),
(N'1', 6, 1),
(N'1', 6, 2),
(N'1', 6, 3),
(N'2', 0, 1),
(N'2', 0, 2),
(N'2', 0, 3),
(N'2', 1, 0),
(N'2', 1, 4),
(N'2', 2, 4),
(N'2', 3, 2),
(N'2', 3, 3),
(N'2', 4, 1),
(N'2', 5, 0),
(N'2', 6, 0),
(N'2', 6, 1),
(N'2', 6, 2),
(N'2', 6, 3),
(N'2', 6, 4),
(N'3', 0, 1),
(N'3', 0, 2),
(N'3', 0, 3),
(N'3', 1, 0),
(N'3', 1, 4),
(N'3', 2, 4),
(N'3', 3, 2),
(N'3', 3, 3),
(N'3', 4, 4),
(N'3', 5, 0),
(N'3', 5, 4),
(N'3', 6, 1),
(N'3', 6, 2),
(N'3', 6, 3),
(N'4', 0, 0),
(N'4', 0, 4),
(N'4', 1, 0),
(N'4', 1, 4),
(N'4', 2, 0),
(N'4', 2, 4),
(N'4', 3, 0),
(N'4', 3, 1),
(N'4', 3, 2),
(N'4', 3, 3),
(N'4', 3, 4),
(N'4', 4, 4),
(N'4', 5, 4),
(N'4', 6, 4),
(N'5', 0, 0),
(N'5', 0, 1),
(N'5', 0, 2),
(N'5', 0, 3),
(N'5', 0, 4),
(N'5', 1, 0),
(N'5', 2, 0),
(N'5', 3, 0),
(N'5', 3, 1),
(N'5', 3, 2),
(N'5', 3, 3),
(N'5', 4, 4),
(N'5', 5, 4),
(N'5', 6, 0),
(N'5', 6, 1),
(N'5', 6, 2),
(N'5', 6, 3),
(N'6', 0, 1),
(N'6', 0, 2),
(N'6', 0, 3),
(N'6', 1, 0),
(N'6', 2, 0),
(N'6', 3, 0),
(N'6', 3, 1),
(N'6', 3, 2),
(N'6', 3, 3),
(N'6', 4, 0),
(N'6', 4, 4),
(N'6', 5, 0),
(N'6', 5, 4),
(N'6', 6, 1),
(N'6', 6, 2),
(N'6', 6, 3),
(N'7', 0, 0),
(N'7', 0, 1),
(N'7', 0, 2),
(N'7', 0, 3),
(N'7', 0, 4),
(N'7', 1, 4),
(N'7', 2, 3),
(N'7', 3, 2),
(N'7', 4, 2),
(N'7', 5, 1),
(N'7', 6, 1),
(N'8', 0, 1),
(N'8', 0, 2),
(N'8', 0, 3),
(N'8', 1, 0),
(N'8', 1, 4),
(N'8', 2, 0),
(N'8', 2, 4),
(N'8', 3, 1),
(N'8', 3, 2),
(N'8', 3, 3),
(N'8', 4, 0),
(N'8', 4, 4),
(N'8', 5, 0),
(N'8', 5, 4),
(N'8', 6, 1),
(N'8', 6, 2),
(N'8', 6, 3),
(N'9', 0, 1),
(N'9', 0, 2),
(N'9', 0, 3),
(N'9', 1, 0),
(N'9', 1, 4),
(N'9', 2, 0),
(N'9', 2, 4),
(N'9', 3, 1),
(N'9', 3, 2),
(N'9', 3, 3),
(N'9', 3, 4),
(N'9', 4, 4),
(N'9', 5, 4),
(N'9', 6, 1),
(N'9', 6, 2),
(N'9', 6, 3); -- -- LETTER FONT (HEAD BLOCKER label only) ------------------------------------
DECLARE @Font TABLE
(
ch NCHAR(1),
r TINYINT,
c TINYINT
);
INSERT INTO @Font
VALUES
(N'H', 0, 0),
(N'H', 0, 4),
(N'H', 1, 0),
(N'H', 1, 4),
(N'H', 2, 0),
(N'H', 2, 4),
(N'H', 3, 0),
(N'H', 3, 1),
(N'H', 3, 2),
(N'H', 3, 3),
(N'H', 3, 4),
(N'H', 4, 0),
(N'H', 4, 4),
(N'H', 5, 0),
(N'H', 5, 4),
(N'H', 6, 0),
(N'H', 6, 4),
(N'E', 0, 0),
(N'E', 0, 1),
(N'E', 0, 2),
(N'E', 0, 3),
(N'E', 0, 4),
(N'E', 1, 0),
(N'E', 2, 0),
(N'E', 3, 0),
(N'E', 3, 1),
(N'E', 3, 2),
(N'E', 3, 3),
(N'E', 4, 0),
(N'E', 5, 0),
(N'E', 6, 0),
(N'E', 6, 1),
(N'E', 6, 2),
(N'E', 6, 3),
(N'E', 6, 4),
(N'A', 0, 1),
(N'A', 0, 2),
(N'A', 0, 3),
(N'A', 1, 0),
(N'A', 1, 4),
(N'A', 2, 0),
(N'A', 2, 4),
(N'A', 3, 0),
(N'A', 3, 1),
(N'A', 3, 2),
(N'A', 3, 3),
(N'A', 3, 4),
(N'A', 4, 0),
(N'A', 4, 4),
(N'A', 5, 0),
(N'A', 5, 4),
(N'A', 6, 0),
(N'A', 6, 4),
(N'D', 0, 0),
(N'D', 0, 1),
(N'D', 0, 2),
(N'D', 0, 3),
(N'D', 1, 0),
(N'D', 1, 4),
(N'D', 2, 0),
(N'D', 2, 4),
(N'D', 3, 0),
(N'D', 3, 4),
(N'D', 4, 0),
(N'D', 4, 4),
(N'D', 5, 0),
(N'D', 5, 4),
(N'D', 6, 0),
(N'D', 6, 1),
(N'D', 6, 2),
(N'D', 6, 3),
(N'B', 0, 0),
(N'B', 0, 1),
(N'B', 0, 2),
(N'B', 0, 3),
(N'B', 1, 0),
(N'B', 1, 4),
(N'B', 2, 0),
(N'B', 2, 4),
(N'B', 3, 0),
(N'B', 3, 1),
(N'B', 3, 2),
(N'B', 3, 3),
(N'B', 4, 0),
(N'B', 4, 4),
(N'B', 5, 0),
(N'B', 5, 4),
(N'B', 6, 0),
(N'B', 6, 1),
(N'B', 6, 2),
(N'B', 6, 3),
(N'L', 0, 0),
(N'L', 1, 0),
(N'L', 2, 0),
(N'L', 3, 0),
(N'L', 4, 0),
(N'L', 5, 0),
(N'L', 6, 0),
(N'L', 6, 1),
(N'L', 6, 2),
(N'L', 6, 3),
(N'L', 6, 4),
(N'O', 0, 1),
(N'O', 0, 2),
(N'O', 0, 3),
(N'O', 1, 0),
(N'O', 1, 4),
(N'O', 2, 0),
(N'O', 2, 4),
(N'O', 3, 0),
(N'O', 3, 4),
(N'O', 4, 0),
(N'O', 4, 4),
(N'O', 5, 0),
(N'O', 5, 4),
(N'O', 6, 1),
(N'O', 6, 2),
(N'O', 6, 3),
(N'C', 0, 1),
(N'C', 0, 2),
(N'C', 0, 3),
(N'C', 0, 4),
(N'C', 1, 0),
(N'C', 2, 0),
(N'C', 3, 0),
(N'C', 4, 0),
(N'C', 5, 0),
(N'C', 6, 1),
(N'C', 6, 2),
(N'C', 6, 3),
(N'C', 6, 4),
(N'K', 0, 0),
(N'K', 0, 4),
(N'K', 1, 0),
(N'K', 1, 3),
(N'K', 2, 0),
(N'K', 2, 2),
(N'K', 3, 0),
(N'K', 3, 1),
(N'K', 4, 0),
(N'K', 4, 2),
(N'K', 5, 0),
(N'K', 5, 3),
(N'K', 6, 0),
(N'K', 6, 4),
(N'R', 0, 0),
(N'R', 0, 1),
(N'R', 0, 2),
(N'R', 0, 3),
(N'R', 1, 0),
(N'R', 1, 4),
(N'R', 2, 0),
(N'R', 2, 4),
(N'R', 3, 0),
(N'R', 3, 1),
(N'R', 3, 2),
(N'R', 3, 3),
(N'R', 4, 0),
(N'R', 4, 2),
(N'R', 5, 0),
(N'R', 5, 3),
(N'R', 6, 0),
(N'R', 6, 4);
--------------------------------------------------------------------------------
-- 3) AXES + GRID
--------------------------------------------------------------------------------
INSERT INTO #graph
VALUES
(geometry::STGeomFromText(
CONCAT(
'LINESTRING(',
@originX,
' ',
@originY,
', ',
@originX + @chartW + 0.5,
' ',
@originY,
')'
),
0
).STBuffer(0.03).MakeValid(), 'axis'),
(geometry::STGeomFromText(
CONCAT(
'LINESTRING(',
@originX,
' ',
@originY,
', ',
@originX,
' ',
@originY + @chartH + 0.5,
')'
),
0
).STBuffer(0.03).MakeValid(), 'axis'),
(geometry::STGeomFromText(
CONCAT(
'LINESTRING(',
@originX + @chartW,
' ',
@originY,
', ',
@originX + @chartW,
' ',
@originY + @chartH + 0.5,
')'
),
0
).STBuffer(0.03).MakeValid(), 'axis');
DECLARE @g INT = 1;
WHILE @g <= 4
BEGIN
INSERT INTO #graph
VALUES
(geometry::STGeomFromText(
CONCAT(
'LINESTRING(',
@originX,
' ',
@originY + (@g * 2.0),
', ',
@originX + @chartW,
' ',
@originY + (@g * 2.0),
')'
),
0
).STBuffer(0.02).MakeValid(), 'axis');
SET @g += 1;
END;
--------------------------------------------------------------------------------
-- 4) WAIT TIME LINE + DOTS + SPID PIN MARKERS
--------------------------------------------------------------------------------
DECLARE @prevX FLOAT,
@prevY FLOAT,
@currX FLOAT,
@currY FLOAT,
@prevX2 FLOAT,
@prevY2 FLOAT;
DECLARE @spid INT,
@bspid INT,
@wait FLOAT,
@px INT,
@isBlocked INT,
@isHead INT;
DECLARE @dotColour VARCHAR(30);
DECLARE line_cur CURSOR FAST_FORWARD FOR
SELECT spid,
blocking_spid,
wait_secs,
plot_x,
is_blocked,
is_head_blocker
FROM #blocking
ORDER BY plot_x;
SET @prevX = NULL;
OPEN line_cur;
FETCH NEXT FROM line_cur
INTO @spid,
@bspid,
@wait,
@px,
@isBlocked,
@isHead;
WHILE @@FETCH_STATUS = 0
BEGIN
SET @currX = @originX + (CAST(@px AS FLOAT) / @maxX) * @chartW;
SET @currY = @originY + (@wait / @maxWait) * @chartH; -- Line segment connecting dots
IF @prevX IS NOT NULL
INSERT INTO #graph
VALUES
(geometry::STGeomFromText(CONCAT('LINESTRING(', @prevX, ' ', @prevY, ', ', @currX, ' ', @currY, ')'), 0).STBuffer(0.05).MakeValid(),
'waitline'); -- Dot colour based on status
SET @dotColour = CASE
WHEN @isHead = 1 THEN
'headblocker_dot'
WHEN @isBlocked = 1 THEN
'blocked_dot'
ELSE
'dot'
END; -- Main dot
INSERT INTO #graph
VALUES
(geometry::Point(@currX, @currY, 0).STBuffer(0.22).MakeValid(), @dotColour); -- Vertical blocking marker line for blocked / head blocker
IF @isBlocked = 1
OR @isHead = 1
INSERT INTO #graph
VALUES
( geometry::STGeomFromText(
CONCAT(
'LINESTRING(',
@currX,
' ',
@originY,
', ',
@currX,
' ',
@originY + @chartH,
')'
),
0
).STBuffer(0.04).MakeValid(), CASE
WHEN @isHead = 1 THEN
'headblocker_dot'
ELSE
'blocked_dot'
END); -- SPID number only shown for blocked SPIDs and head blockers
IF @isBlocked = 1
OR @isHead = 1
BEGIN
DECLARE @dScale DECIMAL(6, 3) = 0.12;
DECLARE @dStep DECIMAL(6, 3) = (5 * @dScale) + @dScale;
DECLARE @spidStr VARCHAR(10) = CAST(@spid AS VARCHAR(10));
DECLARE @dX DECIMAL(8, 4) = CAST(@currX - (LEN(@spidStr) * @dStep / 2.0) AS DECIMAL(8, 4));
DECLARE @dY DECIMAL(8, 4) = CAST(@currY + 0.55 AS DECIMAL(8, 4)); -- above dot, below label
DECLARE @di INT = 1;
DECLARE @dch NCHAR(1);
WHILE @di <= LEN(@spidStr)
BEGIN
SET @dch = SUBSTRING(@spidStr, @di, 1);
INSERT INTO #graph
(
shape,
colour
)
SELECT s,
@dotColour
FROM
(
SELECT geometry::STGeomFromText(
CONCAT(
'POLYGON((',
CAST(ROUND(@dX + ((@di - 1) * @dStep) + (c * @dScale), 4) AS VARCHAR(14)),
' ',
CAST(ROUND(@dY + ((6 - r) * @dScale), 4) AS VARCHAR(14)),
',',
CAST(ROUND(
@dX + ((@di - 1) * @dStep)
+ ((c + 1) * @dScale),
4
) AS VARCHAR(14)),
' ',
CAST(ROUND(@dY + ((6 - r) * @dScale), 4) AS VARCHAR(14)),
',',
CAST(ROUND(
@dX + ((@di - 1) * @dStep)
+ ((c + 1) * @dScale),
4
) AS VARCHAR(14)),
' ',
CAST(ROUND(@dY + ((6 - r + 1) * @dScale), 4) AS VARCHAR(14)),
',',
CAST(ROUND(@dX + ((@di - 1) * @dStep) + (c * @dScale), 4) AS VARCHAR(14)),
' ',
CAST(ROUND(@dY + ((6 - r + 1) * @dScale), 4) AS VARCHAR(14)),
',',
CAST(ROUND(@dX + ((@di - 1) * @dStep) + (c * @dScale), 4) AS VARCHAR(14)),
' ',
CAST(ROUND(@dY + ((6 - r) * @dScale), 4) AS VARCHAR(14)),
'))'
),
0
).MakeValid() AS s
FROM @Digits
WHERE ch = @dch
) q
WHERE s IS NOT NULL
AND s.STIsValid() = 1
AND s.STGeometryType() <> 'Point'
AND s.STArea() > 0.00001;
SET @di += 1;
END;
END; -- end IF @isBlocked / @isHead SET @prevX = @currX; SET @prevY = @currY;
FETCH NEXT FROM line_cur
INTO @spid,
@bspid,
@wait,
@px,
@isBlocked,
@isHead;
END;
CLOSE line_cur;
DEALLOCATE line_cur;
--------------------------------------------------------------------------------
-- 5) BLOCKED COUNT LINE (right Y axis)
--------------------------------------------------------------------------------
DECLARE @runCount FLOAT = 0;
DECLARE @cpx INT,
@cblocked INT;
DECLARE count_cur CURSOR FAST_FORWARD FOR
SELECT plot_x,
is_blocked
FROM #blocking
ORDER BY plot_x;
SET @prevX2 = NULL;
OPEN count_cur;
FETCH NEXT FROM count_cur
INTO @cpx,
@cblocked;
WHILE @@FETCH_STATUS = 0
BEGIN
SET @runCount += @cblocked;
SET @currX = @originX + (CAST(@cpx AS FLOAT) / @maxX) * @chartW;
SET @currY = @originY + (@runCount / @maxCount) * @chartH;
IF @prevX2 IS NOT NULL
INSERT INTO #graph
VALUES
(geometry::STGeomFromText(CONCAT('LINESTRING(', @prevX2, ' ', @prevY2, ', ', @currX, ' ', @currY, ')'), 0).STBuffer(0.05).MakeValid(),
'countline');
SET @prevX2 = @currX;
SET @prevY2 = @currY;
FETCH NEXT FROM count_cur
INTO @cpx,
@cblocked;
END;
CLOSE count_cur;
DEALLOCATE count_cur;
--------------------------------------------------------------------------------
-- 6) HEAD BLOCKER DIAMOND + PIXEL "HEAD BLOCKER" LABEL
--------------------------------------------------------------------------------
DECLARE @lbScale DECIMAL(6, 3) = 0.10;
DECLARE @lbStep DECIMAL(6, 3) = (5 * @lbScale) + @lbScale;
DECLARE @lbX DECIMAL(8, 4),
@lbY1 DECIMAL(8, 4),
@lbY2 DECIMAL(8, 4);
DECLARE @li INT,
@lch NCHAR(1);
DECLARE @lbWord1 NVARCHAR(10) = N'HEAD';
DECLARE @lbWord2 NVARCHAR(10) = N'BLOCKER';
DECLARE @hspid INT,
@hpx INT,
@hwait FLOAT;
DECLARE hb_cur CURSOR FAST_FORWARD FOR
SELECT spid,
plot_x,
wait_secs
FROM #blocking
WHERE is_head_blocker = 1;
OPEN hb_cur;
FETCH NEXT FROM hb_cur
INTO @hspid,
@hpx,
@hwait;
WHILE @@FETCH_STATUS = 0
BEGIN
SET @currX = @originX + (CAST(@hpx AS FLOAT) / @maxX) * @chartW;
SET @currY = @originY + (@hwait / @maxWait) * @chartH; -- Diamond marker
INSERT INTO #graph
VALUES
(geometry::STGeomFromText(
CONCAT(
'POLYGON((',
@currX,
' ',
@currY + 0.5,
',',
@currX + 0.45,
' ',
@currY,
',',
@currX,
' ',
@currY - 0.5,
',',
@currX - 0.45,
' ',
@currY,
',',
@currX,
' ',
@currY + 0.5,
'))'
),
0
).MakeValid(), 'headblocker_dot');
SET @lbX = CAST(@currX - 0.3 AS DECIMAL(8, 4));
SET @lbY1 = CAST(@currY + 1.8 AS DECIMAL(8, 4)); -- "HEAD" higher up
SET @lbY2 = CAST(@currY + 1.8 + (@lbScale * 9) AS DECIMAL(8, 4)); -- "BLOCKER" below "HEAD" -- Stamp "HEAD"
SET @li = 1;
WHILE @li <= LEN(@lbWord1)
BEGIN
SET @lch = SUBSTRING(@lbWord1, @li, 1);
INSERT INTO #graph
(
shape,
colour
)
SELECT s,
'hb_label'
FROM
(
SELECT geometry::STGeomFromText(
CONCAT(
'POLYGON((',
CAST(ROUND(@lbX + ((@li - 1) * @lbStep) + (c * @lbScale), 4) AS VARCHAR(14)),
' ',
CAST(ROUND(@lbY1 + ((6 - r) * @lbScale), 4) AS VARCHAR(14)),
',',
CAST(ROUND(
@lbX + ((@li - 1) * @lbStep)
+ ((c + 1) * @lbScale),
4
) AS VARCHAR(14)),
' ',
CAST(ROUND(@lbY1 + ((6 - r) * @lbScale), 4) AS VARCHAR(14)),
',',
CAST(ROUND(
@lbX + ((@li - 1) * @lbStep)
+ ((c + 1) * @lbScale),
4
) AS VARCHAR(14)),
' ',
CAST(ROUND(@lbY1 + ((6 - r + 1) * @lbScale), 4) AS VARCHAR(14)),
',',
CAST(ROUND(@lbX + ((@li - 1) * @lbStep) + (c * @lbScale), 4) AS VARCHAR(14)),
' ',
CAST(ROUND(@lbY1 + ((6 - r + 1) * @lbScale), 4) AS VARCHAR(14)),
',',
CAST(ROUND(@lbX + ((@li - 1) * @lbStep) + (c * @lbScale), 4) AS VARCHAR(14)),
' ',
CAST(ROUND(@lbY1 + ((6 - r) * @lbScale), 4) AS VARCHAR(14)),
'))'
),
0
).MakeValid() AS s
FROM @Font
WHERE ch = @lch
) q
WHERE s IS NOT NULL
AND s.STIsValid() = 1
AND s.STGeometryType() <> 'Point'
AND s.STArea() > 0.00001;
SET @li += 1;
END; -- Stamp "BLOCKER"
SET @li = 1;
WHILE @li <= LEN(@lbWord2)
BEGIN
SET @lch = SUBSTRING(@lbWord2, @li, 1);
INSERT INTO #graph
(
shape,
colour
)
SELECT s,
'hb_label'
FROM
(
SELECT geometry::STGeomFromText(
CONCAT(
'POLYGON((',
CAST(ROUND(@lbX + ((@li - 1) * @lbStep) + (c * @lbScale), 4) AS VARCHAR(14)),
' ',
CAST(ROUND(@lbY2 + ((6 - r) * @lbScale), 4) AS VARCHAR(14)),
',',
CAST(ROUND(
@lbX + ((@li - 1) * @lbStep)
+ ((c + 1) * @lbScale),
4
) AS VARCHAR(14)),
' ',
CAST(ROUND(@lbY2 + ((6 - r) * @lbScale), 4) AS VARCHAR(14)),
',',
CAST(ROUND(
@lbX + ((@li - 1) * @lbStep)
+ ((c + 1) * @lbScale),
4
) AS VARCHAR(14)),
' ',
CAST(ROUND(@lbY2 + ((6 - r + 1) * @lbScale), 4) AS VARCHAR(14)),
',',
CAST(ROUND(@lbX + ((@li - 1) * @lbStep) + (c * @lbScale), 4) AS VARCHAR(14)),
' ',
CAST(ROUND(@lbY2 + ((6 - r + 1) * @lbScale), 4) AS VARCHAR(14)),
',',
CAST(ROUND(@lbX + ((@li - 1) * @lbStep) + (c * @lbScale), 4) AS VARCHAR(14)),
' ',
CAST(ROUND(@lbY2 + ((6 - r) * @lbScale), 4) AS VARCHAR(14)),
'))'
),
0
).MakeValid() AS s
FROM @Font
WHERE ch = @lch
) q
WHERE s IS NOT NULL
AND s.STIsValid() = 1
AND s.STGeometryType() <> 'Point'
AND s.STArea() > 0.00001;
SET @li += 1;
END;
FETCH NEXT FROM hb_cur
INTO @hspid,
@hpx,
@hwait;
END;
CLOSE hb_cur;
DEALLOCATE hb_cur;
--------------------------------------------------------------------------------
-- 7) DUMMY + OUTPUT
--------------------------------------------------------------------------------
-- Dummy absorbs slot 4 (purple) — off-screen
INSERT INTO #graph
VALUES
(geometry::Point(-0.5, -0.5, 0).STBuffer(0.01).MakeValid(), 'dummy');
SELECT colour,
geometry::UnionAggregate(shape).Reduce(0.001).MakeValid() AS shape
FROM #graph
WHERE shape IS NOT NULL
AND shape.STIsValid() = 1
AND shape.STGeometryType() <> 'Point'
AND shape.STGeometryType() <> 'MultiPoint'
AND shape.STArea() > 0.00001
GROUP BY colour
ORDER BY CASE colour
WHEN 'axis' THEN
1
WHEN 'waitline' THEN
2
WHEN 'dot' THEN
3
WHEN 'dummy' THEN
4 -- absorbs purple slot
WHEN 'blocked_dot' THEN
5
WHEN 'countline' THEN
6
WHEN 'headblocker_dot' THEN
7
WHEN 'hb_label' THEN
8 -- HEAD BLOCKER text separate slot
ELSE
9
END;
DROP TABLE IF EXISTS #blocking;
DROP TABLE IF EXISTS #graph;
If it works it looks like this
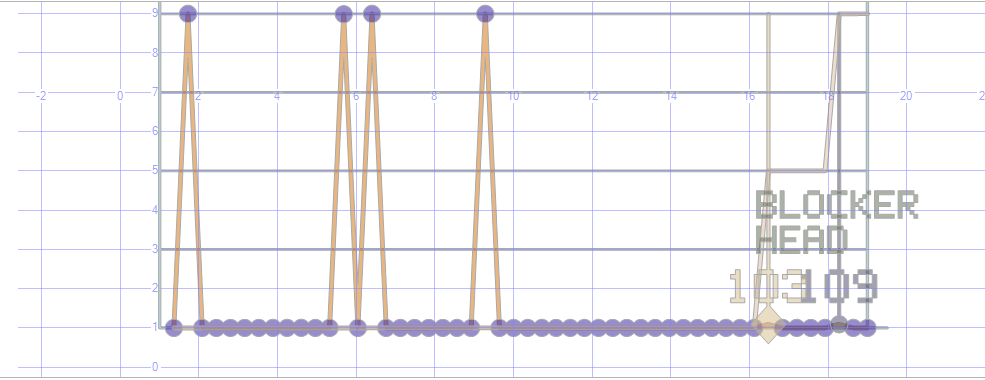
Run on
Credit Where It's Due
This started with Brent Ozar's How to Draw Line Graphs in SSMS — if you haven't read it, go and find it. He showed that SQL Server's spatial viewer could do practical data visualisation. I just took it sideways into blocking diagnostics via a slight detour through shamrocks and Easter eggs.
Thanks Brent. I think.
If you've made it this far through the SQL spatial art series — shamrocks, Guinness, Easter eggs, Christmas trees, and now a blocking visualiser — I genuinely don't know what to say other than: you are my kind of person, and your production server is probably fine.
Probably.
