As we briefly saw in the last article, Snowflake event tables can be used to capture telemetry about various parts of your Snowflake operation. Here, we’ll perform a deep dive into this useful Snowflake feature. Jump on to that springboard and dive in, the water’s lovely!
Introducing Event Tables
Look, no matter how sexy I try to make it sound, when all is said and done the event tables feature is just Snowflake’s way of capturing logs, trace events and metrics. This feature effectively does the same job log4net does in the .NET framework, log4j in Java, and Extended Events in SQL Server. So, on one hand, this is a really boring feature. But on the other hand, telemetry is massively important, especially in production systems. If something goes wrong, how can we figure out what the problem is without good telemetry? If something is working but isn’t performing as well as it might, wouldn’t logs help us out?
Of course they would, and in this article we’ll delve into how event tables can be used in Snowflake. We’ll even build a little demo. Metrics are quite language-specific, so we’ll deal with those in a future stairway step. Let the events begin!
Event Table Mechanics
Event tables are usually linked to the Snowflake account, and this applies to all Snowflake editions. Multiple event tables can exist, but only one can be active at any one time.
Snowflake Standard Edition only supports event tables for accounts, but Enterprise Edition allows you to link an event table to a database. If you therefore have ten databases on Enterprise Edition, you could have eleven active event tables – one per database, and one for the account. There is an order of precedence in this case. The events will always be written to the database event table first, but if no active database event table is present, the events will be written to the account event table instead.
Your Snowflake account comes with a default event table called snowflake.telemetry.events. This is linked to the entire Snowflake account. If you start capturing events but do not create your own event tables, all of the events will be written to the default table. This table is active by default. You can’t drop this table, it just exists. You can’t rename it either, but you can run ALTER EVENT TABLE against it to change things like the data retention policy.
One key thing to be aware of – you have no control of the event table schema. This leads to a slightly weird CREATE EVENT TABLE statement (more information a bit later), which does not allow the developer to specify column names.
It’s also worth being aware that event tables are not replicated. The information isn’t deemed to be mission-critical and not replicating saves money. Which is never a bad thing!
Why Should I Create My Own Event Tables?
So, Snowflake gives you an event table out of the box. Why should you bother creating your own then?! Seems a bit pointless, unless you’re using Snowflake Enterprise Edition and want to create event tables at a database level. But there are some valid reasons. Many data engineers and developers prefer to name their own objects, so it’s preferable to give the event table a name which is relevant to your account or organization.
You might also decide to partition off events using some sort of date scheme – by month, for instance. You could set up a scheduled task to create a new event table and activate it at midnight on the first of every month, maybe using a naming scheme like this:
- SSCEVENTS_202501
- SSCEVENTS_202502
- SSCEVENTS_202503
- SSCEVENTS_202504
- SSCEVENTS_202505
This allows you to compartmentalize your events, and you can also write something which automatically drops the tables after a specified amount of time.
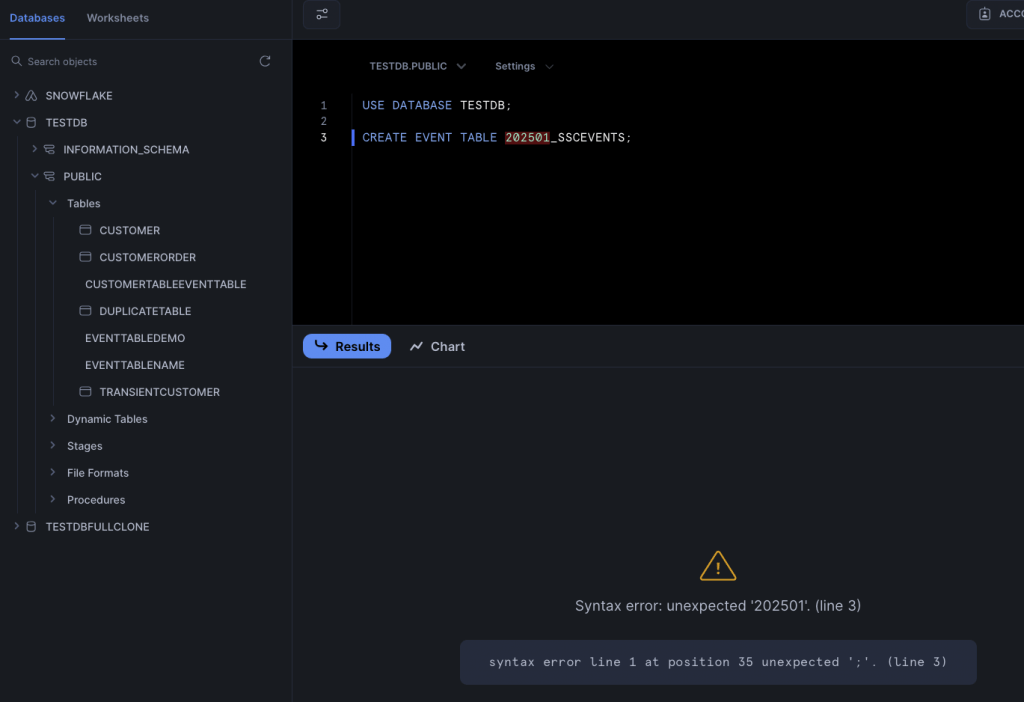
Event table names must start with a letter, and they shouldn’t contain spaces or special characters. Snowflake will allow spaces and special characters, but you will have to wrap the event table name in double quotes – ugh!
If you accidentally specify an event table name beginning with a number, Snowflake won’t tell you you’re breaking the rules – instead, it will just talk about the number being unexpected. Beware this rule!
The Difference Between Logs and Trace Events
We’ll look at some code (finally, you say!) in a minute. But before we start writing code to capture events, let’s figure out exactly what those events are!
Snowflake captures three types of event – a log entry, a trace event and a metric (as I said, we’re not dealing with metrics in this article). A log entry is something a developer creates as part of the code. When you write a stored procedure or function, you can add a call to snowflake.log() with the text you would like to record. We saw this in the last stairway step. You have to provide the logging level and the text:, here’s a JavaScript example:
snowflake.log("info", "Super-cool log message.");Logs aren’t particularly easy to query, unless you structure the text in a consistent fashion. This is prone to mistakes, especially if you are asking a team of developers to follow the same pattern (I’ve been there). Where logs excel is helping you to debug parts of your code when you’re building new functionality, or when you are investigating bugs.
Of course, the more logs you capture, the more storage you need, and the more cost you incur with Snowflake. You can set the minimum log info level to determine what events will be captured. You could set the log level to ERROR to stop INFO and WARN logs being captured, but turn the log level back to INFO if users report issues with the system and you need additional detail.
Traces are a completely different kettle of fish. These execute over multiple parts of your code, allowing you to obtain information in a structured manner across various components.
Trace events follow a structured format, which makes them easy to query. There is a trace level, which can be used to configure which level of traces can be captured, much the same as the log level.
Setting Log and Trace Levels
The log level and trace level can all be set individually. The log levels are:
- TRACE
- DEBUG
- INFO
- WARN
- ERROR
- FATAL
- OFF (default)
TRACE is the bottom-most level. If this is set, all other log levels will be captured. DEBUG captures everything from DEBUG down, INFO captures everything from INFO down, and WARN captures WARN, ERROR and FATAL. ERROR captures FATAL, whilst (slightly confusingly) FATAL also captures ERROR, but only for Java objects and Scala stored procedures.
As you may expect, OFF means no traces will be captured.
The trace levels are much simpler:
- ALWAYS
- ON_EVENT
- OFF
ALWAYS, unsurprisingly, captures all traces when this trace level is set. ON_EVENT only captures events explicitly added to stored procedures or UDFs. And of course, OFF turns off trace capture.
Snowflake is quite flexible when it comes to determining the objects events should be captured for. All three event types can be set against various Snowflake objects:
- The account level
- Database or schema level, or individual object (e.g. function, stored procedure)
- Session level
Snowflake use a hierarchy to determine which level is in effect.
- If a telemetry level is set on the session level, this overrides any levels set for the user or account level. The user level overrides the account level
- If the telemetry level is set for an object (e.g. a stored procedure), this overrides any levels set for the schema, database or account. The schema level overrides the database level, and the database level overrides the account level
We’ll see this in action shortly!
Unhandled Exceptions
After you’ve created an event table, Snowflake will, by default, capture unhandled exceptions that occur when your stored procedures or functions are running.
Unhandled exceptions can be captured as logs, traces, or both. We’ll see a demo of this soon.
Permissions
Just one more thing to mention before we see some code…what permissions do you need to mess about with these here event tables? There are two roles, the names of which seem self-explanatory but are a little more nuanced:
- EVENTS_VIEWERThis allows users with the role applied to run SELECT statements against the EVENTS_VIEW view (we’ll see this view later). This role does not have direct access to the event table.
- EVENTS_ADMINAs an admin role, this DOES give access to the table. Users with this role can SELECT, TRUNCATE and DELETE from this table. Users can also SELECT from the EVENTS_VIEW view, as well as use the two special stored procedures which can add or drop row access policies on the event view (more later – we’re storing up quite a bit for later!).
Creating Event Tables
At last, some code! Here’s what is pretty much the simplest SQL statement you can use to create an event table.
CREATE OR REPLACE EVENT TABLE PUBLIC.SSCEVENTS_202502;
CREATE EVENT TABLE does support some additional options. You can specify the retention period for data (in days), you can enable or disable change tracking, and you can even clone an existing event table. If you try to clone a non-event table, Snowflake will politely tell you to make like a tree, and get out of here.
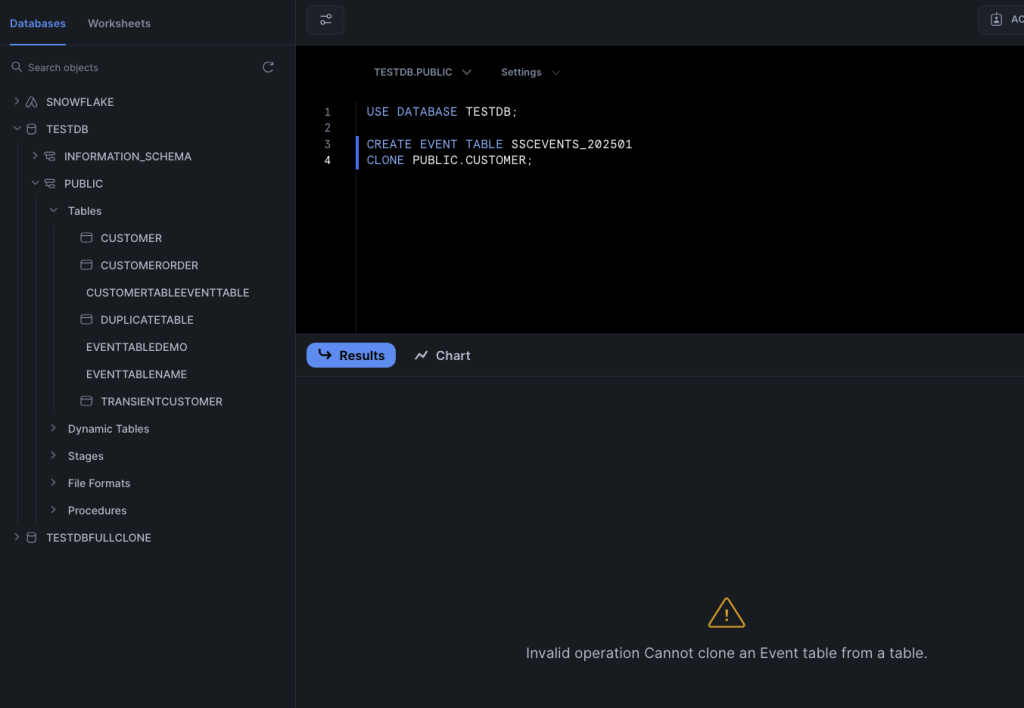
As every event table always has the same event schema, you might be wondering why you would bother cloning one. One good reason is to copy the grants and row access policies you’ve assigned to the event table you’re cloning, which could save a good bit of repetitive work.
With CREATE EVENT TABLE executed, you’re done, right? Wrong (of course)! When you create a new event table, it won’t be used – until you tell Snowflake to make it active. To make an event table active for an account, use this command:
ALTER ACCOUNT SET EVENT_TABLE = PUBLIC.SSCEVENTS_202502;
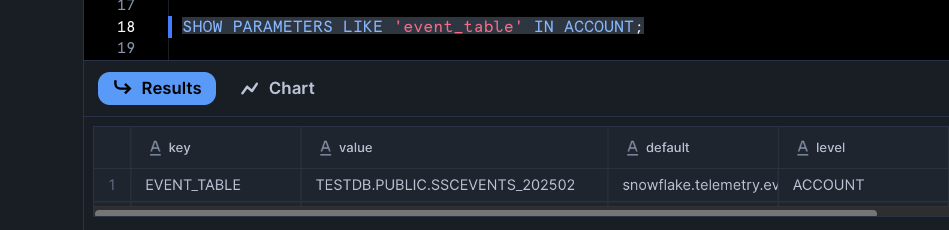
Short of firing some events into the table, how can you prove this event table has indeed been made active? With the SHOW PARAMETERS command:
SHOW PARAMETERS LIKE 'event_table' IN ACCOUNT;
The value column shows you the name of the active event table.
If you’re lucky enough to have access to Snowflake Enterprise Edition, here’s the command to assign an event table to a database:
ALTER DATABASE MY_DB SET EVENT_TABLE = MY_DB.MY_SCHEMA.MY_EVENT_TABLE;
We’ll be using the account in the rest of this article – I’m a poor unfortunate who only has access to standard edition!
Altering Event Tables
You can alter event tables. You may be wondering what’s the point of altering an event table? It doesn’t have any columns. But there are still some useful things you can change. You might want to rename your event table:
ALTER TABLE IF EXISTS PUBLIC.SSCEVENTS_202502 RENAME TO PUBLIC.SSEVENTS_NEWNAME;
If you do this on the active event table, Snowflake will NOT update the event table property on any accounts or databases using the event table. You will need to run the ALTER ACCOUNT SET EVENT_TABLE statement again.
What else can ALTER TABLE do? You can use it to change the clustering action, change the data governance policy, and change the search optimization action. You can also change settings such as the data retention policy and change tracking.
One key thing you may use ALTER TABLE for is to unset an event table. Here’s the command:
ALTER ACCOUNT UNSET EVENT_TABLE;
This will reset the event table for the account back to the default snowflake.telemetry.events table.
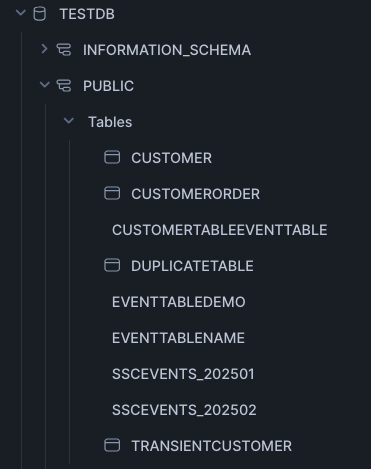
Viewing Event Tables
You can see what event tables exist within your Snowflake system using Snowsight. You can see them in the Tables list, although you cannot view any metadata about the table. The event tables do not display an icon next to their names.
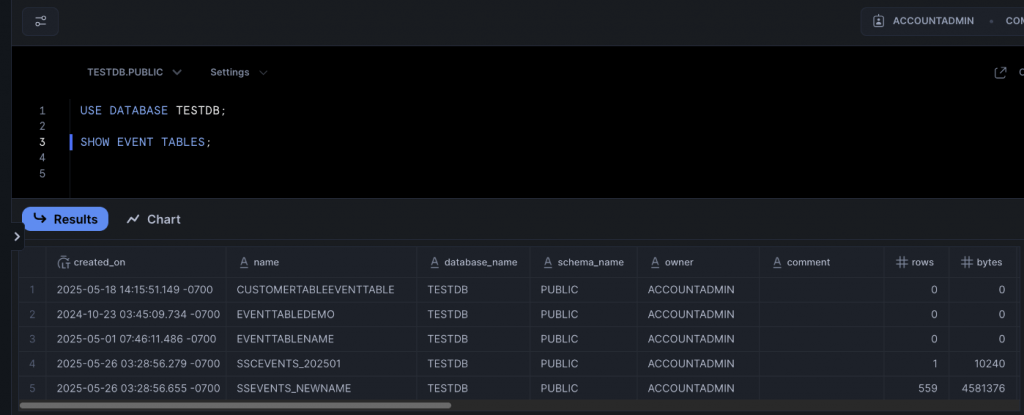
However, if you use the SHOW EVENT TABLES command, you can see all of the information Snowflake holds about each event table.
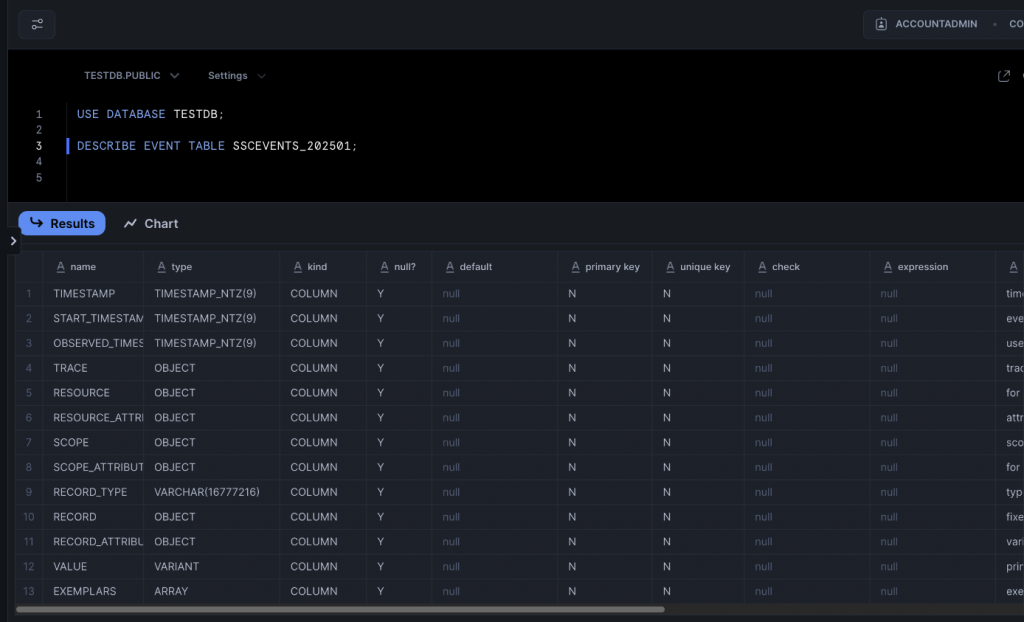
You can also use DESCRIBE EVENT TABLE <name> to view the columns for an event table. This will return the same result for every single event table, as it lists the column set – which we cannot amend!
Dropping an Event Table
I suspect you won’t be shocked when you see the command to drop an event table:
DROP EVENT TABLE PUBLIC.SSEVENTS_NEWNAME;
This wipes out the entire event table, data, the lot. So be careful!
Preparing for Event Capture
At last, we come to the main demo in this article. Sorry it took a while! There are a few things to do before we can capture events:
- Create an event table.
- Make the event table active.
- Create appropriate objects, such as stored procedures or functions, in your preferred language (we’ll use SQL here).
- Add logging or tracing to your code object.
- Run your code.
- Be wowed by the events captured in your event table!
We’ll run all of this in a database called TESTDB. Here’s the command you need to create it if you don’t already have such a database:
CREATE DATABASE IF NOT EXISTS TESTDB;
And here is the code to create a newly enabled event table.
USE DATABASE TESTDB; CREATE EVENT TABLE IF NOT EXISTS PUBLIC.SSC_EVENTS; ALTER ACCOUNT SET EVENT_TABLE = TESTDB.PUBLIC.SSC_EVENTS;
Remember the event table name must be fully qualified when you pass it to ALTER ACCOUNT!
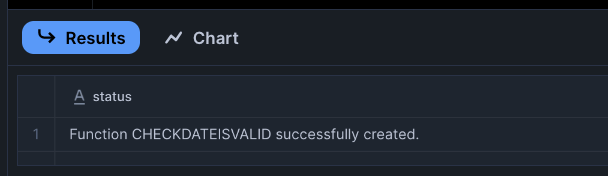
With the event table in place, we need a code object so we can practice our logging. Here’s a stored procedure which validates an input value. Yes, it’s a bit contrived and could easily be a function, but let’s just go with it.
You can use logging with the supported Snowflake languages Java, JavaScript, Python, Scala and SQL. We’re just concentrating on SQL here.
USE DATABASE TESTDB;
CREATE OR REPLACE PROCEDURE PUBLIC.CheckDateIsValid(dateToCheck VARCHAR)
RETURNS BOOLEAN NOT NULL
LANGUAGE SQL
AS
BEGIN
-- Assume date to be false
LET dateIsValid BOOLEAN := FALSE;
IF(TRY_TO_DATE(dateToCheck) IS NOT NULL) THEN
dateIsValid := TRUE;
ELSE
dateIsValid := FALSE;
END IF;
SYSTEM$LOG('info', 'CheckDateIsValid ran successfully.');
RETURN dateIsValid;
END;This stored procedure does nothing special. It takes an input parameter (dateToCheck), and tries to parse it as a date. If the value is a valid date, happy days are here and TRUE is returned. Otherwise, it’s a rainy day and FALSE is returned.
The code isn’t doing anything with the different values yet; but it is calling the SYSTEM$LOG function, which records a log entry every single time the stored procedure runs. This could become very old, very quickly! But we’ll change it soon.
Capturing Logs
Let’s try capturing different types of log. You may recall that Snowflake supports a variety of logging levels. We can use SYSTEM$LOG to capture all of these, here are a few examples:
SYSTEM$LOG('info', 'This is an info message. Go figure.');
SYSTEM$LOG('error', 'This is an error message. It''s all gone wrong!');
SYSTEM$LOG('warning', 'This is a warning message. Be careful!');
SYSTEM$LOG('trace', 'This is a trace message. We’’re watching you…');
SYSTEM$LOG('fatal', 'This is a fatal message. Bang!');But, good old Snowflake has given us some alternative logging commands for our SQL code. These statements are equivalent to the statements above, which format you use is personal preference. Just be consistent!
SYSTEM$LOG_INFO('This is an info message. Go figure.');
SYSTEM$LOG_ERROR('This is an error message. It''s all gone wrong!');
SYSTEM$LOG_WARNING('This is a warning message. Be careful!');
SYSTEM$LOG_TRACE('This is a trace message. We’’re watching you…');
SYSTEM$LOG_FATAL('This is a fatal message. Bang!');Here’s an amended version of our stored procedure, which captures info and error logs.
USE DATABASE TESTDB;
CREATE OR REPLACE PROCEDURE PUBLIC.CheckDateIsValid(dateToCheck VARCHAR)
RETURNS BOOLEAN NOT NULL
LANGUAGE SQL
AS
BEGIN
-- Assume date to be false
LET dateIsValid BOOLEAN := FALSE;
IF(TRY_TO_DATE(dateToCheck) IS NOT NULL) THEN
dateIsValid := TRUE;
SYSTEM$LOG_INFO('Date: ' || :dateToCheck || ' is valid.');
ELSE
dateIsValid := FALSE;
SYSTEM$LOG_ERROR('Invalid date value: ' || :dateToCheck);
END IF;
RETURN dateIsValid;
END;We’ve ditched the original SYSTEM$LOG call and replaced it with two specific calls – a SYSTEM$LOG_INFO call when the date is successfully converted, and a SYSTEM$LOG_ERROR call when things, well, don’t go so well! In a new Snowflake code window, we will run this procedure twice:
USE DATABASE TESTDB;
CALL PUBLIC.CheckDateIsValid('2025-10-10');
CALL PUBLIC.CheckDateIsValid('Bad date');We can run this statement to check if the logs have been captured in our event table. This may take a good few seconds; events are captured asynchronously, so they don’t instantaneously appear in the event table once you’ve executed your code.
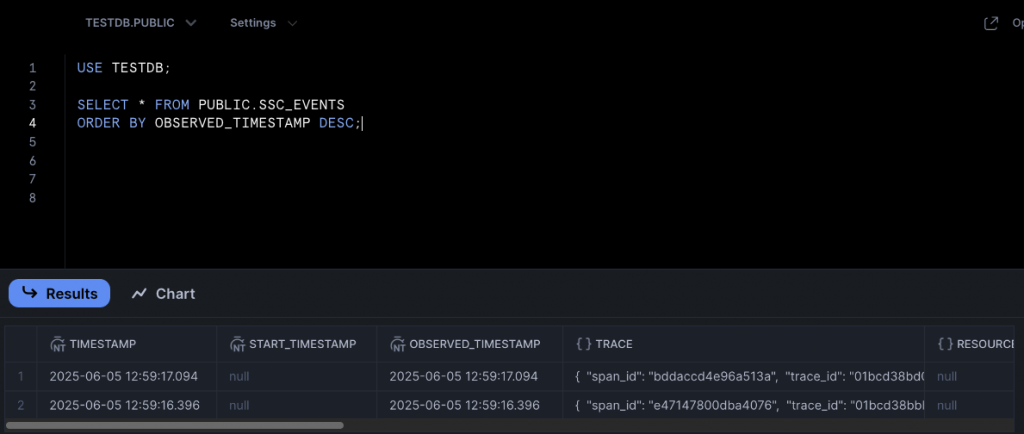
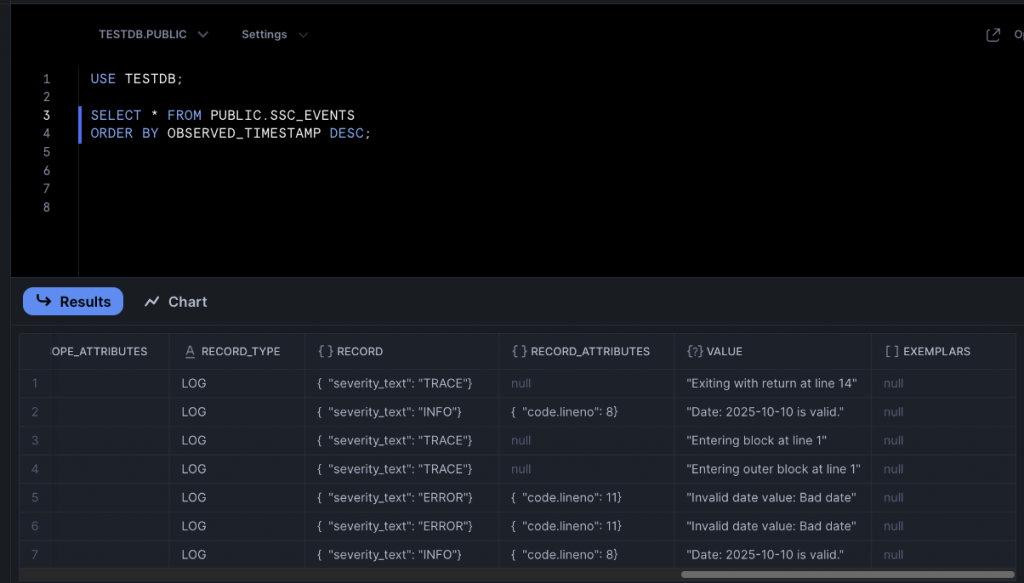
USE TESTDB; SELECT * FROM PUBLIC.SSC_EVENTS ORDER BY OBSERVED_TIMESTAMP DESC;
Running this once the table has been populated should leave us with two log records, one good, one bad.
Event Table Columns
We haven’t looked at the columns in the event table yet, but let’s look at some of them now. A detailed run-down of the columns is available on Snowflake’s documentation Web site.
The TIMESTAMP column records when the event was created. BUT! This column can have a double meaning. If it’s a log, no problem – it’s the timestamp when the log was created. But if you’ve created a trace event covering a span of time, this represents the end of the span of time. The START_TIMESTAMP is used to denote when the span of time started. START_TIMESTAMP is null for log entries.
OBSERVED_TIMESTAMP, however, is only used for logs – it stores the UTC timestamp. This value matches the TIMESTAMP value.
The TRACE field gives you a piece of JSON holding context data for all event types – span_id and trace_id. You can use these to filter events for a certain trace.
RESOURCE_ATTRIBUTES is an important column – it’s where Snowflake stores the metadata about the event source, again as a piece of JSON. The image shows the output for the INFO log we just captured. If you looked at the same column for the DELETE log, you wouldn’t notice much difference outside of the query id.
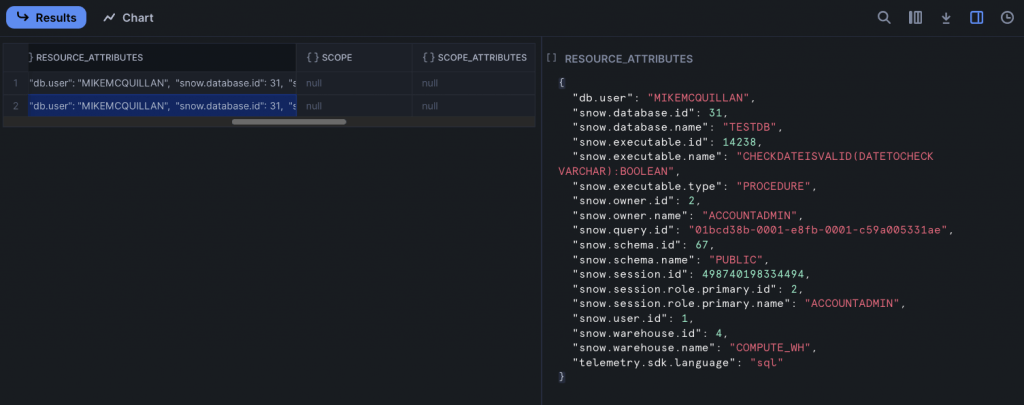
This is key information which can really help with things like debugging. The snow.executable.name field is telling us the name of the object involved in the log, and snow.executable.type is telling us this log was raised by a stored procedure.
The RECORD_TYPE denotes the type of event raised – LOG, in this case. RECORD holds more JSON, which differs depending upon the event type. For a log, it stores the log level. Here’s a JSON sample:
{ "severity_text": "ERROR" }This column stores different values for metrics and traces, which we’ll see soon. RECORD_ATTRIBUTES also holds different JSON depending upon the event type – it’s just captured the code.lineno which fired the logging call here, but it could also hold exception information and more metadata about the code.
The final column mentioned here is VALUE, which actually stores the message we logged.
Changing the Log Level
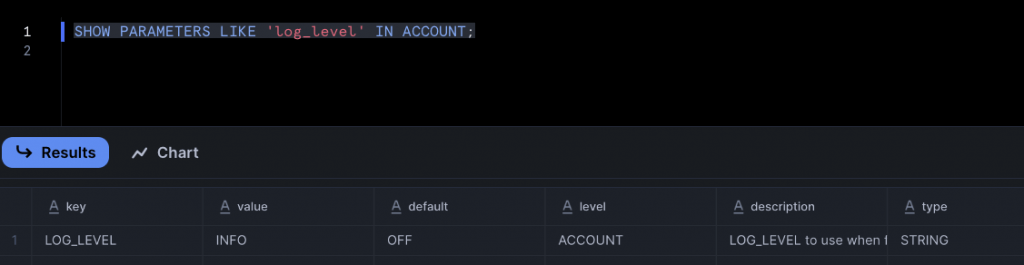
We talked earlier about the various log levels Snowflake supports. In our current example, INFO will capture both INFO and ERROR events, but ERROR will not capture the INFO events. We can see what the current log level is set to using SHOW PARAMETERS:
SHOW PARAMETERS LIKE 'log_level' IN ACCOUNT;
This tells us we’re using the default INFO level.
We can change the log level in a variety of places – just to reiterate, we can set the log level at the account level, database level, schema level, session level or even against a specific object. To change the log level for our stored procedure to ERROR, we’d run this:
USE DATABASE TESTDB; ALTER PROCEDURE PUBLIC.CheckDateIsValid(VARCHAR) SET LOG_LEVEL = ERROR;
You have to specify the data types for the parameters, otherwise you’ll run into trouble. To change the log level for the entire account to ERROR, we’d run this:
USE DATABASE TESTDB; ALTER ACCOUNT SET LOG_LEVEL = ERROR;
We can check the changes with good old SHOW PARAMETERS again. The value column has changed to ERROR.
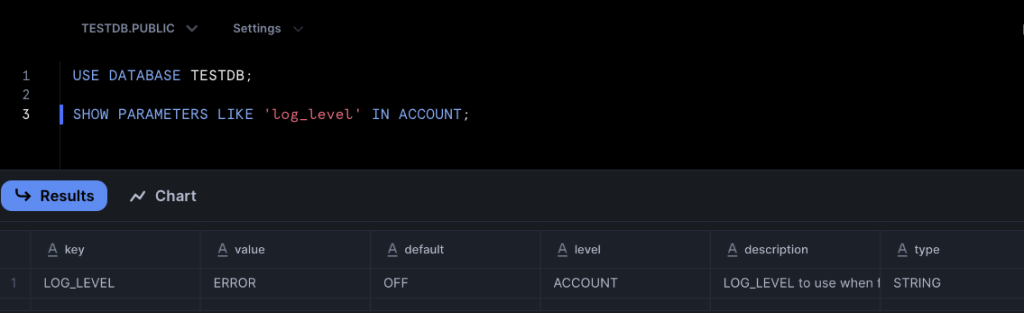
And all of this means we end up with just one extra line in the event table after executing the two stored procedure call lines! Lucky us.
CALL PUBLIC.CheckDateIsValid('2025-10-10');
CALL PUBLIC.CheckDateIsValid('Bad date');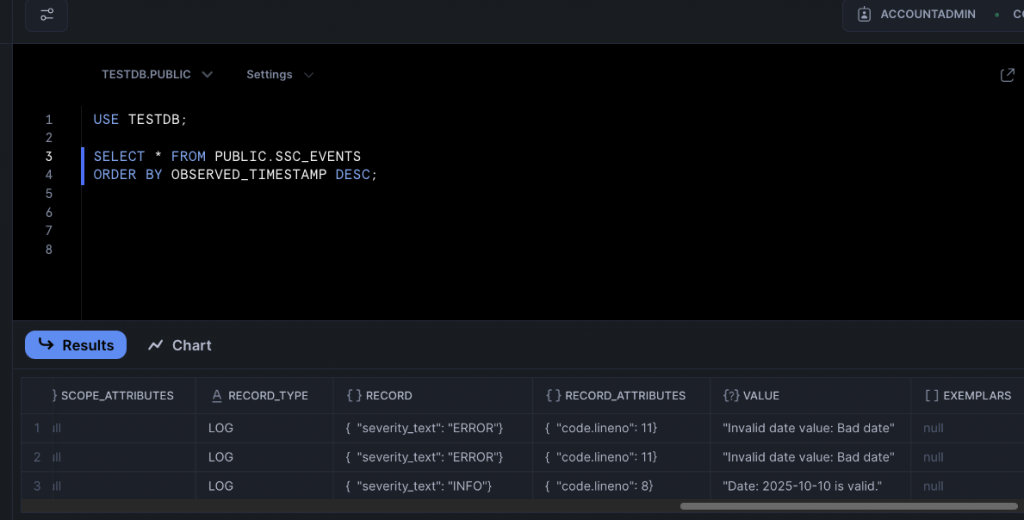
Automatic Logging
Snowflake also supports automatic logging for stored procedure execution. This captures additional log messages without having to modify the body of the procedure. The log level needs to be set to TRACE for these logs to be captured.
USE DATABASE TESTDB; ALTER PROCEDURE PUBLIC.CheckDateIsValid(VARCHAR) SET LOG_LEVEL = TRACE;
With this set, all that’s left to do is set the AUTO_EVENT_LOGGING parameter of the ALTER PROCEDURE command to LOGGING or ALL.
USE DATABASE TESTDB; ALTER PROCEDURE PUBLIC.CheckDateIsValid(VARCHAR) SET AUTO_EVENT_LOGGING = 'ALL';
After executing the SP just once:
CALL PUBLIC.CheckDateIsValid('2025-10-10');We can take a look at the event table (after, of course, a suitable delay!).
The first four lines show us what Snowflake has captured automatically (apart from line two, which is our custom log). Very useful for debugging!
To turn this feature off, just set AUTO_EVENT_LOGGING to OFF.
Capturing Exceptions
Despite their seemingly simple intention, you might have guessed by now that Snowflake event tables are pretty comprehensive! And we’re not done with logging yet! Snowflake can be configured to capture information about unhandled exceptions. These can be captured as logs, trace events, or both.
The log level has to be set at least ERROR for this feature, and the trace level must be set to ALWAYS or ON_EVENT.
When these events are captured, appropriate exception details are recorded in the RECORD_ATTRIBUTES column. The exception itself will be stored in the VALUE column.
The stored procedure sets the dateIsValid variable to TRUE if the specified date is valid:
dateIsValid := TRUE;
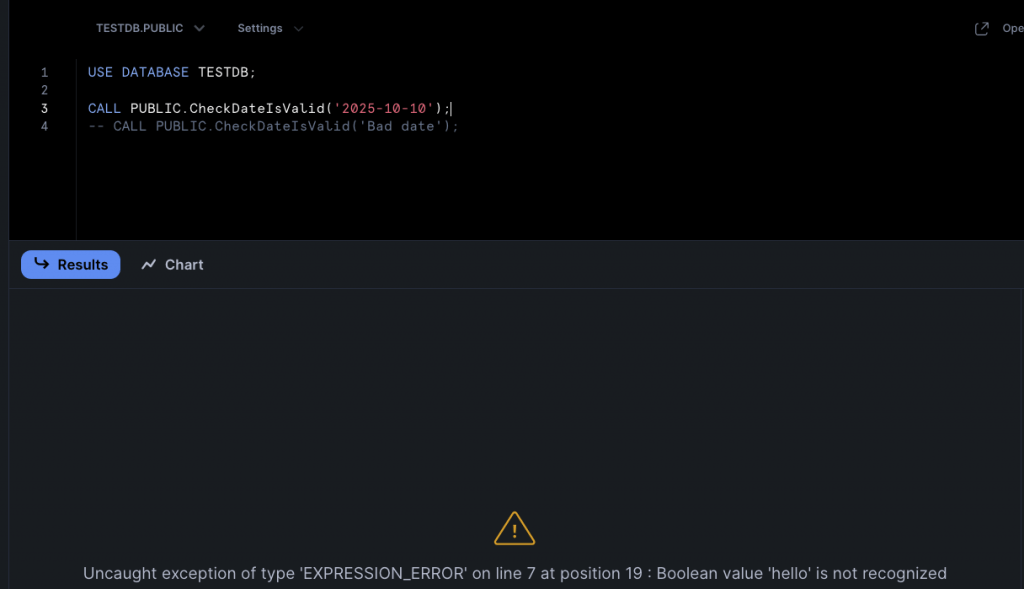
Changing this to ‘hello’ may seem crazy, but hey! Snowflake compiles it, so what do we care:
dateIsValid := 'hello';
A quick execution of the stored procedure causes Snowflake to throw a tantrum:
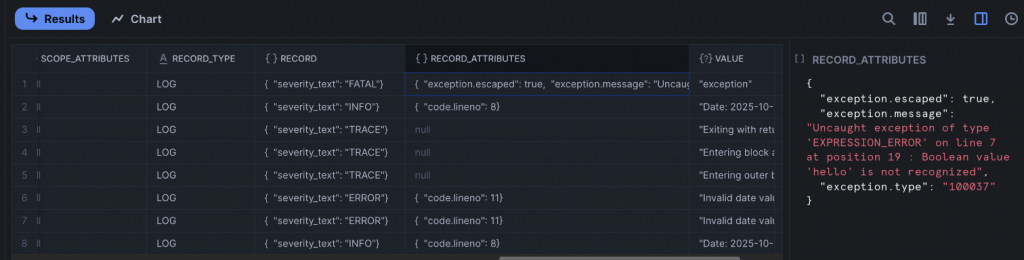
And checking the contents of the event table shows the unhandled exception has indeed been captured.
Querying the RECORD and RECORD_ATTRIBUTES Columns
Our querying of the event table has been pretty simple so far; we’ve just been running SELECT *. Which, of course, is the first thing you’re taught not to do in Database 101! But we all do it, don’t we?
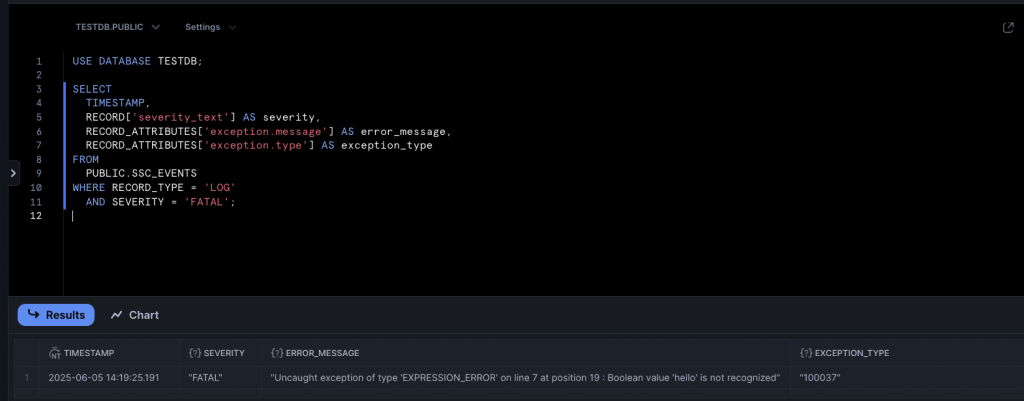
SELECT * doesn’t help much if we want to delve into the JSON columns. Snowflake provides us with the ability to pull out individual values from the JSON, using square brackets. Here’s a query which displays specific information about the exception we just captured.
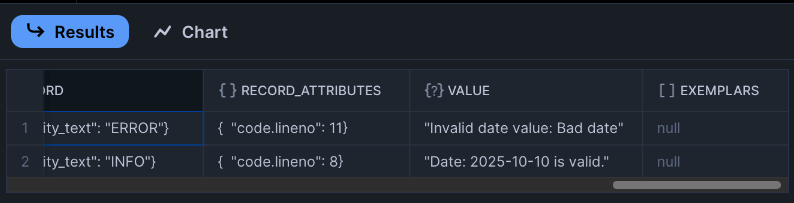
USE DATABASE TESTDB; SELECT TIMESTAMP, RECORD['severity_text'] AS severity, RECORD_ATTRIBUTES['exception.message'] AS error_message, RECORD_ATTRIBUTES['exception.type'] AS exception_type FROM PUBLIC.SSC_EVENTS WHERE RECORD_TYPE = 'LOG' AND SEVERITY = 'FATAL';
A quick execution and we obtain the values. Nice result!
Tracing
Snowflake trace events, like logs, capture when something happens. The difference is trace events are structured, meaning they can be analyzed in a more meaningful way than the potentially random log entries. Key-value pairs, stored as JSON, can be captured and then queried later.
Traces use something called a span. This represents an entire operation and captures when the operation started and finished. Snowflake captures trace events in the standardized OpenTelemetry data format.
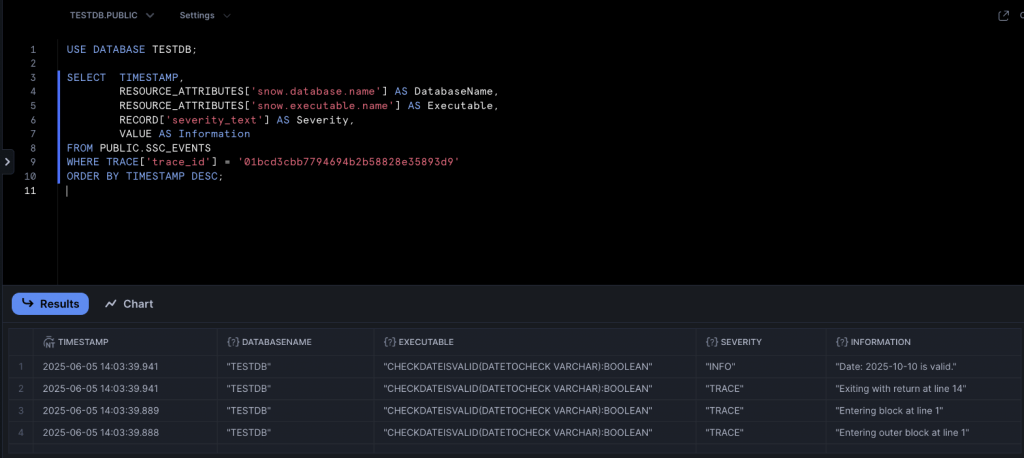
Trace events are only emitted when the element being traced completes; if the code fails to complete, there’s a good chance the trace event will not be emitted. A span is represented as a single row in the event table. This means a trace event may cause multiple rows to be added to the event table. Fear not! The trace_id value in the TRACE column can be queried to grab all the rows related to an individual trace. You didn’t know it, but we’ve already seen this in action when we turned on automatic logging. If you go back and take a look, you’ll see the trace_id value for several rows is the same. Here’s a query which pulls out all of the rows for one of the traces we ran earlier.
USE DATABASE TESTDB; SELECT TIMESTAMP, RESOURCE_ATTRIBUTES['snow.database.name'] AS DatabaseName, RESOURCE_ATTRIBUTES['snow.executable.name'] AS Executable, RECORD['severity_text'] AS Severity, VALUE AS Information FROM PUBLIC.SSC_EVENTS WHERE TRACE['trace_id'] = '01bcd3cbb7794694b2b58828e35893d9' ORDER BY TIMESTAMP DESC;
The WHERE clause is the key to all this. The statement returns some nicely formatted data.
A span does have some limitations – it can hold a maximum of 128 trace events, and 128 attributes. I’d be interested in seeing your code if you’re hitting these limits!
Adding Tracing to Objects
Let’s change our stored procedure to output a trace event. Adding traces to objects isn’t particularly different to adding logs. We’re using SYSTEM$LOG to add logs. For trace events, we use SYSTEM$ADD_EVENT. You cannot create custom spans for SQL objects – but you can for Java, Python, JavaScript and Scala objects. We’ll see these languages in action in future Stairway Steps, which is when we’ll also cover custom spans.
Snowflake uses two record types when capturing traces. A SPAN_EVENT represents one single trace event, whilst a SPAN represents the invocation of a stored procedure or function.
We can modify the stored procedure we created earlier, replacing the logging lines with a trace event.
USE DATABASE TESTDB;
CREATE OR REPLACE PROCEDURE PUBLIC.CheckDateIsValid(dateToCheck VARCHAR)
RETURNS BOOLEAN NOT NULL
LANGUAGE SQL
AS
BEGIN
LET inputAttributes := {'dateToCheck': dateToCheck};
SYSTEM$ADD_EVENT('CheckDateIsValid_exec', inputAttributes);
-- Assume date to be false
LET dateIsValid BOOLEAN := FALSE;
IF(TRY_TO_DATE(dateToCheck) IS NOT NULL) THEN
dateIsValid := TRUE;
SYSTEM$SET_SPAN_ATTRIBUTES({'dateIsValid': TRUE});
ELSE
dateIsValid := FALSE;
SYSTEM$SET_SPAN_ATTRIBUTES({'dateIsValid': FALSE});
END IF;
RETURN dateIsValid;
END;The procedure now begins with these two lines:
LET inputAttributes := {'dateToCheck': dateToCheck};
SYSTEM$ADD_EVENT('CheckDateIsValid_exec', inputAttributes);The first line is just a variable which declares a key-value pair to store the procedure’s input parameter. The second line actually creates the event, which will cause a SPAN_EVENT row to be added to the event table, denoting the start of the event. Passing in the attributes is optional, but if your code does utilize attributes of any sort it’s advisable to include them in the trace. Otherwise, how will you know which values the code was using when it executed?!
The logging lines have gone, but will never be forgotten. Actually, maybe they will, as we’re now using super-cool and hip spans!
SYSTEM$SET_SPAN_ATTRIBUTES({'dateIsValid': TRUE});There are two calls to this function, one for when the value is valid, and one for when it isn’t. This records a SPAN row, which will show the output value from the procedure in the RECORD_ATTRIBUTES column.
It’s time to fire this up! We can utilize our ubiquitous CALL statements again:
USE DATABASE TESTDB;
CALL PUBLIC.CheckDateIsValid('2025-10-10');
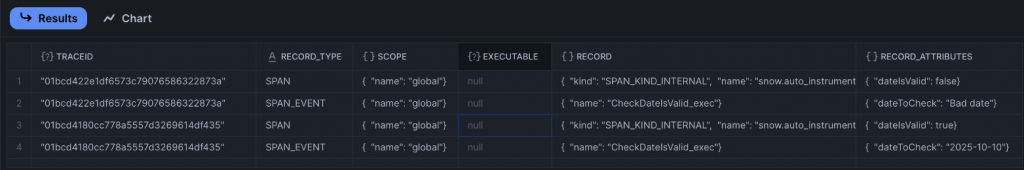
CALL PUBLIC.CheckDateIsValid('Bad date');And with these commands safely executed, we can spend a few seconds typing up a new SELECT query for the event table, which should coincidentally be populated with our span data by the time we’ve finished typing!
SELECT TRACE['trace_id'] AS TraceId,
RECORD_TYPE,
SCOPE,
RESOURCE_ATTRIBUTES['snow_executable_name'] AS Executable,
RECORD,
RECORD_ATTRIBUTES
FROM PUBLIC.SSC_EVENTS
WHERE RECORD_TYPE IN ('SPAN', 'SPAN_EVENT')
ORDER BY TIMESTAMP DESC;Running this will (eventually!) display our trace events.
Checking and Changing the Trace Level
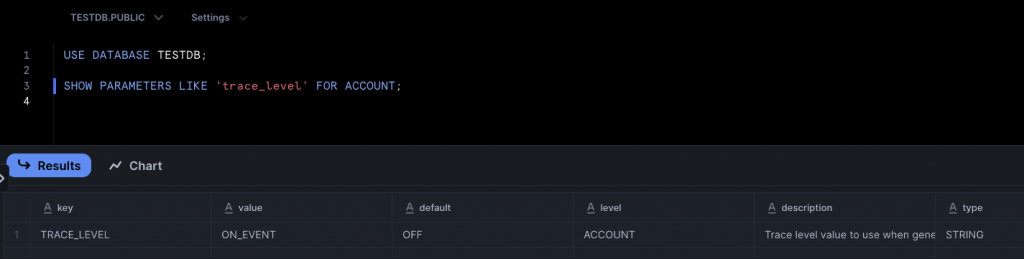
We looked at the three tracing levels earlier. Tracing is either off, always on, or just captures explicit traces raised from procedures and functions. To check the tracing level for an account:
SHOW PARAMETERS LIKE 'trace_level' FOR ACCOUNT;
And to check it for a procedure:
SHOW PARAMETERS LIKE 'trace_level' FOR PROCEDURE PUBLIC.CheckDateIsValid(VARCHAR);
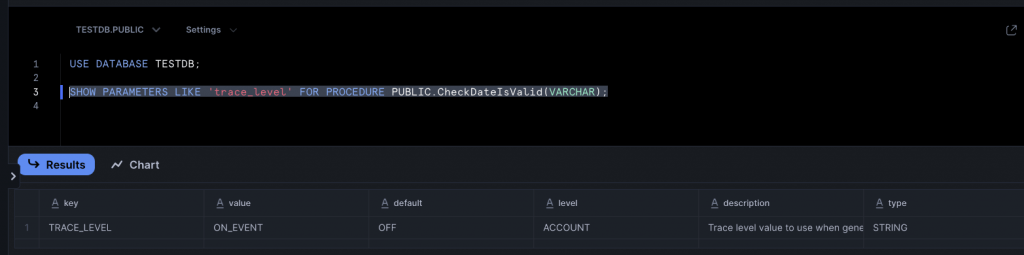
Changing the trace level is pretty much the same process used to change the log level, using the appropriate ALTER statement.
The account:
ALTER ACCOUNT SET TRACE_LEVEL = 'ALWAYS';
And the procedure:
ALTER PROCEDURE PUBLIC.CheckDateIsValid(VARCHAR) SET TRACE_LEVEL = 'ALWAYS';
Capturing Unhandled Exceptions as Trace Events
Not too long ago (or maybe it feels like forever!), we captured unhandled exceptions as log entries. But we can also capture them as trace events too! Let’s turn off logging and just capture unhandled exceptions as traces.
To turn off logging for the stored procedure and to ensure the trace level is set to ALWAYS, we can use these statements:
USE DATABASE TESTDB; ALTER PROCEDURE PUBLIC.CheckDateIsValid(VARCHAR) SET TRACE_LEVEL = 'ALWAYS'; ALTER PROCEDURE PUBLIC.CheckDateIsValid(VARCHAR) SET LOG_LEVEL = 'OFF';
Logging is still enabled at the account level, so we should still see a log once we’ve finished this demo.
We now need to introduce some bad code into the stored procedure again. Under the IF statement, change the line:
dateIsValid := TRUE;
to:
dateIsValid := 'hello';
Run the stored procedure to commit the changes.
Next, run this statement to call the stored procedure:
CALL PUBLIC.CheckDateIsValid('2025-10-10');This will cause Snowflake to raise a complaint:
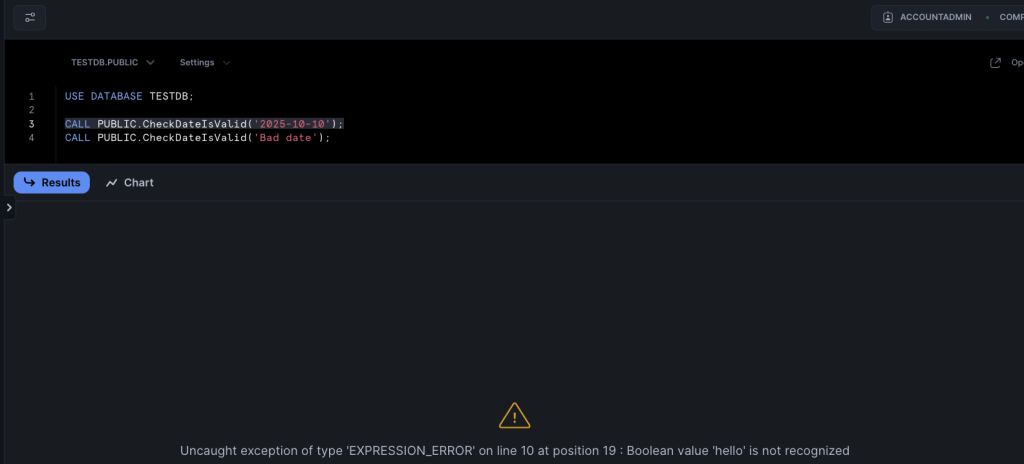
And if you then run this query against the event table:
SELECT * FROM PUBLIC.SSC_EVENTS ORDER BY TIMESTAMP DESC;
You’ll see four events have been captured.
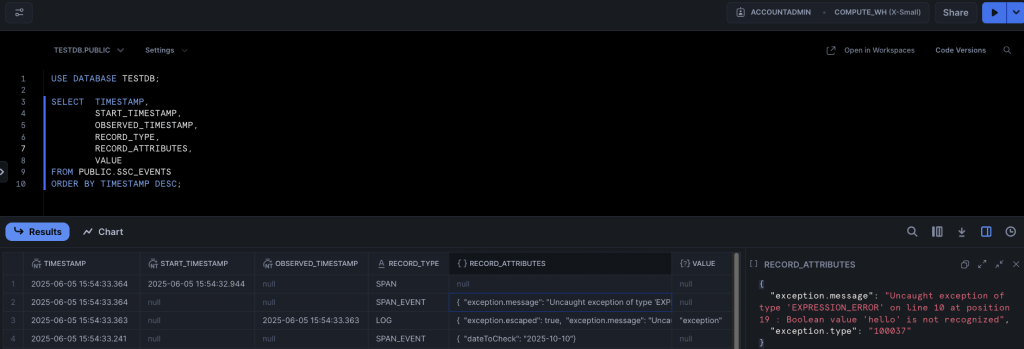
These events are:
- The SPAN_EVENT that we added to denote the stored procedure had started. We expected this line to be present
- A FATAL log line, which captures the exception. This is not part of our trace, but we did say earlier that Snowflake captures unhandled exceptions as both logs and traces, so we expected to see this
- A second SPAN_EVENT, which is the automatic unhandled exception event kicking in. This stores the exception detail
- A SPAN, which tells us an error occurred
And that’s just about it for this intro to trace events!
The Event View
Way back at the start of this article, we mentioned the event view. This is a simple view over events which have been captured in the default event table. It does NOT show events captured in custom event tables – you’ll need to grant permissions to custom event tables separately.
If you’re using the default event table, the view allows you to grant users access to the events. There are two stored procedures which allow you to manage access via row access policies:
The view is somewhat limited, being as it only covers the default event table. You can use the row access policy to limit the columns users with the granted role can see. To do this, you need to:
- Create a new row event policy
- Call the ADD_ROW_ACCESS_POLICY_ON_EVENTS_VIEW procedure, passing the name of the row event policy, and the names of the columns you want to be included in the policy
- Assign the role to the desired users
Row access policies are only available in Enterprise Edition. You may be better off rolling your own views, ensuring your users cannot access the event table, and then granting SELECT access on the custom view.
How Much Does Telemetry Cost?
I’m reluctant to put costs directly into the article, as they’re liable to change. I can guarantee that whatever I put here will be out of date in next to no time! So, with apologies for the cop-out, take a look at Snowflake’s cost article, which will point you in the right direction.
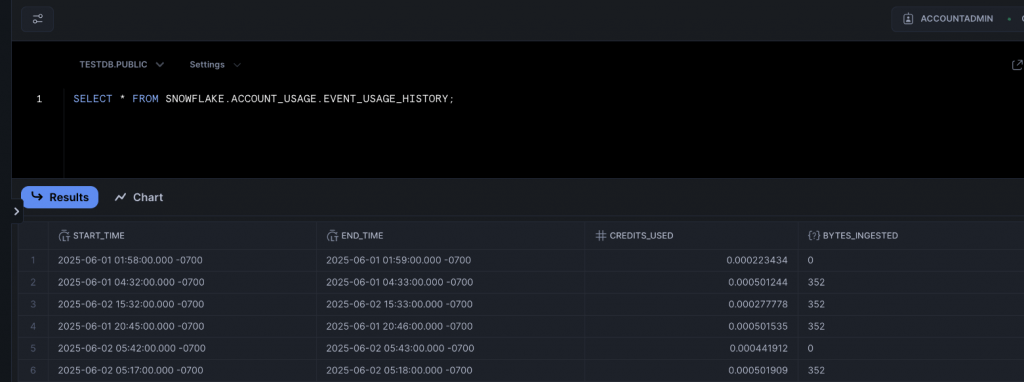
The main thing you should take away is that the EVENT_USAGE_HISTORY view will tell you how many credits have been billed for event handling, for a particular period. Query this and you should be able to figure out your costs. Here’s the statement:
SELECT * FROM SNOWFLAKE.ACCOUNT_USAGE.EVENT_USAGE_HISTORY;
And here are the credits my account has used!
Summary
I appreciate this hasn’t been a short article, but hopefully you have found it comprehensive! We’ve done a pretty deep dive into event tables here, and we’ve covered off how Snowflake can capture logs and trace events. Next time you’re debugging some code in Snowflake, or investigating a problem, have a think about these features and maybe they’ll help you out.
We’ll keep the table theme going in our next Stairway to Snowflake step, when we look at the always exciting world of dynamic tables! See you next time.