

Introduction
In SQL Server and other Microsoft programs, it is possible to measure the performance using
Requirement
- SQL Server with Data mining Installed (version 2005 or later)
- We are using Windows 2012 R2, but we will give some tips for earlier versions.
- A data mining model. In this sample, we will use the famous AdventureWorks, but other data mining models can be used.
Getting Started
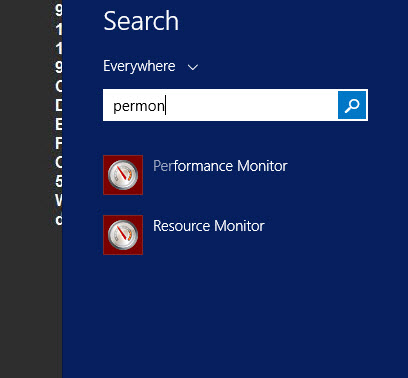
Start the Performance Monitor. You can use the Windows Search to find it.
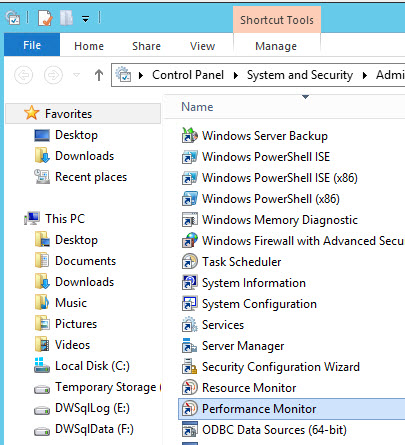
Alternatively, you can go to the Administrative Tools group.
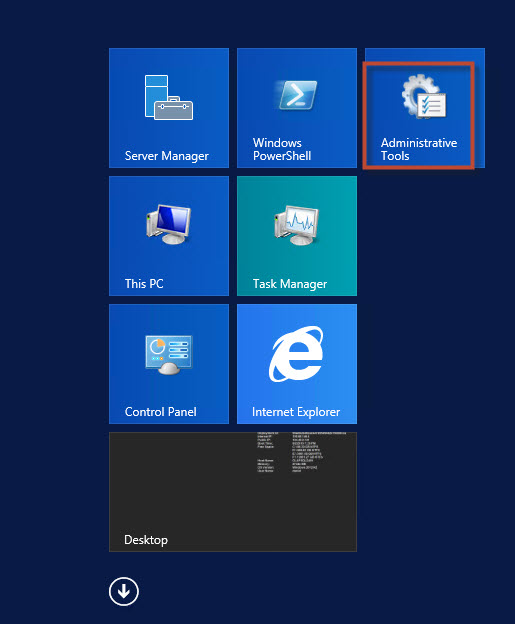
The Performance Monitor is part of the administrative tools.
The performance monitor by default shows the % of procesor time online. It is a graphical tool that shows the value of an specified counter.
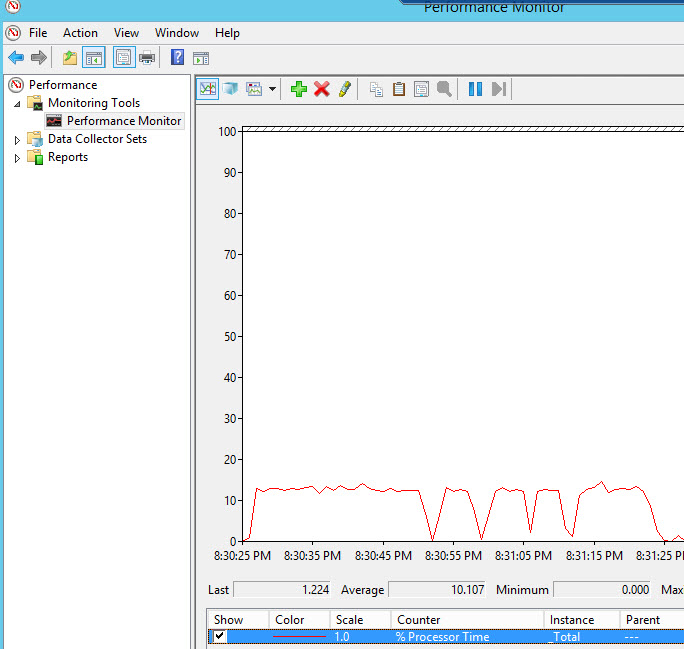
The red X will clear old results in the Performance Monitor.
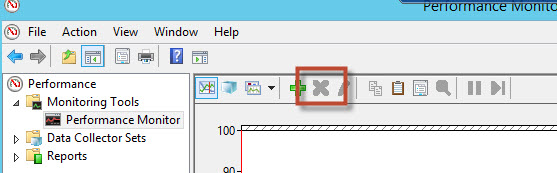
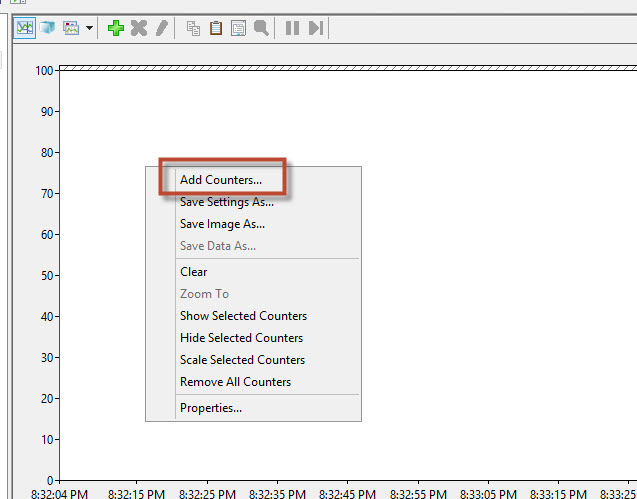
In order to Add a new counter right click on the graph pane and press Add Counters
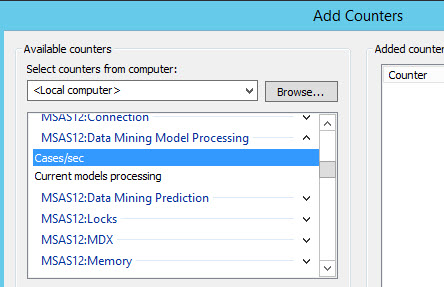
There are several counters to measure the performance of different applications. The Data Mining counters are on the MSAS section (Microsoft Server Analysis Services). In this example we will start with the Data Mining Model Processing.
There are several counters related to Data Mining, for example the Data Mining Model Processing verifies data related to the processing speed of the Data Mining models.
For example, you can measure the number of cases processed per second using the Cases/sec counter. Another counter used for DM Model Processing is the Current Models Processing. This counter shows the models processed. Both counters are really useful specially if the processing time is long when there are millions and millions of rows to process.
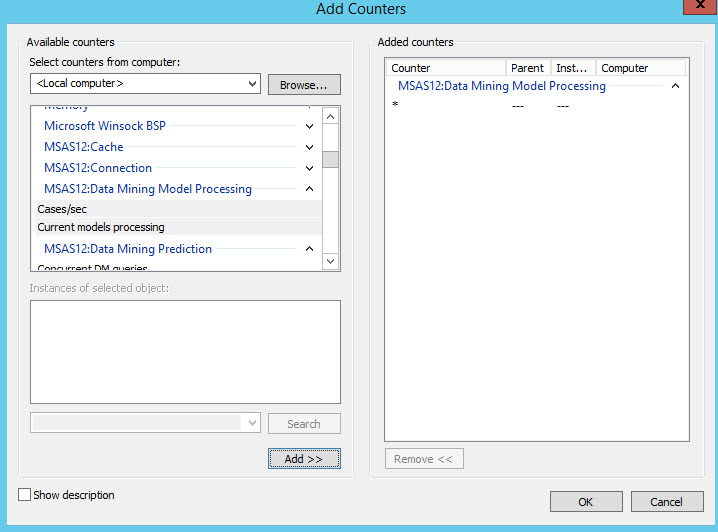
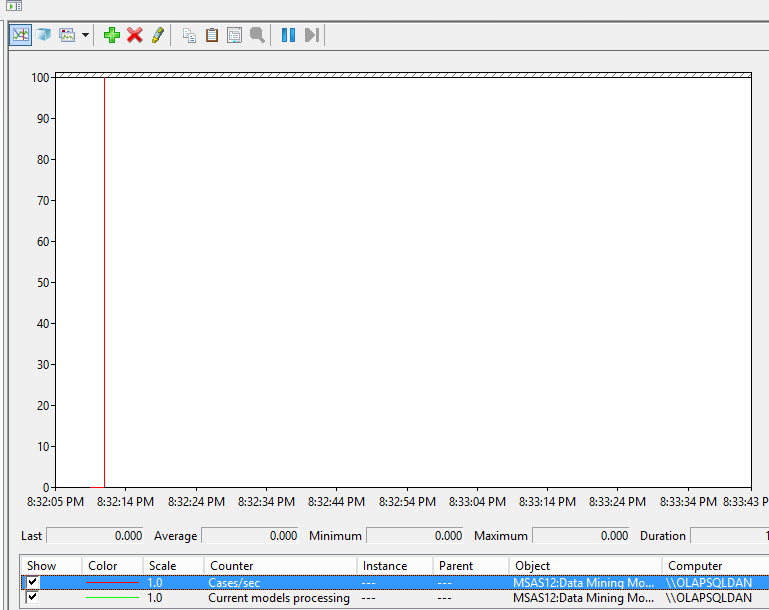
By default, Performance Monitor monitors the local computer, but you can monitor remote computers as well. For this example, select the Cases/sec and Currents models processing and press the Add button.
At the beginning, the default value will be 0.
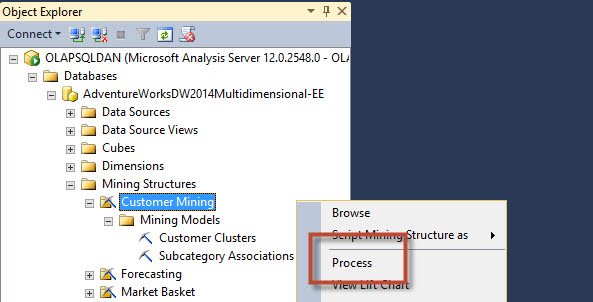
In order to generate some data in SSMS or SSDT, process a Data Mining Structure.
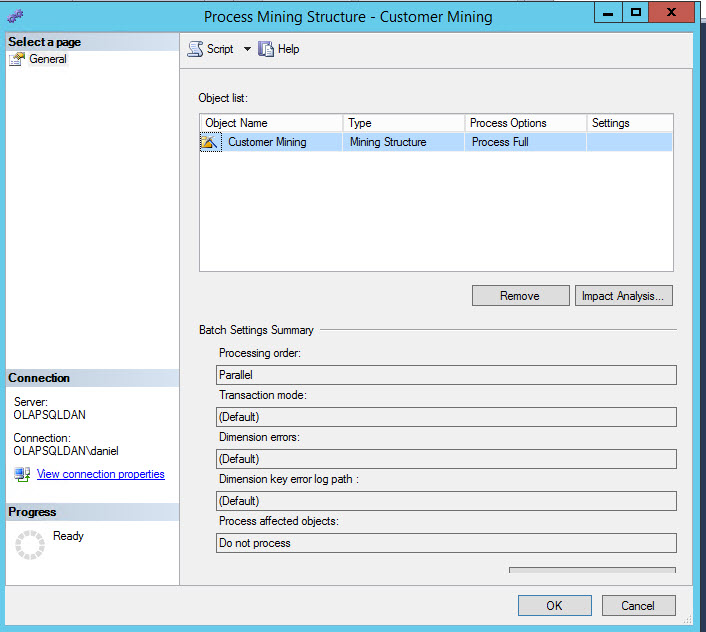
Press OK to process the model.
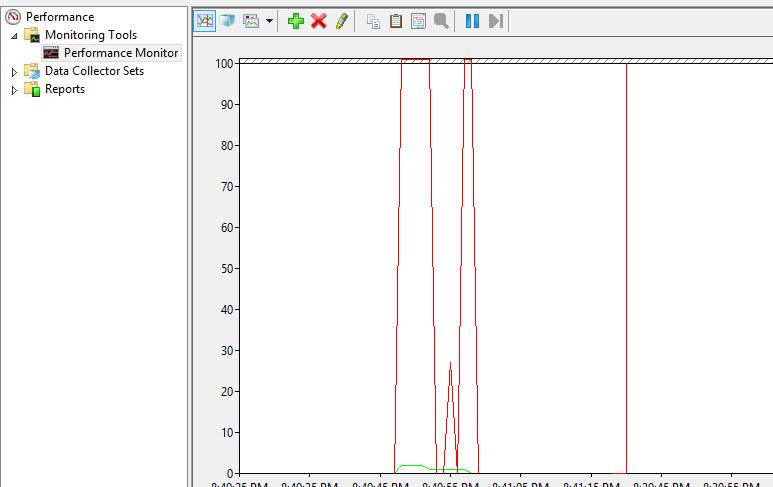
You will now be able to see data in the graph pane, because the counters check the number of cases processed and the current models processed. However, the values displayed only shows data online. What can we check historical performance data?
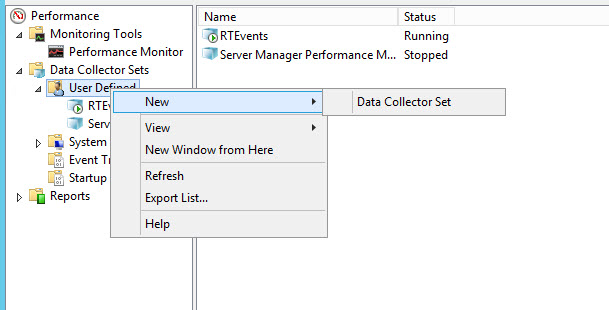
In order to store performance data you can use the Data Collector Sets. In Data Collector Sets go to User defined, right click and select New>Data Collector Set.
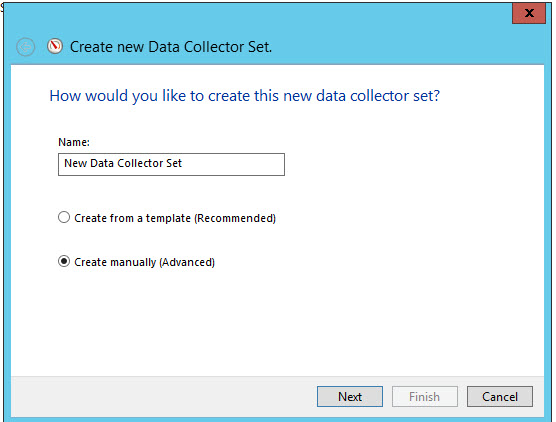
Specify a name for the new Data Collector Set and select the option to Create manually and press next. In this example we will name it "data mining".
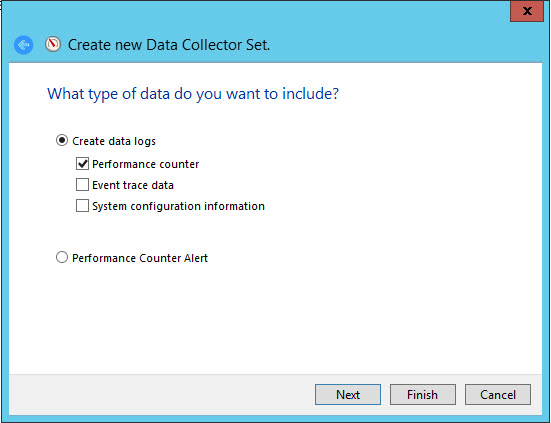
Select the Performance counter option and press Finish.
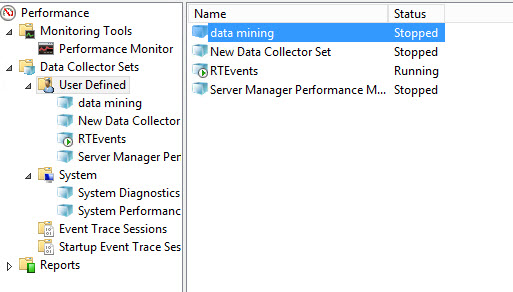
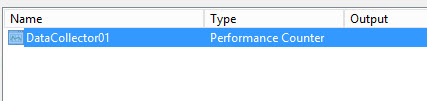
Now double click on the data Mining data collector set.
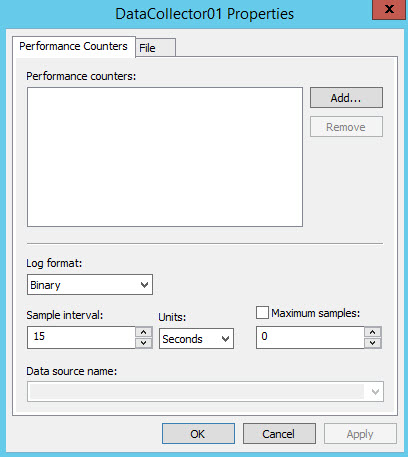
Double click on the DataCollector01.
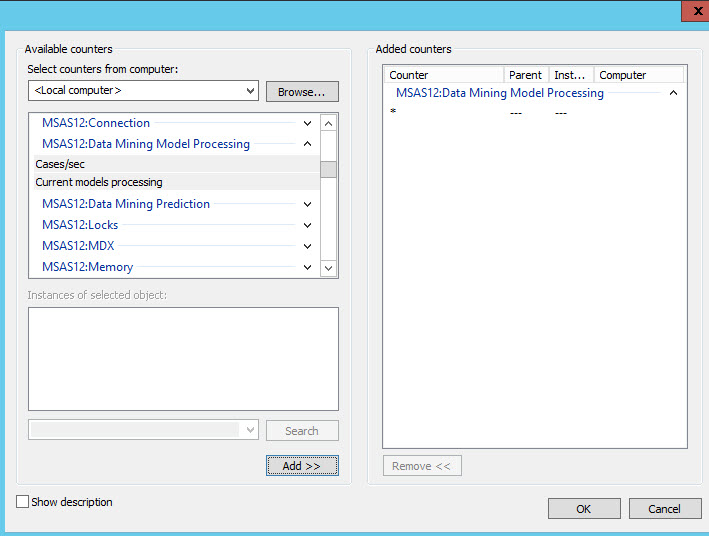
Press the Add button to add new Performance Counters.
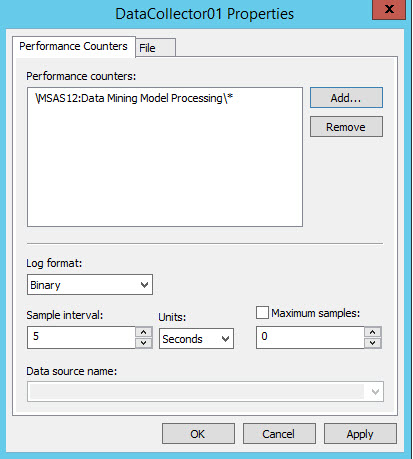
Select the same counters specified earlier and press Add.
To get more data faster, I will change the sample interval to 5. Usually the default value is to collect every 5 minutes, but as this is only a demo we will use 5 seconds. Press OK.
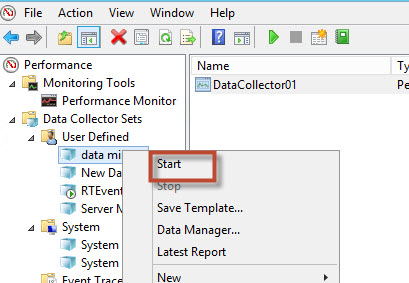
Now, right click on the Data Collector Set and press start to start collecting data.
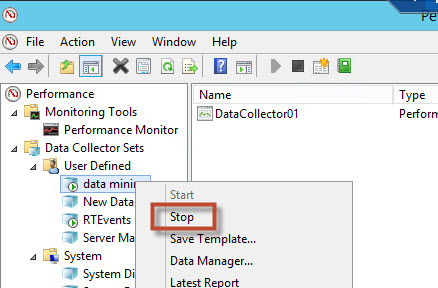
In order to generate data different than 0, repeat the steps 9 and 10 several times and after 5 minutes righ click on the Data Collector set and press stop.
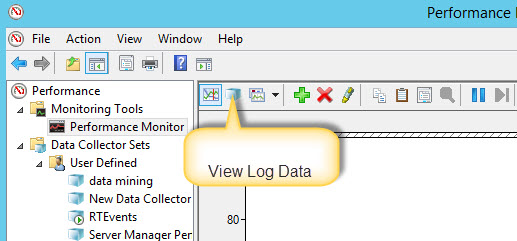
You have stored a log file with performance information for 5 minutes. In order to see the information, press the Log Data icon.
In the source tab, select log files and select Add.
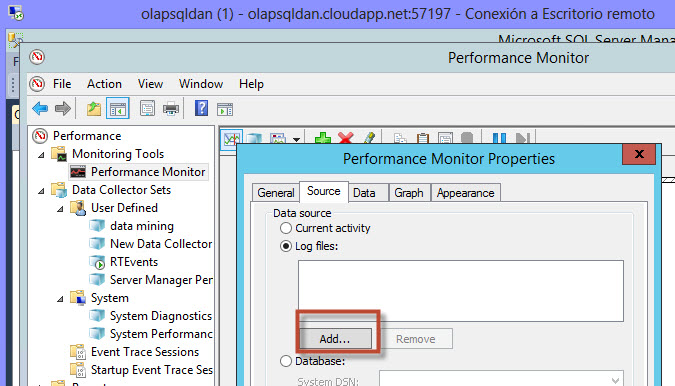
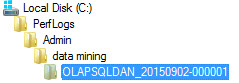
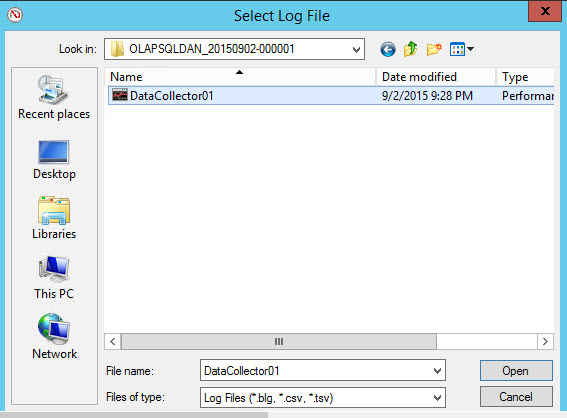
Go to the c:\Perflogs\User Name\collector set name and the log file. Usually the log file is the servername_date_ID, where the IDs are numbers starting from 1.
You will be able to see the DataCollector01 information. Select it and press open.
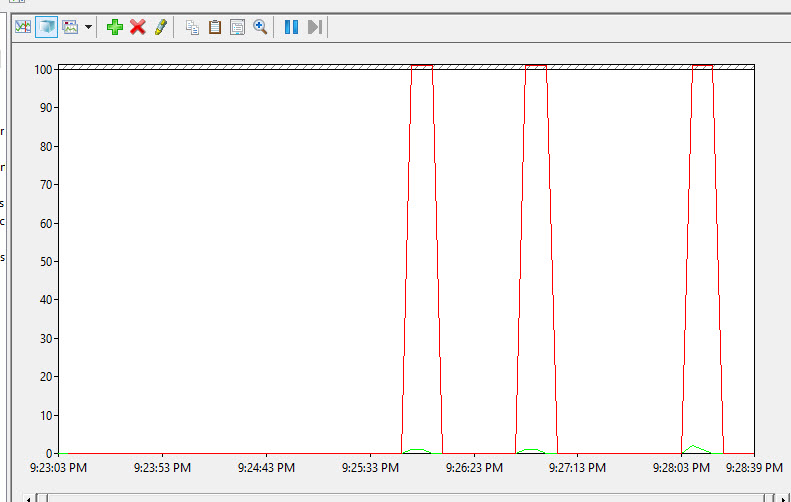
As you can see, you have now historical data stored.
Conclusions
In this chapter, we showed you how to use the Performance Monitor to Monitor Data Mining counters. The Performance Monitor allows you to monitor SQL Server applications, the Windows OS, Exchange and other applications. In this article we foccussed on Data Mining and we processed the model to generate data different than 0.
We also learned how to use the Data Collector to store the data. By default the performance monitor monitors the last minute value. After that minute, the old data is overwriten, that is why we use the Data Collector to store the information.
References
We played with the Data Mining Performance counters related to Processing models, but there are several other counters available. For a complete list of counters, review this link:
SSAS Counters