

Introduction
In the chapter 18, we learned how to work with MS Excel Add-Ins for Data Mining. This time, we will work with MS Visio to create Data Mining graphics and learn how to customize them
Requirements
- The Data Mining plugin for Excel 2007 includes the installer for MS Visio 2007 and SQL Server 2008, which can be downloaded here. Once downloaded, run the install.
- We are using the Data Mining plugin for Excel and Visio 2010, 2013 and SQL 2012 and 2014, which can be downloaded here.
- I am assuming that you already have a Decision Tree and a Cluster algorithm created using SSDTs. If not, verify the chapter 2 and 3.
- Microsoft Visio 2010 must be installed.
Getting Started
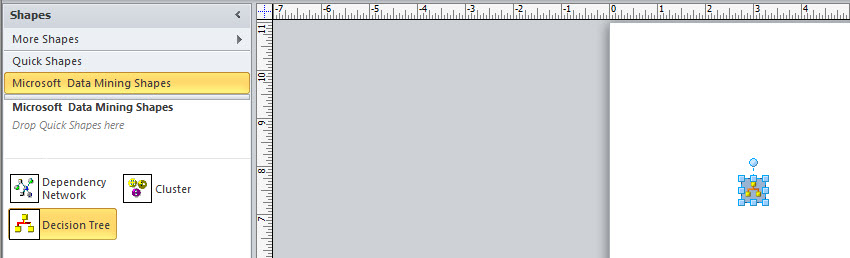
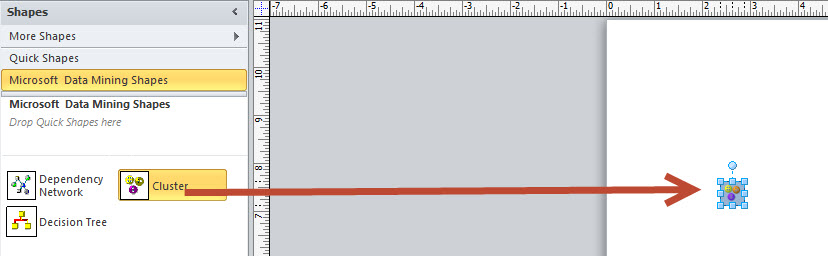
I am assuming that you already installed the MS Visio Adds-In of the requirements section. Open the MS Visio 2010. In shapes, you will see the Microsoft Data Mining shapes installed. Click on the template.
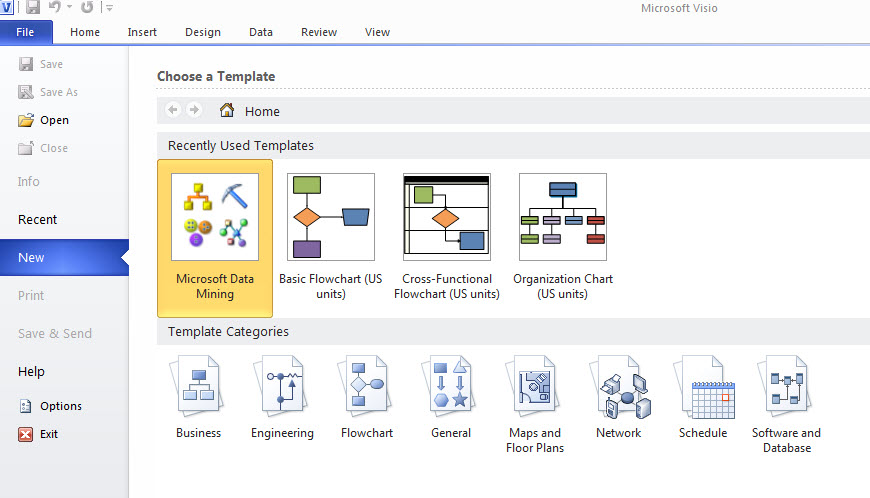
This Adds-In contains 3 options:
- The dependency network is to graph dependencies for Association rules, Decision Trees, Naive. For more information about the dependency network, verify the chapter 2 in the dependency network section.
- The Decision Tree is one of the basic algorithms. For more information about this algorithm, go to the chapter 2.
- The Cluster Algorithm is an algorithm to classify and group the information (in clusters). For more information about the cluster algorithm, go to the chapter 3.

In order to start, drag and drop the Decision Tree to the graph area.
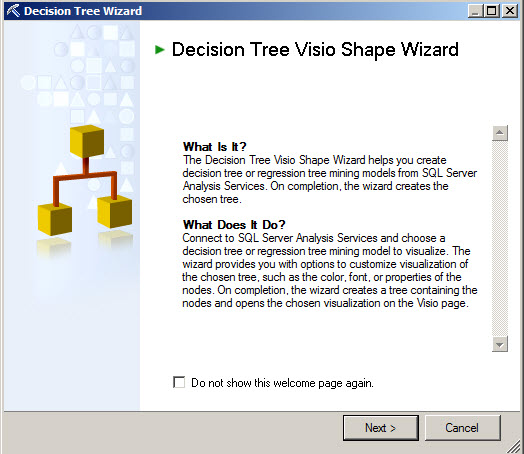
The Decision Tree Visio wizard will be displayed. Press Next.
If you do not have a connection, create one pressing the new button and specifying the connection information.
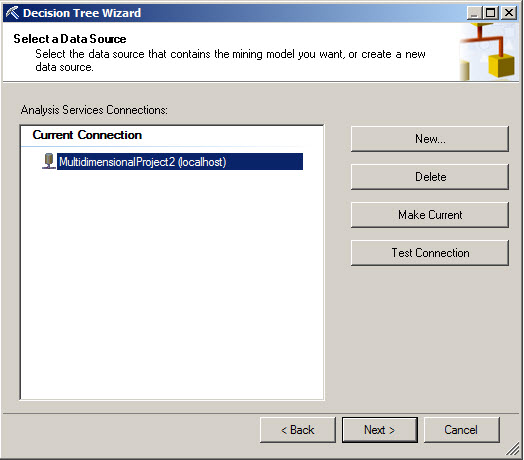
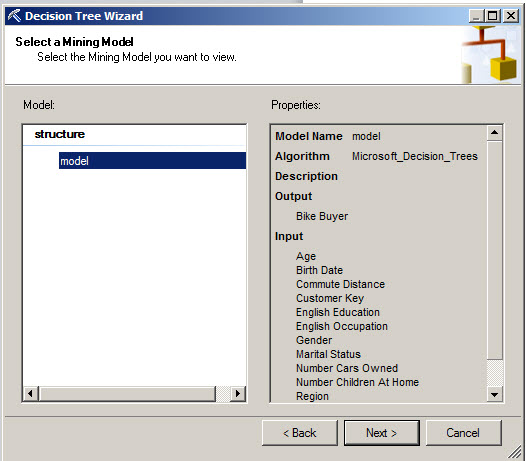
Select the structure to be used and press next.
In decision tree there is a combobox with the value to predict. The maximum Rendering depth is about the depth of the tree. A level 3 means the child, the parents and grandparents of a tree. A level 4 includes great-grandparents and the level 5 great-great grandparents. You can also choose the color of the distribution curve.

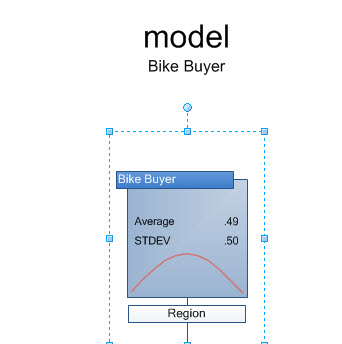
As you can see, a decision tree of 3 levels was created. Each branch has a distribution curve.

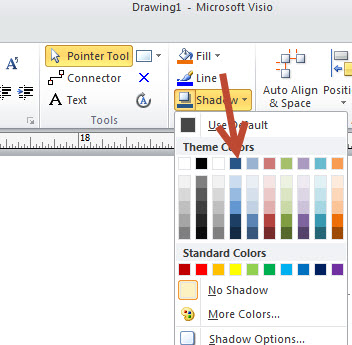
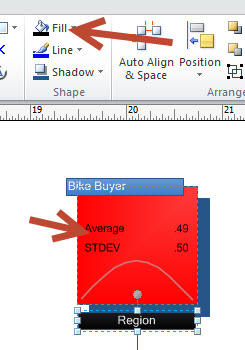
You can select a specific branch and choose a different color.
Let's select a blue shadow for a specific branch.
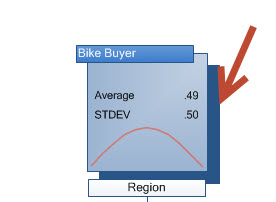
As you can see, now the shadow is blue.
Now select the branch and select the red color to fill it.
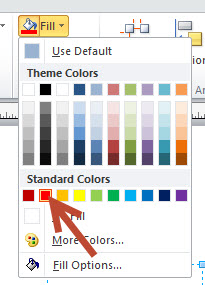
Now, this branch is red.
Now select the Region and change the color to black and the letters to white.
As you can see, in Visio you can easily modify the appearance of the trees easily as any other shape in Visio.
The Cluster
Now, let's work with the clusters.

Drag and drop the Cluster to the design pane.
The Cluster Visio wizard will be displayed.
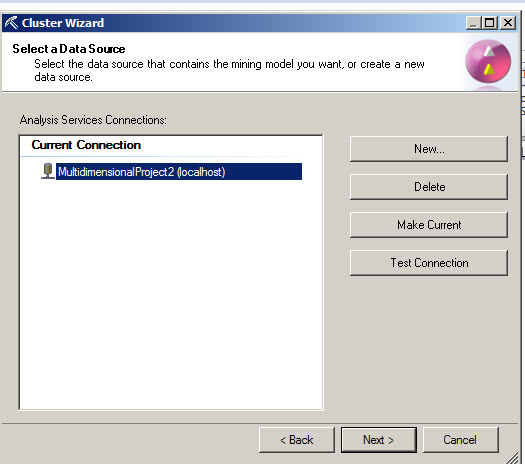
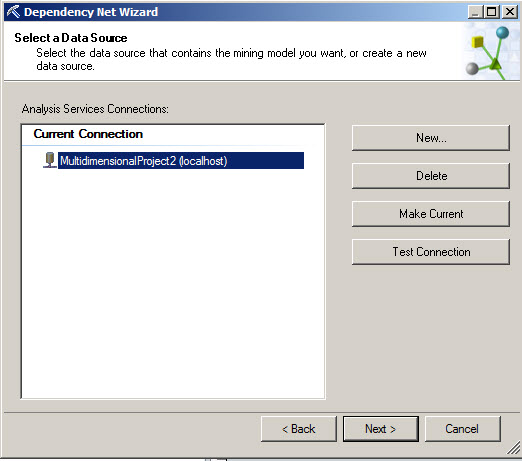
Select a connection.
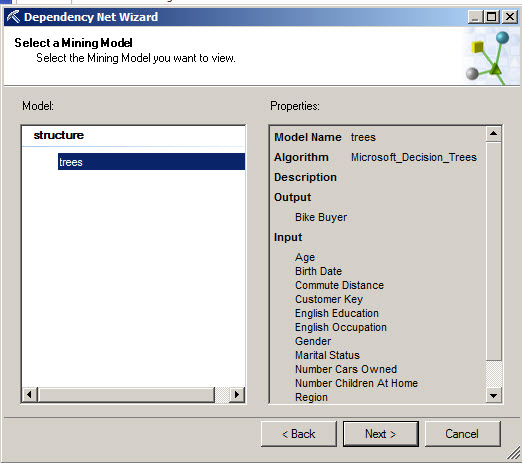
Select a Mining Model. If you do not have a model, go to the chapter 3 to create a cluster model.

You can see only the shapes of the cluster, verify the characteristics of the clusters (the recommended) or check the cluster discriminations. The cluster discrimination it is also displayed in the chapter 3.
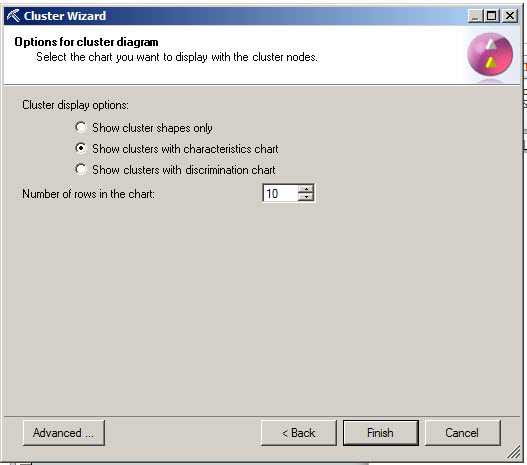
If you press the Advanced button, you can also select colors for the texts, select fonts and colors of the charts.

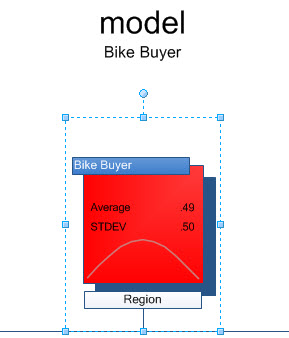
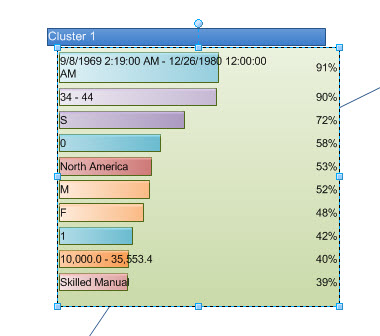
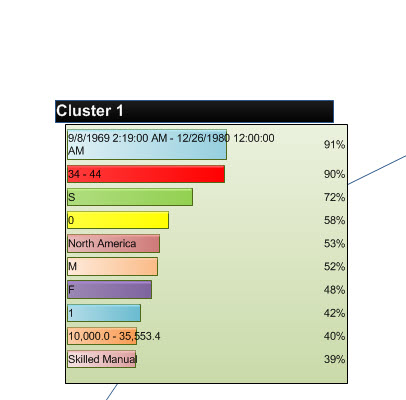
This is a cluster with the default colors.
This is a cluster with the appearance modified.
Dependency network
The Dependency network shows the dependency or relationship between attributes. Drag and drop the dependency Network to the graph pane.

The dependency Network Visio Wizard will be displayed.

Use the existing connection or create a new one.
Select the model that you want to use to see the dependences.
You can also select how many nodes you want to analyze.
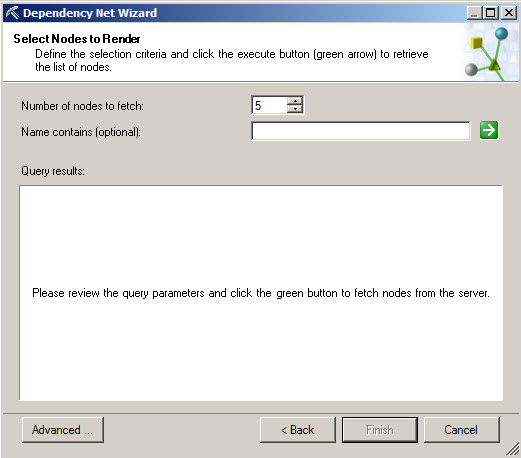
Press the green arrow to see the nodes to be displayed.

Once the dependency tree is done, you can modify the nodes.
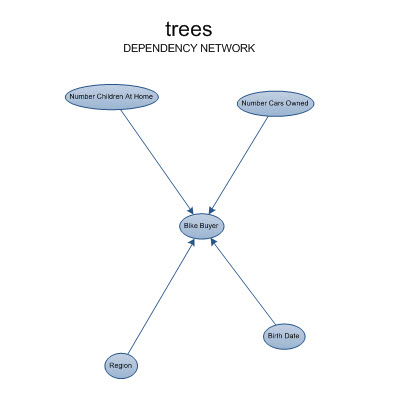
As you can see, you can change the colors, style of each node using MS Visio.

Conclusion
MS Visio is a great tool to customize the appearance of the graphs created for Data Mining. It is recommended for presentations, documentation to create corporative and more professional data mining graphs.