

Introduction
This new article will show the options to validate the Data Mining models with the Classification Matrix, the Profit Chart and the Cross Validation. We will also use the options to browse the model, manage the model and trace the information.
Requirements
Verify the lesson 18 for the requirements.
Getting Started
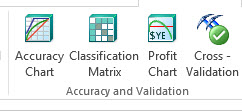
We will start with the Classification Matrix. First, we are going to test the classification Matrix. The classification Matrix shows if the model is accurate for predictions. It is similar to the accuracy chart explained in lesson 20, but in this case the Classification Matrix shows data instead of charts of accuracy.
1. Click the Classification Matrix icon.
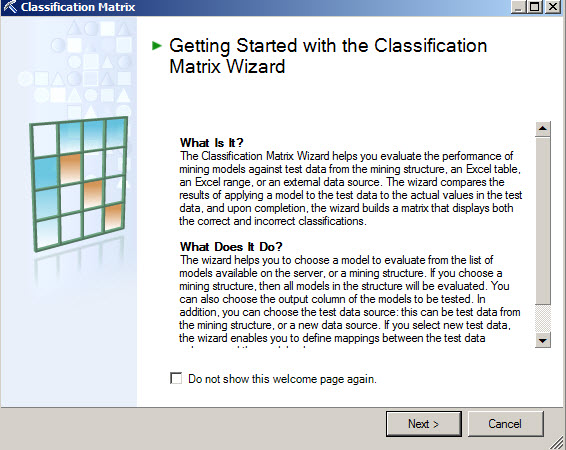
2. The Classification Matrix will be displayed.
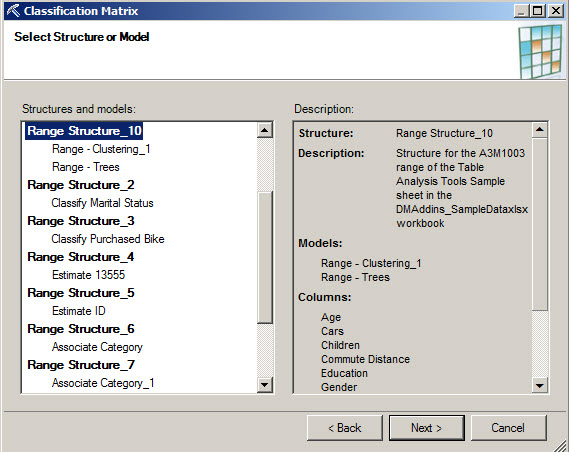
3. Select the structure or model to be validated.
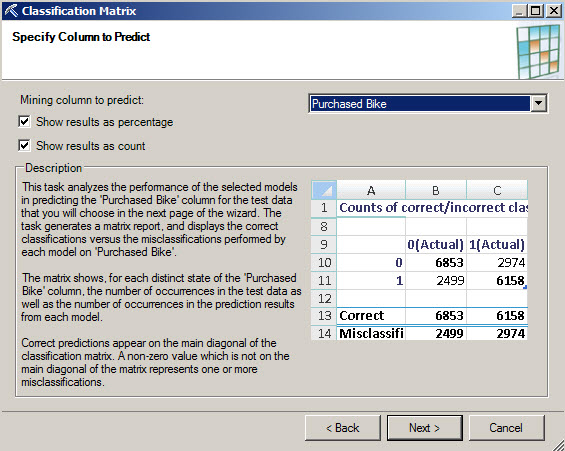
4. Select the column to predict and leave the options by default checked and press next.
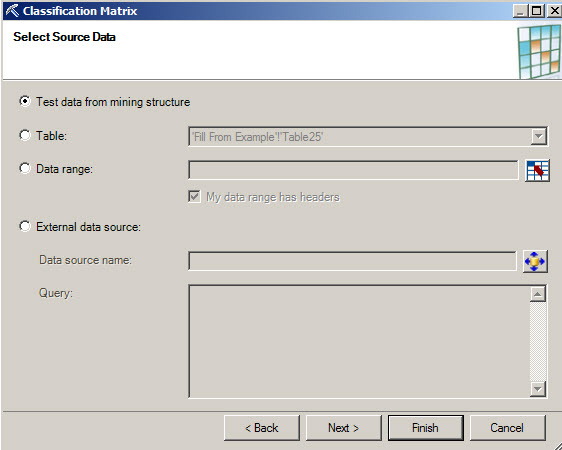
5. Leave the default values and press next.
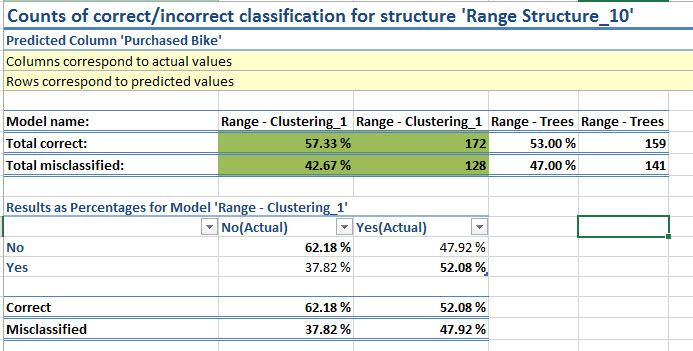
6. The Excel file will show the accuracy of the model. In this case, it is a cluster model and 57% of the values tested were correct and 43% incorrect.
The next section divides the result in Yes or No. This model predicts if a customer with certain characteristics will buy or not a bike. The possible options are yes or no.
The % correct result for the no answer is 62 % and the % of correct results for the yes answer 52 %.
Profit Chart
The profit chart is a very useful option used to verify the number of customers to call to increase the profits. The profit chart in the Y axis shows the profit and the X axis the number of customers. It will show the best number of customers to contact to maximize the incomes in an inflexion point.
For this chart, you need to estimate the cost to contact a customer. Usually it can be calculated by the salary in the amount of time required to contact the customer. Some customers may buy the products offered and some will not. With this chart, you can estimate the number of customers to contact to get the maximum profit.
1. Press the Profit Chart icon.

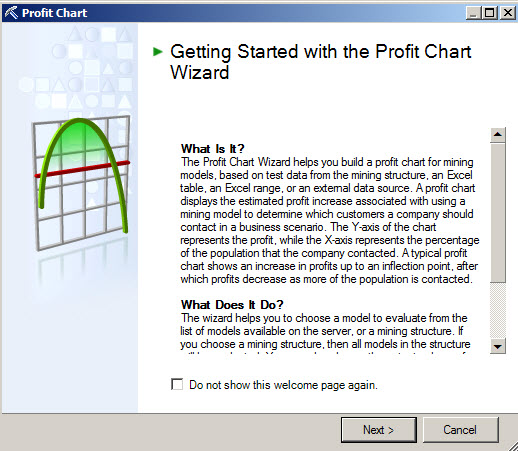
2. In the Profit Chart wizard, press next.
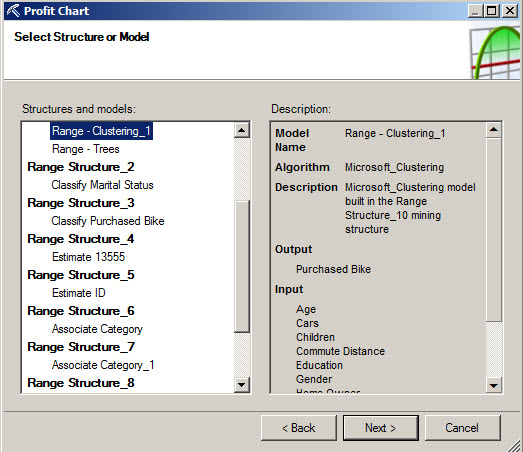
3. Choose a structure or a model.
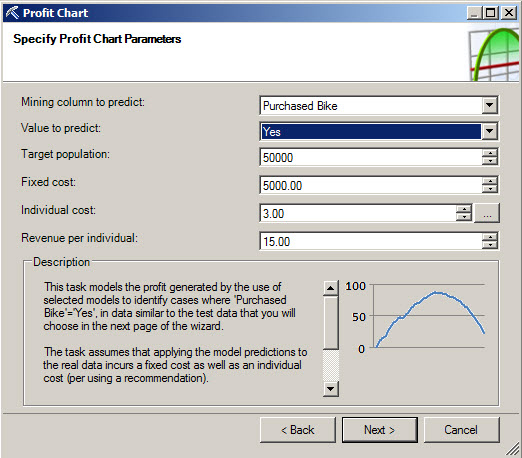
4. Specify the column and value to predict the target population. The fixed cost is the cost to contact all the people. The Individual cost is the cost to call each customer. For example if we call a customer by phone, it costs something for the call. The revenue per individual is the profit if we sell the product.
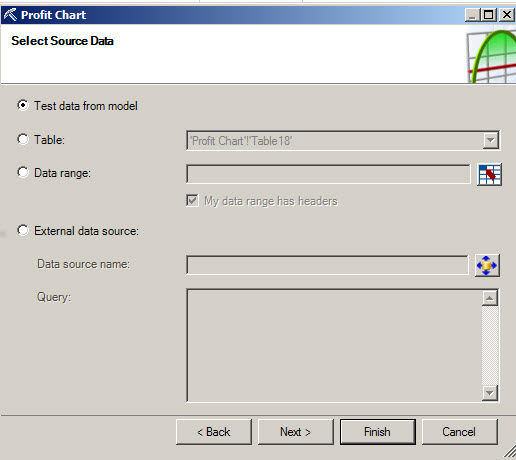
5. In the select source data, we select the data to be used.
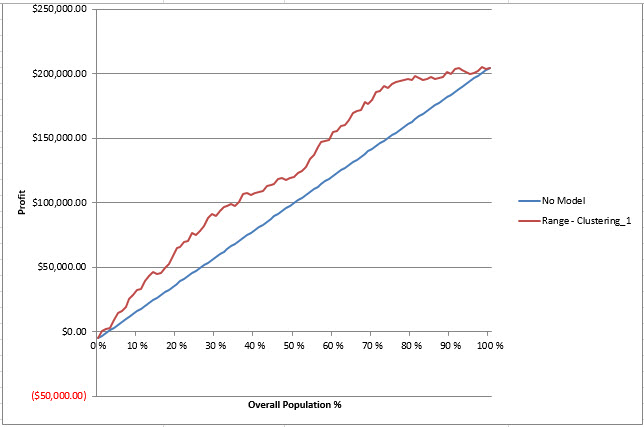
6. In this chart, the more population you contact, the more profits you have. The chart shows to profits vs the population. The profits below 0 shows the % of population that produces a negative profit.
Cross Validation
The Cross Validation is another way to validate the Data Mining Models. This report divides de information in groups of data called folds. You compare the range of values in each fold and if the variance is low, the model is a good model.
1. In order to try this model, select the Cross Validation icon.

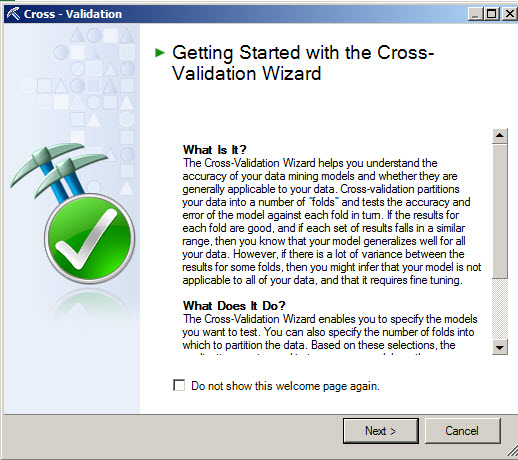
2. In the Cross Validation Wizard, press next.
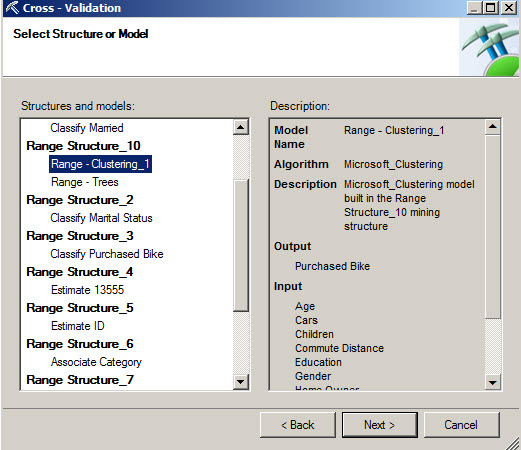
3. Select the model to analyze and press next
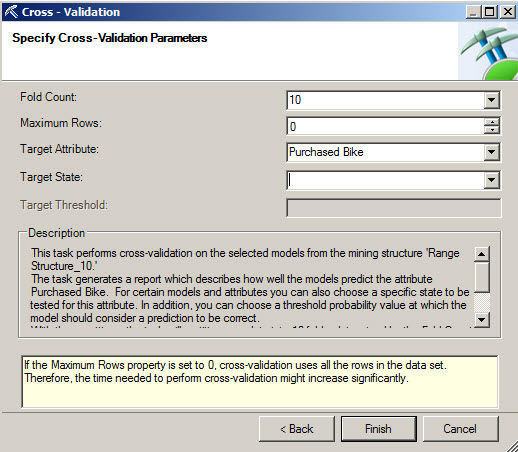
4. Specify the Fold Count. By default it is ten. You can also specify the maximum number of rows. In the target Attribute, select the Purchased bike and press Finish.
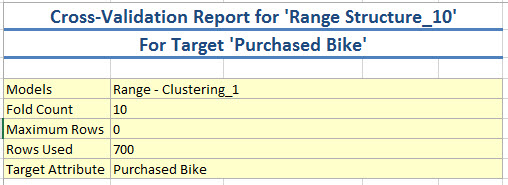
5. The first part of the report shows the default parameters specified in step 4.
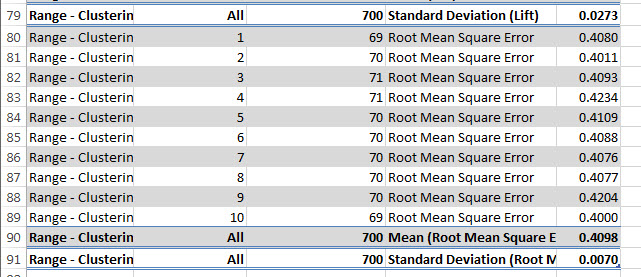
6. The second part of the reports shows the following results:
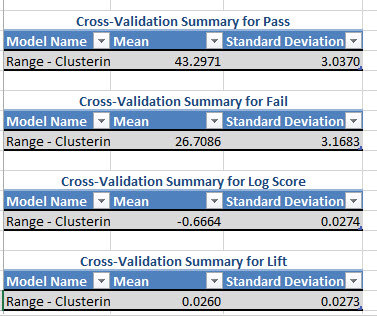
Cross-Validation Summary for Pass shows the Mean and the Standard Deviation. The Standard Deviation should be a low value if the model is good. The same for the Cross-validation Summary for Fail. A low Standard Deviation shows that the model is distributed correctly.
7. Other values from the report are the Log Score and the Lift.
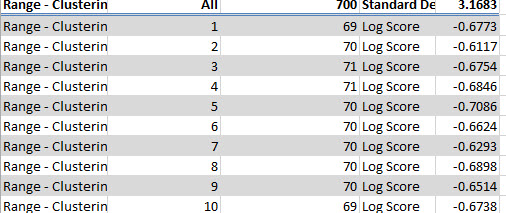
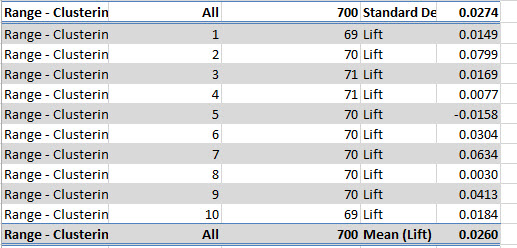
The log score is a ratio between 2 probabilities converted to a logarithmic scale. The value is negative because the logarithm of a probability between 0 and 1 is always negative. This value should be very close to 0 if the model is good. The lift shows the if the model is better than a random guess. If the value is negative, guessing the results is better than using the model.
Browse Model
There is another option to browse the models already created.
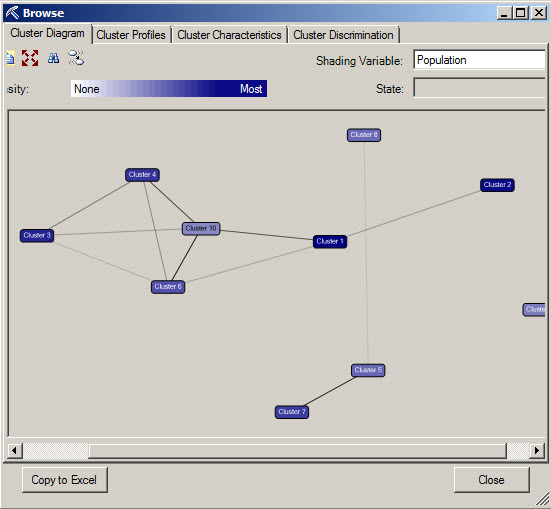
1. In order to start, press the Browse icon.

2. In the Brows wizard, select the model to browse and press next.
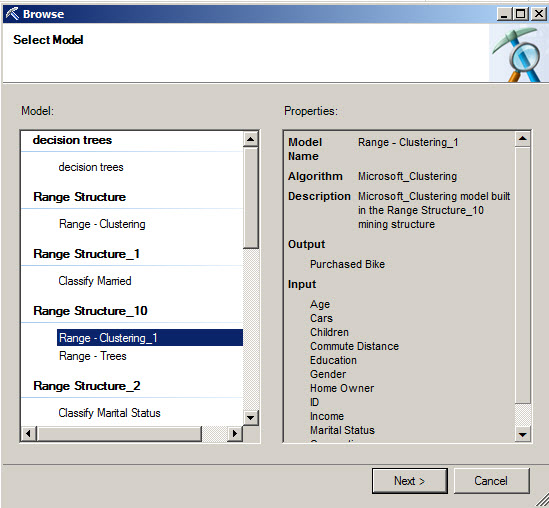
3. You will be able to successfully browse in your model.
Document Model Usage
It is always necessary to create a document about the Data Mining Algorithm. The document option lets you create a table of information with the algorithm used, model name, description, log score, pass and fail information, algorithm parameters, etc.
1. It is very simple to use it. Just press the Document Model Usage icon.

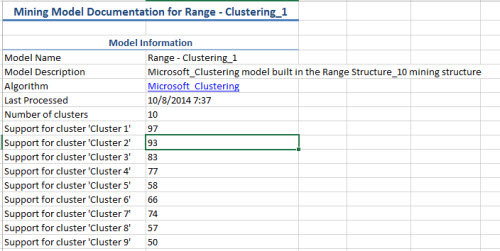
2. Once done you will be able to see al the information about the data mining model used. The first para shows the Name, description of the algorithm and also in this case displayed below, it shows information for each cluster.
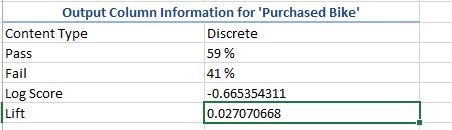
3. The next part shows the log score, the lift the number of cases that passed and failed.
In this case, the information that passed is higher than the information than failed. This is good, but the percentage should be at least above 70% to be considered as a good model. The log Score should be closer to 0 to be considered as a good model. The Lift should be always positive. It is a good reference to see if everything is OK.
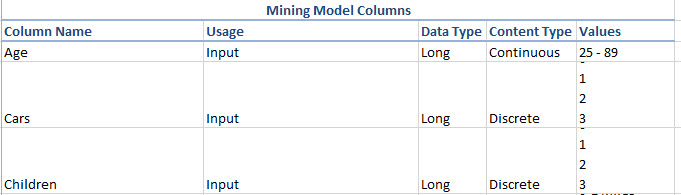
4. You will also have the columns, the usage of each column, the data types, the content type and the possible values of the Mining Model.
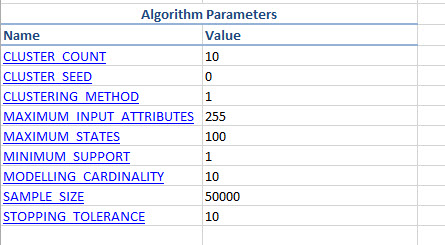
5. The Document Model also shows the values of the Algorithm Parameters.
Manage Models
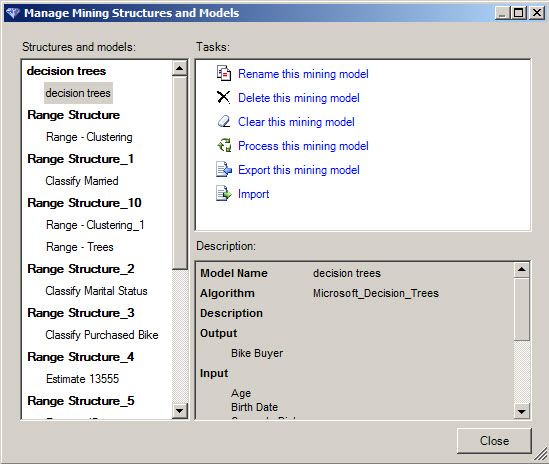
Manage model is an option to Rename, delete, clear, process, export and import the mining model.
1. In order to start, press the Manage Models option.
2. Select a structure and a model and select if you want to rename, delete, clear, etc. The Export and Import model tasks help you to Share the information in other computers.
Connections
The connections let you manage and create different connections.
1. In order to work with connections click on the connections.
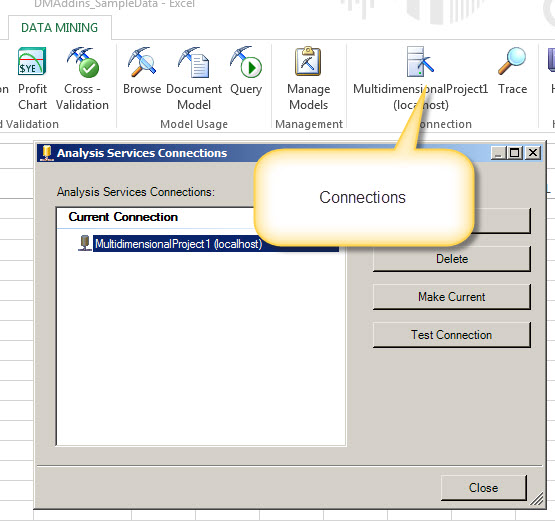
2. You can create new connections, modify, delete the connections and activate the current connection with the make current option. You have also the option to test the connection.
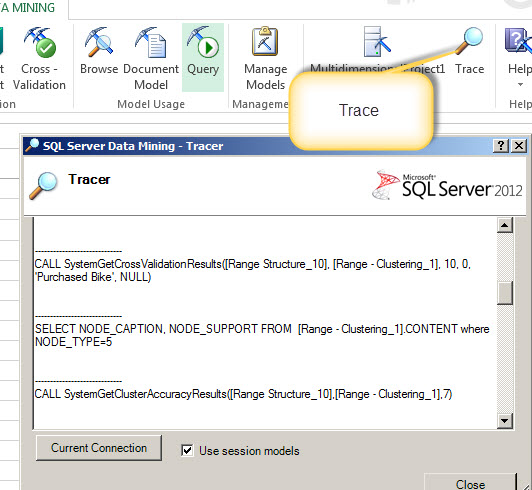
Trace
With the trace option, you can verify the statements used in the Data mining structures and models. You will be able to monitor XMLA statements and DMX statements. This is a very powerful tool to learn XMLA and DMX with the help of the visual buttons and it is also useful to monitor the queries and properties used.
Conclusion
In this lesson, we learned how to validate the data mining model using the classification matrix, the cross validation and the profit chart.
We also learned how to document the model using Excel and how to delete, modify and process the model. We manage the connections and finally we learned how to trace the Data Mining activity.
References