3 calculations on different levels
-
Hello everyone,
I am asking something that I am not even sure is even possible therefore I will appreciate any suggestion or advice.
I have a SQL code that works just fine. But I have an issue
My calculations for Inventory On Hand and On Order are done using LOC column (it is basically a store number). Inventory and what is on hand is counted per a store.
There is a table SCPOMGR.LOC from where I match stores with a chain.
However, I have one more calculation 'Forecast Demand' and it is done on a chain level, because we don't have it on a store level.
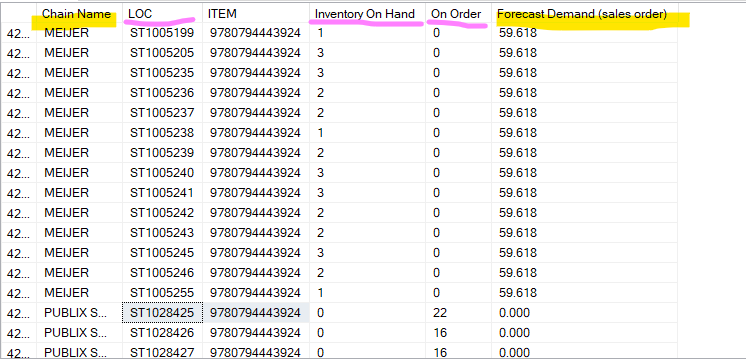
It looks like this.

It is pretty confusing because after i am done querying I am inserting SQL code into a data visualization tool and it sums inventory on hand and on order for a Chain correctly, but Forecast Demand which should be in this example just 59.618 for the whole Chain gets multiplied a number of times.
I am not even sure if that somehow can be overturned in SQL so that the number of forecast doesn't get repeated on each new line for the same item.
SELECT    n.U_CHAINNAME AS 'Chain Name', s.LOC, s.ITEM,

                sk.OH AS 'Inventory On Hand',
                ISNULL(sc.QTY, 0) AS 'On Order',
                ISNULL(f.TOTFCST, 0) AS 'Forecast Demand (sales order)'

  FROM [BYIntegration].[SCPOMGR].[UDT_SKUPROJ] s
    LEFT OUTER JOIN  [BYIntegration].[SCPOMGR].[LOC] n
  ON s.LOC=n.LOC

  LEFT OUTER JOIN SCPOMGR.DMDUNIT d
  ON s.ITEM=D.DMDUNIT

  LEFT OUTER JOIN (select loc, item,SUM(OH) AS OH FROM [BYIntegration].[SCPOMGR].[SKU] sk group by loc, item) sk
  ON  s.[LOC]=sk.[LOC] AND s.[ITEM]=sk.[ITEM]

  LEFT OUTER JOIN (select loc, dmdunit, SUM([TOTFCST]) as TOTFCST from [BYIntegration].[SCPOMGR].[FCSTPERFSTATIC] group by loc, dmdunit) f
  ON n.[U_CHAINNAME]=f.[LOC] AND s.[ITEM]=f.[DMDUNIT]

  LEFT OUTER JOIN (select  loc, item, sum(qty) as QTY from [BYIntegration].[SCPOMGR].[SCHEDRCPTS] group by loc, item) sc
  ON s.[LOC]=sc.[LOC] AND s.[ITEM]=sc.[ITEM]

WHERE s.LOC LIKE 'ST%'

AND s.[ITEM]='9780794443924'

GROUP BY   n.U_CHAINNAME, s.LOC, s.ITEM, sk.OH, sc.QTY, f.TOTFCST
ORDER BY n.U_CHAINNAME, s.LOC, s.ITEM -
You are joining here the forcast on chain and location. Do you need to join on both conditions? In the visualisation tool there may be a setting to treat this measure using a MAX (for example) instead of suming the values in the column.
To fix at the code you could use a windowed function... something like >
Sum(TOTFCST) over (partition by chain_name) and keep everything else at the grain you have it at.
----------------------------------------------------
-
In the forecast table FCSTPERFSTATIC [LOC column] table is basically chain names and we don't forecast at a store level. I join this [LOC] (Chain name) to another table called [LOC table] and there i have correspondence of stores and chain names (LOC here is a store# and U_CHAINNAME is a chain name.
As for your last message I am not sure I understand. Do you want me to write like this? I think I don't understand what I need to do.
-
I am inserting SQL code into a data visualization tool
Which one? If you're using Excel or PowerBI, you can very likely use DAX for this. (Except DAX is not like SQL in the slightest... the good thing, though, is that you can use stored procedures to create "datasets"... so you can just reuse a lot of your SQL Server stuff...)
-
@pietlinden I figured how to fix it in SQL. I removed store numbers, grouped on forecast (but didn't sum) and summed on hand and on order. As a result on hand and on order summed and forecast was just left with a single value.
I appreciate willingness to help. And yes, PowerBI.
Thank you.
-
I was asking because you can do things in DAX that are crazy hard in SQL. Like removing filters by using the ALL() function.
If you have to learn DAX, Rob Collie's book is a good place to start.
You could do something like this...
Total Sales:= SUM('Sales'[SalesAmount])
and then create another measure that ignores a filter, like [StoreID]...
Total Sales All Stores := CALCULATE ( [Total Sales], ALL('Stores'[StoreID] ) )
-
@pietlinden thank you!!
-
You're welcome.
I was asking because if you're doing this in PowerBI, and using DAX, then you should use a star schema instead of an OLTP one. The easiest way of doing it is to create stored procedures or views in your database (maybe create a separate schema for them) and then use those as sources in your tables in your model in PowerBI. Then you create your simple measures (sums, whatever) and then use those to make more complex measures using CALCULATE etc.
Then when you put your measures in a matrix (for example), the columns/rows on the matrix determine the evaluation context (filters) for the measure... Rob Collie's book is a pretty gentle introduction to DAX - maybe read that first. He starts with simple measures and builds from there. be sure to download the files that go with the book and play along.
-
This will illustrate what I was trying to point out initially
Try the following sample data and see results
Create table #myTemp(
area varchar(10),
store varchar(10),
totalStoreSales int
);
go

insert into #myTemp
values
('area_a', 'store1', 45),
('area_a', 'store2', 25),
('area_a', 'store3', 20),
('area_b', 'store1', 10),
('area_b', 'store2', 15),
('area_b', 'store3', 20)


Select area, store, totalStoreSales,
sum(t1.totalStoreSales)over(partition by area) as totalAreaSales,
totalStoreSales*1.0/sum(t1.totalStoreSales)over(partition by area) as percentSalesInArea
From #myTemp as t1

Drop table #myTemp----------------------------------------------------
-
This is super handy!
I should use this to create a super simple PowerBI file and write all the measures there, so you can see how it works. The reason I would do this in PowerBI is because when you apply filters in your visuals etc, it filters the raw data and then does the calculations. It depends if you want an interactive report... if you don't and it's for printing, use SSRS and stored procedures. If you do need interactivity and drill down, use PowerBI.
Here are the measures for my report:
- Total Store Sales = SUM('Table'[StoreSales])
- Area Total = CALCULATE(SUM('Table'[StoreSales]), ALL('Table'[store]) )
- Area Share = DIVIDE ( [Total Store Sales], [Area Total])
Then you can add a matrix to your canvas, and put Area and Store on Rows and then [Total Store Sales], [Area Total], and [Area Share] in the values section
-
I think writing summary queries in T-SQL is the wrong way to go if you're consuming the data in PowerBI. It's fine to create views using T-SQL to populate your dimension and fact tables, but once that's done, you don't need T-SQL for PowerBI. After that you need to use DAX, because that's what PowerBI uses to do all of its measures etc. There's just no way around it. Knowing T-SQL helps some, but only a little. DAX and T-SQL are very different animals.
- pietlinden wrote:
I think writing summary queries in T-SQL is the wrong way to go if you're consuming the data in PowerBI. It's fine to create views using T-SQL to populate your dimension and fact tables, but once that's done, you don't need T-SQL for PowerBI. After that you need to use DAX, because that's what PowerBI uses to do all of its measures etc. There's just no way around it. Knowing T-SQL helps some, but only a little. DAX and T-SQL are very different animals.
Much like SQL and MDX are very different indeed.
And, I've been told to not write summary queries for Tableau as well 🙂
----------------------------------------------------
-
I was pointing that out to the OP... Maybe read a little of The Data Warehouse Toolkit to learn how to build star schemas might be in order. I didn't find it immediately obvious, for sure.
the problem I have with importing already aggregated data is that you lose the ability to drill all the way down into the data. And that's what PowerBI is for. (either that or I've been missing something for a long time!)
but it's entirely possible to create views to create dimension tables in the PowerBI data model. Might actually be easier that way. The book I would absolutely recommend is Rob Collie's book, though... it's about the easiest introduction to star schemas I've seen... and he's really good at explaining DAX so even I could understand it. You quite literally build along with him as you read the chapters.
-
It's a funny thing about "drill downs"... I love it when folks drill down to the final layer of 100,000 rows and then wonder what to do.
It is possible to output to a pre-aggregated table that contains multiple layers... That's referred to as a "Cube" isn't it? Store the pre-agg in a cube and once you get down to the layer you want and you need the row data, just pull that from the original table (or a copy of it).
And, remember... even Google doesn't return 100,000 rows at a time. 😀
--Jeff Moden
RBAR is pronounced "ree-bar" and is a "Modenism" for Row-By-Agonizing-Row.
First step towards the paradigm shift of writing Set Based code:
________Stop thinking about what you want to do to a ROW... think, instead, of what you want to do to a COLUMN.Change is inevitable... Change for the better is not.
Helpful Links:
How to post code problems
How to Post Performance Problems
Create a Tally Function (fnTally) -
Except I'm not talking about normal SQL Server/T-SQL, except to get data out of SQL Server and into the data model. I'm talking about DAX. =)
Here are the measures for my report:
Total Store Sales = SUM('Table'[StoreSales])
Area Total = CALCULATE(SUM('Table'[StoreSales]), ALL('Table'[store]) )
Area Share = DIVIDE ( [Total Store Sales], [Area Total])
And most/all of the stuff in PowerBI dashboards is visuals. You wouldn't drill all the way down to the raw data except in rare circumstances, but it's possible. =)

Viewing 15 posts - 1 through 15 (of 17 total)
You must be logged in to reply to this topic. Login to reply