100% High CPU Usage and High Number of Wait Times (6K ms/Sec)
-
We are facing a problem where CPU usage on SQL Server 2008 R2 spikes to 100% and during this period our backoffice application clients stop responding. It takes 3-5 seconds and then clients start responding. When it happens then Data File I/O in SQL Server shows that tempdb is being read/written by about 20MB/Sec. Wait time for latches increases to 6000 ms/sec and then decrease. It is happening after every 5,6 minutes. We are in retail environment using SAP Business One where sale transactions from many POSs are coming to SQL Server continuously and our primary MDF is around 80GB, its LDF around 20GB and SBO Common MDF is around 12 GB and its log file is reaching 50GB. We ran some scripts to check tempdb contention but they did not returned any results. Almost all databases are on autogrowth without restriction and plenty of space on drives available. Where is the problem and what we need to do to fix this issue?

-
How much RAM is on the server? Is Max memory set on SQL Server, or is it left at the default of 2TB?
What are the IOPS of the disk(s) where your tempdb files sit (and, if there are different disk types--SSD vs HDD--what are the IOPS for all the disks being used)? Also, what is the logical disk layout on the server? Are all the db files on one drive, or are they separated out to different disks?
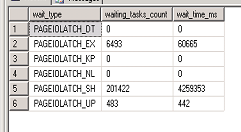
What are the results of IO wait stats from this DMV:Select wait_type,
waiting_tasks_count,
wait_time_ms
from sys.dm_os_wait_stats
where wait_type like 'PAGEIOLATCH%'
order by wait_type
The two most common root causes of this issue are memory, where there isn't enough RAM, so the disk subsystem is pressed into service for memory paging (to disk), or an actual problem with the I/O disk subsystem--either the physical configuration, or, more likely, the logical configuration.Alan H
MCSE - Data Management and Analytics
Senior SQL Server DBA
Best way to ask a question: http://www.sqlservercentral.com/articles/Best+Practices/61537/ -
Capturing your wait stats once and then analyzing is generally not the way you want to look at waits. You would want to see differences from a period of time to another time. That tells you what the wait stats were between those two time periods. If you don't clear wait stats, then they will indicate the stats since the service started. So you would generally want to start with some type of baseline and then capture another set of waits so that you can see what the wait stats were during the two times you captured the wait stats. If you have some out of the ordinary or one time occurrence of a wait type at one time, that wait type and time will be included in sys.dm_os_wait_stats since those are aggregated numbers. Things like that can throw off how you interpret wait types and times.
After you get an idea of what the wait stats where during the time of the CPU spike issue, SQL Skills site has a wait type library at:
SQL Server Wait Types LibraryIf your highest waits are still PAGEIOLATCH_SH, you could look that up in that Wait Types Library - here is the information on that wait type:
PAGEIOLATCH_SHIn that article, he references another article on that particular wait type which has more information. Its worth reading even if that doesn't end up to be your highest wait (and he also mentions measuring the wait stats against some type of baseline);
Knee-Jerk Wait Statistics : PAGEIOLATCH_SHSue
-
Hi Alan
Plz see the attached results.
RAM in server is 64GB. Max memory is 2TB by default. Tempdb sits in C drive. The server has RAID 10 with C, F and G drives.
Database1 with MDF (70GB) at F and LDF (20GB) at G.
Database2 with both MDF and LDF (50GB) in C drive.The drive is a one Virtual Drive of 8 physical drives. The virtual disc has bad blocks since 2012 but these never created problems. My suspicion is on the LDF file of 50GB in C drive.
-
Hold the phone a minute... the original post says that the problem occurs every 5-6 minutes. I've found that wait stats are normally a symptom rather than a cause. Someone first needs to find what's running every 5-6 minutes and what resources it is using. Until that is determined, you're usually chasing ghosts.
--Jeff Moden
RBAR is pronounced "ree-bar" and is a "Modenism" for Row-By-Agonizing-Row.
First step towards the paradigm shift of writing Set Based code:
________Stop thinking about what you want to do to a ROW... think, instead, of what you want to do to a COLUMN.Change is inevitable... Change for the better is not.
Helpful Links:
How to post code problems
How to Post Performance Problems
Create a Tally Function (fnTally) - muhammadaftab25 - Friday, September 1, 2017 8:43 AM
You probably don't want to specify SQL Server memory higher than physical RAM, you want to leave some space for the OS itself and any other running programs. Consider this, if you have database pages in memory that get moved to a virtual memory page file on disk, you're adding extra disk I/O operations to the data to write to disk page file and read back from disk page file. Here's some articles about configuring Max Memory:
http://sqlblog.com/blogs/tibor_karaszi/archive/2014/03/06/setting-max-server-memory.aspx
https://www.brentozar.com/blitz/max-memory/If you think you are having disk latency issues, you can check SQL Server's dynamic management views to see info collected per file:
SELECT DB_NAME(vfs.database_id) AS db_name,
    vfs.io_stall_read_ms / NULLIF(vfs.num_of_reads, 0) AS avg_read_latency_ms,
    vfs.io_stall_write_ms / NULLIF(vfs.num_of_writes, 0) AS avg_write_latency_ms,
    mf.physical_name AS file_name, mf.type_desc,
    vfs.io_stall / NULLIF(vfs.num_of_reads + vfs.num_of_writes, 0) AS avg_total_latency_ms
  FROM sys.dm_io_virtual_file_stats(NULL, NULL) AS vfs
    INNER JOIN sys.master_files AS mf ON vfs.database_id = mf.database_id AND vfs.FILE_ID = mf.FILE_ID
  ORDER BY avg_total_latency_ms DESC;
You can use a script like in the following article to examine disk latency as it is happening:
https://www.sqlskills.com/blogs/paul/how-to-examine-io-subsystem-latencies-from-within-sql-server/
https://www.sqlskills.com/blogs/paul/capturing-io-latencies-period-time/ -
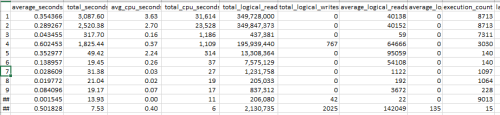
building on Jeff's idea, you can also check the dynamic management views to see what queries are taking the most CPU, I/O, or total duration if you run this in the database you are having problems with:
SELECT TOP 25
    qs.total_elapsed_time / qs.execution_count / 1000000.0 AS average_seconds,
    qs.total_elapsed_time / 1000000.0 AS total_seconds,
    qs.total_worker_time / qs.execution_count / 1000000.0 AS avg_cpu_seconds,
    qs.total_worker_time / 1000000.0 AS total_cpu_seconds,
    qs.total_logical_reads, qs.total_logical_writes,
    qs.total_logical_reads / qs.execution_count AS average_logical_reads,
    qs.total_logical_writes / qs.execution_count AS average_logical_writes,
    qs.execution_count, qs.last_execution_time, qs.creation_time,
    SCHEMA_NAME(o.schema_id) AS schema_name, o.name AS object_name, o.modify_date,
    qp.query_plan, qs.sql_handle, qs.plan_handle,
    DB_NAME(qt.dbid) AS database_name
  FROM sys.dm_exec_query_stats qs
    OUTER APPLY sys.dm_exec_sql_text(qs.sql_handle) as qt
    LEFT OUTER JOIN sys.objects o ON qt.objectid = o.object_id
    OUTER APPLY sys.dm_exec_query_plan(qs.plan_handle) as qp
  WHERE qt.dbid = DB_ID()
  --ORDER BY total_elapsed_time DESC; --duration
  --ORDER BY total_logical_reads DESC; --disk reads
  --ORDER BY total_logical_writes DESC; --disk writes
ORDER BY total_worker_time DESC; --CPU time - Jeff Moden - Friday, September 1, 2017 9:00 AM
Hi Jeff
It is SQL Server taking up 100% CPU usage after every 5-6 minutes. So I think that best way would be to see the list of most expensive queries? Is there any other way to see what SQL Server is looking for during this period?
- muhammadaftab25 - Saturday, September 2, 2017 12:01 AM
Have you checked any SAP jobs, my money would be on an inefficient job using distinct on multiple columns, resulting in a hash aggregate spilling into tempdb.
😎 - muhammadaftab25 - Saturday, September 2, 2017 12:01 AM
Yes but you want to see the list during the incursion. The stored procedure is a little ditty I wrote a while back to help me with these types of this. I install it in my master database and, using the instructions in the header, turn it into a system stored procedure so during a panic, I don't need to worry about which database I'm in.
USE [master]
GO
/****** Object:  StoredProcedure [dbo].[sp_WhatsRunning]    Script Date: 11/7/2015 11:58:42 AM ******/
SET ANSI_NULLS ON
GO
SET QUOTED_IDENTIFIER ON
GO
 CREATE PROCEDURE [dbo].[sp_WhatsRunning]
/**********************************************************************************************************************
 Purpose:
 This stored proc returns what's currently running across the entire server in some great detail.  The output is
 sorted by CPU usage in seconds in descending order. Both the query and the "intended" execution plan are "clickable"
 for easy and complete viewing.
Please see the code
Programmer's Notes:
1. This stored procedure should live in the Master database.
2. After building the stored procedure, you need to run the following code to convert it into a "system" stored
procedure that can be executed from database.
USE MASTER;
EXEC sp_ms_marksystemobject 'sp_WhatsRunning';
SELECT name, is_ms_shipped
FROM sys.objects
WHERE name = 'sp_WhatsRunning'
;
Usage:
sp_WhatsRunning --(from any database)
... OR ...
EXEC sp_WhatsRunning --(from any database)
Revision History:
Rev 00 - 29 Feb 2013 - Jeff Moden
- Formalize this script for regular usage as a "system proc" that can be called from anywhere.
Rev 01 - 08 Aud 2013 - Jeff Moden
- Change the output of the "Query" column to make it so all formatting is preserved to make readability much
easier. Just click on the BLUE XML in the result set to see the query/proc with all formattinng preserved.
**********************************************************************************************************************/
AS
--===== Environmental Presets
SET NOCOUNT ON;
--===== Collect and display the information about what's running this instant.
SELECT Query = (SELECT N'--'+NCHAR(10)+t.text AS [processing-instruction(fgCode_SQL)] FOR XML PATH(''), TYPE) --Rev 01
, CPU = CONVERT(VARCHAR(20),CONVERT(MONEY,r.cpu_time/1000.0),1)
, Duration = CONVERT(VARCHAR(20),CONVERT(MONEY,r.total_elapsed_time/1000.0),1)
, PhysicalReads = REPLACE(CONVERT(VARCHAR(20),CONVERT(MONEY,r.reads),1),'.00','')
, Reads = REPLACE(CONVERT(VARCHAR(20),CONVERT(MONEY,r.logical_reads),1),'.00','')
, Writes = REPLACE(CONVERT(VARCHAR(20),CONVERT(MONEY,r.writes),1),'.00','')
, Rows = REPLACE(CONVERT(VARCHAR(20),CONVERT(MONEY,r.row_count),1),'.00','')
, SPID = r.session_id
, BlockingSpid = r.blocking_session_id
, Memory = r.granted_query_memory
, HostName = s.host_name
, ProgramName = s.program_name
, ClientInterface = s.client_interface_name
, LoginName = s.login_name
, StartTime = r.Start_Time
, RunStatus = r.Status
, Command = r.Command
, DBID = r.database_id
, DBName = DB_NAME(r.database_id)
, UserID = r.user_id
, WaitType = r.wait_type
, WaitTime = CONVERT(VARCHAR(20),CONVERT(MONEY,r.wait_time/1000.0),1)
, LastWaitType = r.last_wait_type
, WaitingOn = r.wait_resource
, OpenTrans = r.open_transaction_count
, IsManagedCode = r.executing_managed_code
, p.query_plan
, r.statement_start_offset
, r.statement_end_offset
FROM sys.dm_exec_requests r
JOIN sys.dm_exec_sessions s ON s.session_id = r.session_id
CROSS APPLY sys.dm_exec_sql_text(sql_handle) t
CROSS APPLY sys.dm_exec_query_plan(plan_handle) p
WHERE r.session_id <> @@SPID --Keeps this proc from appearing in the output.
ORDER BY r.cpu_time DESC
;
GOSince it will be difficult and take a bit to log into the server during the times when you're having problems, I'd keep an SSMS session open to the box (I actually always have an RDC open to my production box with an SSMS session up an running. It has saved my butt more than once and doesn't take much memory).
You'll also notice quite a similarity between the code above and the code that Chris Harshman posted. That's because it's a tried and true method for interrogating the server during times of trouble. The difference is the he uses query stats and I use query requests as the source. His shows what HAS happened and mine shows what IS happening.
--Jeff Moden
RBAR is pronounced "ree-bar" and is a "Modenism" for Row-By-Agonizing-Row.
First step towards the paradigm shift of writing Set Based code:
________Stop thinking about what you want to do to a ROW... think, instead, of what you want to do to a COLUMN.Change is inevitable... Change for the better is not.
Helpful Links:
How to post code problems
How to Post Performance Problems
Create a Tally Function (fnTally) -
p.s. CPU usage and Duration in the output of sp_WhatsRunning is in decimal seconds, just to make life a little easier. It also identifies if any blocking is going on, which is usually the case when you have these types of problems.
--Jeff Moden
RBAR is pronounced "ree-bar" and is a "Modenism" for Row-By-Agonizing-Row.
First step towards the paradigm shift of writing Set Based code:
________Stop thinking about what you want to do to a ROW... think, instead, of what you want to do to a COLUMN.Change is inevitable... Change for the better is not.
Helpful Links:
How to post code problems
How to Post Performance Problems
Create a Tally Function (fnTally) -
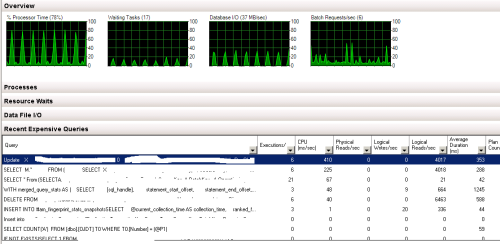
Hi Jeff & Chris. From the query posted by Chris, we noticed that there is an update query inside an SP that is running on a table of 4 million records after every few minutes. It shows that average CPU seconds for this SP are 3-5 seconds.
Whenever CPU shows 80% usage, this update query is showing in recent expensive queries.Also we shrunk the LDF files of all databases but problem is still there.
- Eirikur Eiriksson - Saturday, September 2, 2017 3:38 AM
Heh... I can tell you've been there before. 😉
--Jeff Moden
RBAR is pronounced "ree-bar" and is a "Modenism" for Row-By-Agonizing-Row.
First step towards the paradigm shift of writing Set Based code:
________Stop thinking about what you want to do to a ROW... think, instead, of what you want to do to a COLUMN.Change is inevitable... Change for the better is not.
Helpful Links:
How to post code problems
How to Post Performance Problems
Create a Tally Function (fnTally) - muhammadaftab25 - Saturday, September 2, 2017 11:27 AM
Ok... so have you fixed it yet? 😉
Post that UPDATE query and let's have a look at it. There's a particular pattern in UPDATE queries that seem to work but are actually an illegal form of UPDATE that causes "Halloween-like" symptoms.
Also, do you mean the LDF files grew back to a large size? The size of the LDF files don't have much to do with performance unless you have a bad query that causes them to grow.
Also, that last graphic might be fairly useless unless you know when the last compile time was and what the query was. Further, it may not actually have anything to do with the problem that occurs every 5 minutes or so. It may just be a query that happens to run a lot
--Jeff Moden
RBAR is pronounced "ree-bar" and is a "Modenism" for Row-By-Agonizing-Row.
First step towards the paradigm shift of writing Set Based code:
________Stop thinking about what you want to do to a ROW... think, instead, of what you want to do to a COLUMN.Change is inevitable... Change for the better is not.
Helpful Links:
How to post code problems
How to Post Performance Problems
Create a Tally Function (fnTally) - Jeff Moden - Saturday, September 2, 2017 11:10 AM
Hi Jeff & Eirikur and all others
Thank you very much for your kind help. Jeff's query which shows "What Is Happening" showed us the sql query when CPU usage was going to 80%. This query was part of an automated alert comparing data of 2 years and it was failing due to some reason. It was being called by continuously and failing continuously every few minutes. As soon as we disabled this alert, server came back to normal situation. I will thank you all and I would like to ask what basic base line data or db information we should have in our hands to use as a baseline. Frankly speaking, i did not exactly knew what was CPU usage in normal days in our server.

Viewing 15 posts - 1 through 15 (of 20 total)
You must be logged in to reply to this topic. Login to reply