

One of the most talked about features previewed during the Microsoft Data Insights Summit in the previous June was the What-If Analysis capabilities. Today, this capability was finally released as part of the August update to Power BI Desktop.
New to Power BI? Start here!
The What If Parameter feature allows you to dynamically perform what-if type analysis by using a slider bar to visualize changes to a calculation. This becomes a very flexible way to perform all kinds of different “what if” type scenarios.
In this blog post, I’m going to walk through setting up a simple What-If type scenario to dynamically change a Revenue Target calculation.
I’ll start with a simple Power BI report that displays Revenue by Date.

I’d like to add a line to the line chart to show the Revenue Targets. In my example, the Revenue Target will be based on a percentage of the previous years sales. So the first thing I need to do is create a Calculated Measure to calculate the revenue for the previous year. Here’s the DAX for the calculated measure:
Revenue Last Year = CALCULATE([Sum of Revenue],DATEADD(‘bi_date'[Date],-12,MONTH))
And if I add this measure to the line graph, we can see Sum of Revenue and Revenue Last Year side by side.

Now lets create the What-If Analysis functionality. In the Modeling ribbon, click the New Parameter button.

This opens the What-if parameter dialogue window. Give the parameter a name and select the data type. Specify the Minimum, Maximum, and Increment values. You can also specify a Default value if you would like. The Add slicer to this page check box will automatically create a special kind of slicer that is used to select a single value for your what-if analysis.

Once you click OK, a calculated table will be created based on your input values. The table is created with no relationships to any other table.

Also, a calculated measure was created in the new calculated table. This is the measure we need to reference in order to make our what-if calculation dynamic.

Next, I’m going to create a calculated measure that multiples Revenue Last Year by Revenue Target % Value. Here’s the formula for the calculated measure:
Revenue Target = [Revenue Last Year] * [Revenue Target % Value]
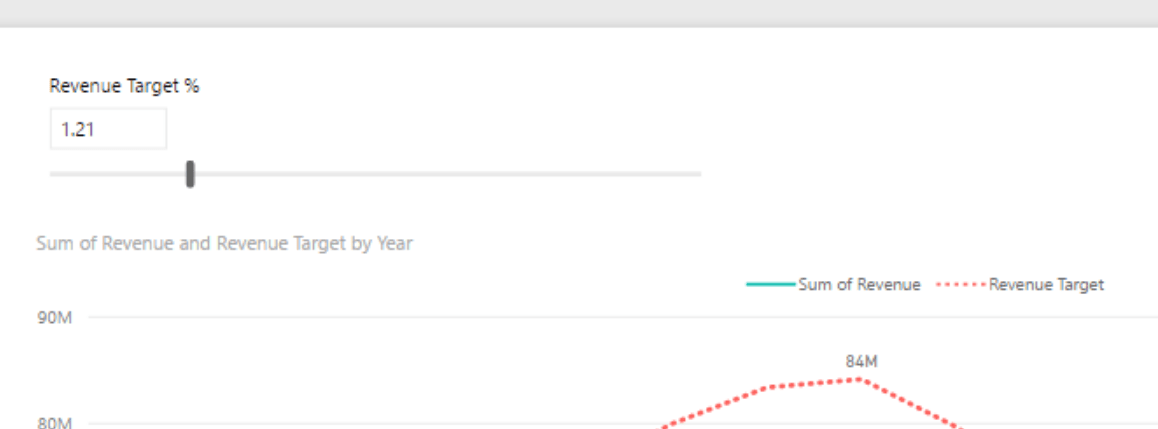
Now I’m going to add this new measure, Revenue Target, to my line chart. And now when I use my slicer slider bar, I can dynamically change my Revenue Target line on the chart!

I can move the slider bar to adjust the Revenue Target line. Also, check out the dotted line! That’s also a new feature this month! Very cool stuff!
Resources
What new in Power BI Desktop for August 2017
Download my Power BI Desktop file I used in this blog post
Feedback
Let me know what you think! Leave a comment down below and let me know what you think of the new What If Parameter and the other new features released this month!
