

Every good DBA should have a DBA database. A place to store information about all of their instances and databases.
I have an InstanceList table which looks like this
CREATE TABLE [dbo].[InstanceList](
[InstanceID] [int] IDENTITY(1,1) NOT NULL,
[ServerName] [nvarchar](50) NOT NULL,
[InstanceName] [nvarchar](50) NOT NULL,
[Port] [int] NOT NULL,
[AG] [bit] NULL,
[Inactive] [bit] NULL CONSTRAINT [DF_InstanceList_Inactive] DEFAULT ((0)),
[Environment] [nvarchar](25) NULL,
[Location] [nvarchar](30) NULL,
CONSTRAINT [PK_InstanceList_ID] PRIMARY KEY CLUSTERED
(
[InstanceID] ASC
)WITH (PAD_INDEX = OFF, STATISTICS_NORECOMPUTE = OFF, IGNORE_DUP_KEY = OFF, ALLOW_ROW_LOCKS = ON, ALLOW_PAGE_LOCKS = ON) ON [PRIMARY]
) ON [PRIMARY]
I use this as the basis for all of my information gathering. By adding Server name, Instance Name , Port, Environment and Location to the table I use overnight Agent jobs to run Powershell scripts to gather information about all of the instances. This way the information is dynamic and gathered from the server, so when we add RAM and change Max memory this is updated the next time the script runs. You can also automate your installation and decommission procedures (using Powershell scripts) to add the information to the DBA database automatically
I have 4 scripts
- ServerInfo which gathers Windows OS information such as Version and edition of the operating system, number of processors,amount of RAM, IP address, domain name etc
- SQLInfo which gathers information about the instance such as SQL version, edition, collation, max and min memory, MAXDOP , service accounts and start modes, default file locations etc
- Database information such as size, data usage, index usage, last backup dates, owner and many more
- Agent Job which gathers the outcome of the jobs that have run, their names, category into two tables one for a server rollup and one for details about each job
Recently I have received a lot of requests for information from various sources, auditors asking about encryption and backup policies, Project managers asking about database and sql versions, compliance asking about numbers of Windows 2003 servers or SQL 2005 servers, system teams asking which serves in a particular location can be turned off at which time dependant on which system they are supporting for a power down
Before we had the DBA database holding all of the information about the instances we would have struggled to be able to compile this information and when I saw Power Bi was released to GA I thought that it would be a good place to start to learn about it. By using data that I understood and answering questions that I knew the format of the answer I could be more confident about experimenting – ie. if I know I have 100 servers then any result for servers that exceeds that is incorrect
I have never been a BI guy, I claim no expertise in the correct methods of manipulating the data. There may very well be better methods of achieving these results and if there please feel free to comment below so that I can improve my knowledge and keep on learning
All data shown in the examples below has been generated from real-life data but all identifiable data has been altered or removed. I have no servers in Bolton, it is where I am from originally!!
I downloaded Power BI Desktop from powerbi.com and ran the installer and the first screen you see is this one

I then clicked on Get Data

And then SQL Server and filled in the details for my DBA Database and clicked connect

I used my current Windows credentials

It then asked me which tables I wanted to load so I said all of them 🙂

Once I had loaded the data I looked at the queries and renamed some of the columns to make more sense to me. I also created some calculated columns by clicking New Column
I created a relative date column using this code from Chris Webb http://blog.crossjoin.co.uk/2013/01/24/building-relative-date-reports-in-powerpivot/
Relative Date Offset=INT([Date] – TODAY()
Relative Date=IF([Relative Date Offset]=0
, "Today"
, "Today " & IF([Relative Date Offset]>0, "+", "") & [Relative Date Offset])
This will enable me to show data for the last day
I also did the same for days of the week
DayOfWeek = CONCATENATE(WEEKDAY('Info AgentJobDetail'[LastRunTime],2),FORMAT('InfoAgentJobDetail'[LastRunTime]," -dddd"))Because I struggled to show the information about the Operating system I also created two columns for OS name and OS edition by adding columns as shown below
Operating System Version = SWITCH('Info ServerOSInfo'[OperatingSystem], "Microsoft Windows Server 2012 Datacenter", "Server 2012",
"Microsoft Windows Server 2012 Standard","Server 2012",
"Microsoft Windows Server 2012 R2 Datacenter", "Server 2012 R2",
"Microsoft Windows Server 2008 R2 Standard", "Server 2008 R2",
"Microsoft Windows Server 2008 R2", "Server 2008 R2",
"Microsoft Windows Server 2008 R2 Enterprise", "Server 2008 R2",
"Microsoft® Windows Server® 2008 Standard", "Server 2008",
"Microsoft® Windows Server® 2008 Enterprise","Server 2008",
"Microsoft(R) Windows(R) Server 2003, Standard Edition", "Server 2003",
"Microsoft(R) Windows(R) Server 2003, Enterprise Edition", "Server 2003",
"Microsoft Windows 2000 Server", "Server 2000",
"Unknown")
And
Operating System Edition = SWITCH('Info ServerOSInfo'[OperatingSystem], "Microsoft Windows Server 2012 Datacenter", "DataCenter",
"Microsoft Windows Server 2012 Standard","Standard",
"Microsoft Windows Server 2012 R2 Datacenter", "DataCenter",
"Microsoft Windows Server 2008 R2 Standard", "Standard",
"Microsoft Windows Server 2008 R2 Enterprise", "Enterprise",
"Microsoft® Windows Server® 2008 Standard", "Standard",
"Microsoft® Windows Server® 2008 Enterprise","Enterprise",
"Microsoft(R) Windows(R) Server 2003, Standard Edition", "Standard",
"Microsoft(R) Windows(R) Server 2003, Enterprise Edition", "Enterprise",
"Microsoft Windows 2000 Server", "Server 2000",
"Unknown")
Then I started to play with the data.
This is probably not how a professional would phrase it but I would say that if you don’t know how to use a new application be brave and give it a try.
| OBVIOUSLY you are a PROFESSIONAL DBA and will not do anything that would endanger production, use a backup of your database and work locally if you need to. |
The first thing I wanted to know was how many servers I had by operating system, how many by SQL version and the location of them so that I could answer the questions I had been asked. I had already written a query to get the correct information to give to the requestors so I knew the correct answers which was also an advantage. I did this like this
I expanded the Info ServerOSInfo query and dragged the ServerName field to the report which created a table of names

I then changed the ServerName values to Count

I then dragged the calculated column Operating System Version to the table

If I click on the table and then donut chart in the visualisations it changes to

So you can quickly see how you want the data displayed
I then decided to look at the number of SQL 2005 instances that I had and as I had relationships between SQLInfo and Instancelist and Clients I could build a more dynamic report.
I created a donut chart with SQLVersion as the legend and InstanceID as the values and a table of SQLVersion, ServerName and Instance Name. I also created a card that was count of InstanceID

Now it starts getting really useful. If I want to know how many SQL 2005 instances I have I simply click on SQL2005 in the donut chart and the rest of the report changes

This is very cool and I hope you can see how useful this could be and how brilliant it would be to enable relevant people within the organisation the ability to look at that report and answer their own questions.
Lets take it to the next step. I have a location column in the InstanceList table which comprises of town names. If I choose a map and drag that column to the Location field and set Values and Color Saturation to the Count of InstanceID

and create two tables one of client with a count of instanceid and one location with a count of instance id I can do this

Look at how it dynamically changes as you click on the data labels – This is very cool and makes me smile every time!! I altered the colour saturation colours to make it easier to see. Now if I am asked about SQL 2005 servers I can quickly click on SQL 2005 and
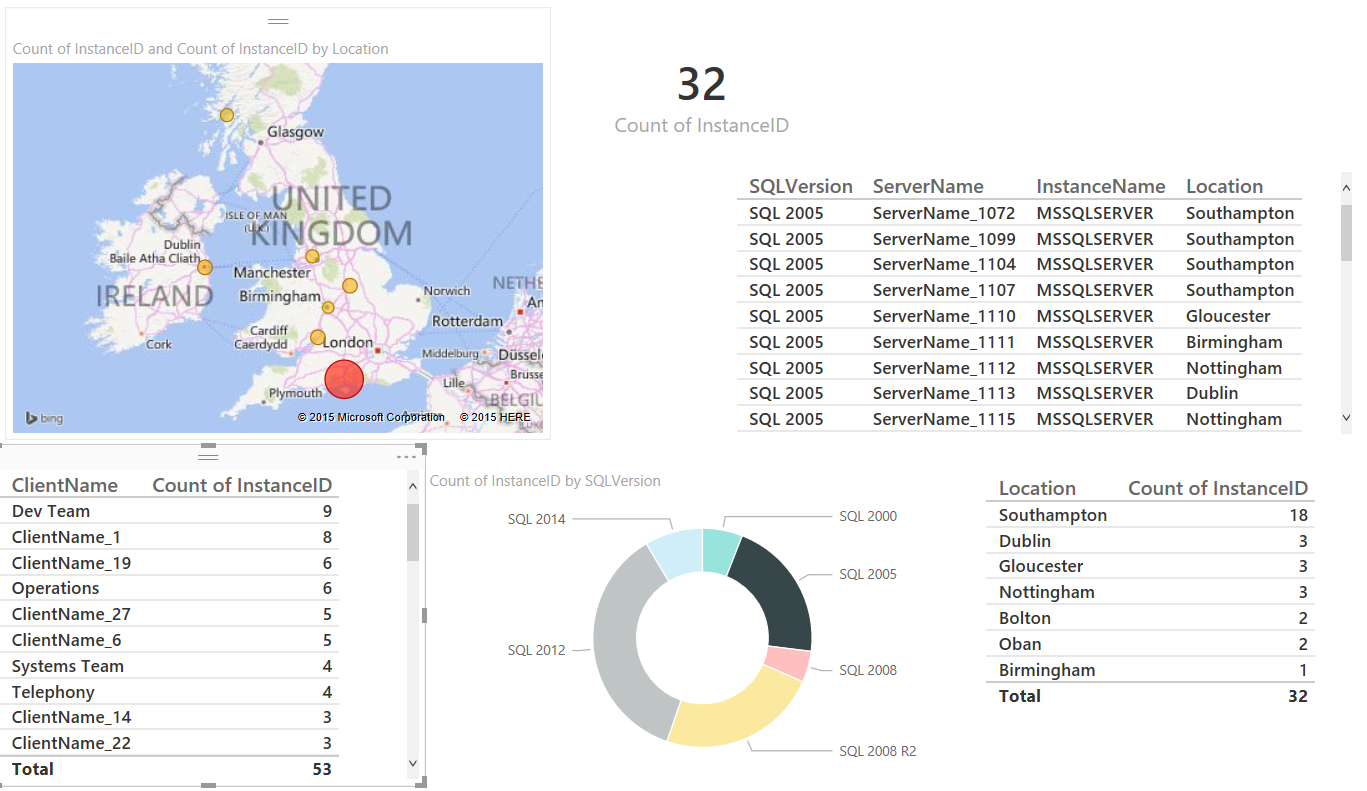
I can see that there are 32 instances, most are in Southampton, and which clients they support
If I click a location rather than SQL version the report alters like so

So you can simply pass the report file to your colleagues to enable them to use it or you can publish it to Powerbi.com. I am not going to go into any detail about the costs or licensing etc I will just say it is as easy as clicking publish. If you wish to have the information automatically refreshed there are some more steps that you would need to go through which are detailed here which enable you to connect your on-premise database to Powerbi using the data management gateway, alternatively you can simply refresh the data in the report and then publish it and replace the existing report.
Once the report is in powerbi.com you can enable Q and A on the data. This is some kind of supernatural mystical magical query language which enables you to query your data with natural language and will alter the results as you type and even cope with (deliberate for screenshot) spelling mistakes 🙂

I also created a report for my Agent Jobs to enable me to quickly and easily see which Jobs have failed in the last day

I did this by filtering the report by Relative Date Offset greater than -1 (today) and isenabled = True and Outcome = Failed
There are many many more ways I can see this being useful and I hope I have given you some ideas and encouraged you to try for yourself and find out more
I have written further posts about this
Populating My DBA Database for Power Bi with PowerShell – Server Info
Populating My DBA Database for Power Bi with PowerShell – SQL Info
Populating My DBA Database for Power Bi with PowerShell – Databases
Power Bi, PowerShell and SQL Agent Jobs

![]()
