


This month’s TSQL Tuesday post is from one of my favorite people in the community – Jorge Segarra a.k.a. SQL Chicken. It is an invite to play with a new and shiny toy – Power BI. Now – like most people, my initial reaction was like ‘naaah, am not a BI person!’. I dread TSQL Tuesdays that leave me staring at a wall wondering what to write, and there have been a few of them. Certain features are not easy to try in a test lab environment – and work environments do not always lend themselves to that flexibility. But this seemed like something very easy to install and play with, on one’s own desktop.
After some hiccups with email and such which Jorge helped me resolve – (details on how to download the tool are in his post) I got the tool installed very easily. I considered various test data to play with it – felt it would be fun to use data accumulated over our sql saturdays at Louisville, which I have been the lead organizer for. We have had 8 events to date, but only 5 are available as history on website. But this was information enough. I pulled the reports on attendee registration going back five years from the sql saturday website, saved them as excel files, removed attendee personal information, and consolidated all of it into one CSV file. I learned later that you can actually do some data scrubbing within PowerBI itself but this was something I did outside and was ready with.
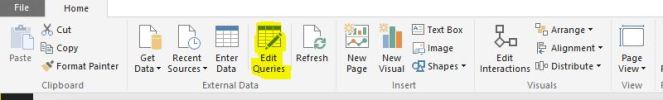
I launched the PowerBI desktop – pointed to my csv file as data source, and bingo, I was ready to go. The reports I needed were not raw data from the file – needed some grouping and consolidation – so I clicked on new query – which by default will bring up your raw data for you. In my case I needed the data to be grouped in several ways for my reports.Details of grouping are as below.
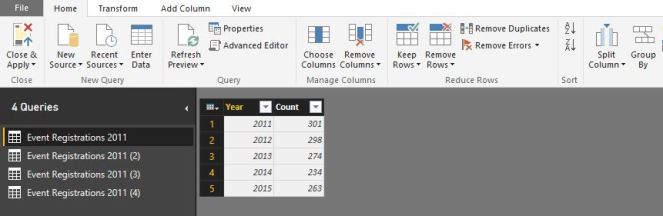
I created 4 queries – one each for each of my reports.
1 Query 1 – really simple, year wise grouping of attendee count.
2 Query 2 – two levels of grouping – year, meal preferences, count of people with those preferences.
3 Query 3 – two levels of grouping- year, opt in choice for emails, count for opt in choices.
4 Query 4 – two levels of grouping – year, state attendee is from, count of attendees. Here I had to filter out some junk data for name of state – and consolidate some verbage, like KY=Kentucky and so on.
When I was done the list of my data sources looked like below.
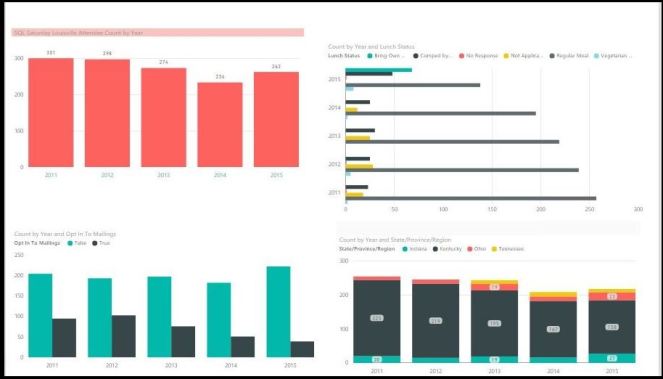
Now with my data ready, I launched into getting my reports up. I used each data source from above list for each graph (you can also use multiple but wanted to keep this simple).
The interactive graph can be viewed with better fonts here
Based on above graphs I was able to draw following conclusions:
1 First bar graph on the top left: Attendee by year: Our highest turnout was in 2011 (301) in the past five years. Hope to beat that record in 2016! Last year was 263 people.
2 Second horizontal bar on the right: Food payment preferences by year: A lot more people opted to bring their own lunch last year – this may be because we hiked the lunch fee to 10$ after several years (yeah Kentucky:)) . There are more people being comped as well due to higher number of sponsors and volunteers, which is not a bad thing. It would be interesting to see how this graph changes this year, because we provided a fantastic BBQ lunch last year. We have also hiked lunch fee from 10-12$ so it could go either way.
3 First bar graph on bottom left: Optin attendees over years: People who have opted out from vendor emails has gone up and was highest last year.We need to work harder on getting more people to opt-in as this means lesser reach for vendors.
4 Last graph bottom right: Attendee count by state: Looks like we did not have significant people from TN until 2013…(I filtered out #s less than 10 for this graph as we are not interested in 1 or 2 random attendees from other states). Our largest # of people are from KY, which is no surprise at all..but what was surprising to me for sure was that IN and OH both had around similar number of people.We did have several speakers from OH – but not 23, and there are certainly more people coming in from there. This shows that we have to promote our event harder in OH, as well as work on getting more people from TN, another border state.
All said and done, I had an absolute ball doing this. Not only is it easy and convenient to use but comes in handy for a variety of different things, including analysing personal finances and such. I highly recommend it!

![]()
