

In a previous post I explained the basics of probability. In this post I will use some of those principles to see how to solve certain problems. I will pick a very simple problem that I found in a statistics textbook. Suppose I have 7 friends who are smokers. The probability that a random smoker will develop a lung condition is 0.3. What is the probability that a maximum of 2 of them will develop a severe lung condition? To apply the binomial formula for this problem – I need the following conditions to be met:
1 The trials are independent
2 The number of trials, n is fixed.
3 Each trial outcome can be a success or a failure
4 The probability of success in each case is the same.
Applying these rules –
1 The 7 smoking friends are not related or from the same group. (This is important as one friend’s habits can influence another and that does not make for an independent trial).
2 They smoke approximately at the same rate.
3 Either they get a lung disease or they don’t. We are not considering other issues they may have because of smoking.
4 Since all these conditions are met, the probability of each of them getting a lung disease is more or less the same.
The binomial formula given that
x = total number of “successes” (pass or fail, heads or tails etc.)
P = probability of a success on an individual trial
n = number of trials
q= 1 – p – is as below:

For those not math savvy the ! stands for factorial of a number. In above example n equals 7. x, The number of ‘successes’ (morbid, i know, to define a lung condition as a success but just an example) we are looking for is 2. p is given to be 0. and q is 1 – 0.3 which is 0.7. Now, given the rules of probability – we need to add probability of 0 or none having a lung condition, 1 person having a lung condition and 2 having a lung condition – to see what is the probability of a maximum of 2 having a lung condition. Let us look at doing this with T-SQL first, then with R and then calling the R script from within T-SQL.
1 Using T-SQL:
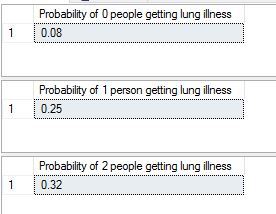
There are a lot of different ways to write the simple code of calculating factorial. I found this one to be most handy and reused it. I created the user defined function as ‘factorial’ and used the same code below to calculate probabilities of 0.1 or 2 people getting a lung illness. If we add the 3 together we get the total probability of the maximum of 2 people getting a lung illness – which is about 0.65 or 65 %.
DECLARE @n decimal(10,2), @x decimal(10, 2), @p decimal(10, 2), @q decimal(10, 2)
DECLARE @p0 decimal(10, 2), @p1 decimal(10, 2), @p2 decimal(10, 2), @n1 decimal(10, 2), @n2 decimal(10, 2), @n3 decimal(10, 2)
SELECT @n = 7, @x = 0, @p = 0.3,@q=0.7
SELECT @x = 0
SELECT @n1 = dbo.factorial(@n)
SELECT @n2 = dbo.factorial(@n-@x)
SELECT @n3 = 1

SELECT @p1 = ( @n1/(@n2 * @n3))*power(@p, @x)*power(@q,@n-@x)
select @p1 as 'Probability of 0 people getting lung illness'

SELECT @x = 1
SELECT @p1 = ( @n/@x)*power(@p, @x)*power(@q,@n-@x)
select @p1 as 'Probability of 1 person getting lung illness'

SELECT @x = 2
SELECT @n1 = dbo.factorial(@n)
SELECT @n2 = dbo.factorial(@n-@x)
SELECT @n3 = dbo.factorial(@x)
SELECT @p2 = ( @n1/(@n2 * @n3))*power(@p, @x)*power(@q,@n-@x)
select @p2 as 'Probability of 2 people getting lung illness'
Results are as below:
2 Using R:
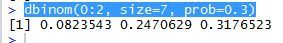
The R function for this is seriously simple, one line call as below.
dbinom(0:2, size=7, prob=0.3)
My results, almost exactly the same as what we got with T-SQL.
3 Calling R from T-SQL:
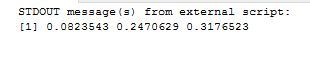
Instead of writing all that code i can simply call this function from with TSQL –
EXEC sp_execute_external_script
 @language = N'R'
 ,@script = N'x<-dbinom(0:2, size=7, prob=0.3);
 print(x);'
 ,@input_data_1 = N'SELECT 1;'
Results as below:
It is a LOT of fun to get our numbers to tie in more than one way. Thanks for reading.

![]()
