

I found a bug where I’m seeing TempDB use more memory than it should on multiple versions of SQL Server, especially on servers set up with common best practices. There’s a workaround that has a profound affect on server performance, adding to my belief that this is a legitimate bug and leading me to open a Connect Item on the issue.
Querying the Buffer Pool
I have a query to show me what’s in the buffer pool for the entire server, showing the expected results as well as excessive space being used by TempDB. The newest version showing these details is on my post Querying the Buffer Pool.
It shows number of pages in the buffer pool grouped by the database, table, and index. The query makes use of left joins so it can see space in memory that’s not currently allocated to a specific object.
The results are surprising in many ways.
The good surprises are seeing what indexes are hogging up your buffer pool so you have an idea of where to start tuning. I’m a huge fan of this and have blogged about it in Cleaning Up the Buffer Pool to Increase PLE, although the name of my older post is misleading because it does more than just help memory management in SQL Server.
The Bug
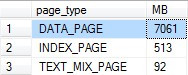
The bad surprise was a bug which has been harassing me for quite some time now. As I mentioned, the query will return all the space in the buffer pool, specifically the contents of sys.dm_os_buffer_descriptors, and does a left join to the tables leading up to and including sys.indexes so space not currently allocated to a table will show up. The problem is that the space that shows up as unallocated for TempDB is much larger than expected, in this case taking up 1/3 of my buffer pool.
![]()
On this post I’m talking about a single server, but the problem wasn’t limited to a single server. It showed up at the same time, caused by the same change (implementing a common best practice), partially resolved by the same partial rollback (undoing the best practice) on SQL 2008 R2, SQL 2012, and SQL 2014.
Details About the Bug
So the query I have on yesterday’s post, Querying the Buffer Pool, showed I had unallocated space in TempDB in memory, and a lot of it. However, it doesn’t show details.
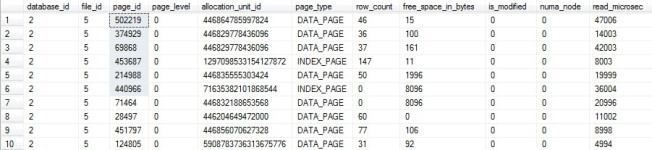
To start looking at the details, what kind of pages are these that exist in sys.dm_os_buffer_descriptors, but not in sys.allocation_units?
SELECT bd.page_type
, MB = count(1) / 128
FROM sys.dm_os_buffer_descriptors bd
LEFT JOIN sys.allocation_units au ON bd.allocation_unit_id = au.allocation_unit_id
WHERE bd.database_id = 2 --TempDB
AND bd.is_modified = 0 --Let's not play dirty, only clean pages
AND au.allocation_unit_id IS NULL --It's not even allocated
GROUP BY bd.page_type
ORDER BY 2 DESC
Ok, so we’re dealing with typical data in TempDB. Well, other than it not being allocated, of course.
So I run another query to get more details. This time I want to look inside the pages to see if they tell a different story.
SELECT TOP 100 bd.*
FROM sys.dm_os_buffer_descriptors bd
LEFT JOIN sys.allocation_units au ON bd.allocation_unit_id = au.allocation_unit_id
WHERE bd.database_id = 2 --TempDB
AND bd.is_modified = 0 --Let's not play dirty, only clean pages
AND au.allocation_unit_id IS NULL --It's not even allocated
Then I follow that up with Paul Randal’s How to use DBCC PAGE, which comes with all the disclaimers about using an undocumented and unsupported trace flag and command. This one isn’t horrible in my mind or Paul’s comments, but remember the undocumented and unsupported parts.
DBCC TRACEON (3604);

DBCC PAGE (2, 5, 502219, 0)
DBCC PAGE (2, 5, 374929, 0)
DBCC PAGE (2, 5, 69868, 0)
DBCC PAGE (2, 5, 453687, 0)
DBCC PAGE (2, 5, 214988, 0)
DBCC PAGE (2, 5, 440966, 0)

DBCC TRACEOFF (3604);
The results all looked about the same to me.
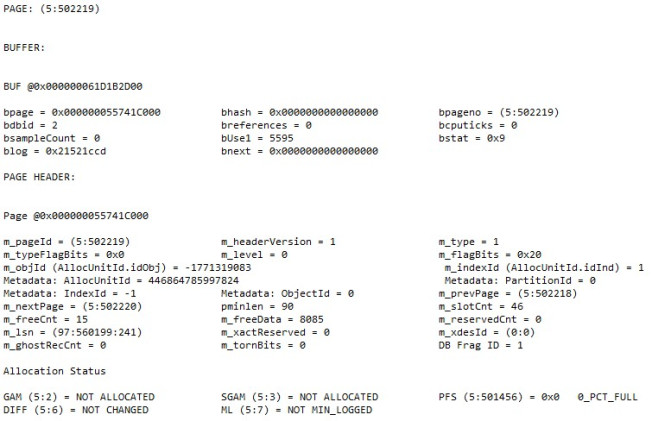
There are several important parts to me. The m_objId is a negative value I can’t find in TempDB.sys.objects, so it WAS a temporary object that no longer exists. Across the board, these are “NOT ALLOCATED”, “NOT CHANGED”, “NOT MIN_LOGGED”, “0_PCT_FULL”, so there’s nothing there.
To me it looks like temp objects made it into memory and remained in memory after the temporary objects were dropped. I have no idea what objects these were or how they were dropped, but I’m imagining these were temp tables automatically dropped when the session was either closed or reset.
A Recent Change (A CLUE)
I found this by noticing that PLE for several servers was lower now than it has been in the past, so I was peeking in the buffer pool to see who was playing nice. Going off of “when did PLE start to be lower” I noticed that I implemented a change around that time to use a common best practice.
That change was presizing TempDB data files to take up a vast majority of the dedicated LUN instead of letting them grow as needed. It avoids waiting for file growth, especially if you’re using TDE (I’m not) and can’t use IFI (I can), but for several other reasons as well, including file fragmentation and the slight pause even IFI causes. So at the start of all these festivities, I took the 4 TempDB data files from 100 MB each to 12 GB each, using up 48 GB of the 50 GB available.
A Workaround
Seeing this, I wanted to partially roll back the change the next opportunity I had. 100 MB was too small and I was aware that it invoked file growths every month (we reboot monthly for OS updates). 48 GB wasn’t right though, we just have that much space on the drive due to server build standards and paranoia (I’m a DBA). So I went through our Idera Diagnostic Manager monitoring software and found the most space TempDB used, which is captured once an hour. I found that 4.8 GB was the peak usage with several incidents of usage going over 4.5 GB.
With that information available and still not wanting an autogrowth for all the reasons listed above, I decided that all 4 files should be 1.5 GB, so 6 GB total. That means peak usage was about 75% full, leaving plenty of room for error, especially with my baseline only being captured once an hour. Autogrowth is set to 256 MB, so it’d add 1 GB total each growth. I can live with that.
I can’t say it eliminated the issue because I still have 2 GB of unallocated TempDB space in cache, but it’s better than 8 GB. It can be considered more acceptable than other issues I need to tackle right now, but it still bugs me.
What’s the Best Practice?
It’s a best practice to have TempDB data files on their own LUN, drive, array, however you want to word it. Then it just make sense to have the total size of your data files add up to 90% or more of the drive size. I see this advice everywhere, with these two standing out:
- Solar Winds – Configuration Best Practices for SQL Server Tempdb–Initial Sizing
- “Next, if you can give tempdb its own disk, then configure it to almost fill the drive. If nothing else will ever be on the drive, then you’re better off setting it to be larger than you’ll ever need. There’s no performance penalty, and you’ll never have to worry about autogrow again.”
- Brent Ozar – SQL Server 2005/2008/2012/2014 Setup Checklist
- “Notice that I don’t have filegrowth enabled. You want to proactively create the TempDB files at their full sizes to avoid drive fragmentation.”
Jonathan Kehayias does it a little bit differently in his post SQL Server Installation Checklist saying to add space to TempDB files in 4 GB increments. Although he doesn’t fill the drive by default, this isn’t mentioned by him, either.
Now I need to be perfectly clear on this, I trust these three sources. I trust Jonathan and Brent more than I trust myself with setting up SQL Server. I also feel the same about the authors I know on the Solar Winds post. This does not change that.
Sizing TempDB like that often means it’s much larger than you need. The workaround I’m using is to right-size these files instead. For me, for now, I’m going to stick with seeing how large TempDB gets and make it slightly larger than that until I have a solid answer to my problem.
What Was It?
I still don’t know. The workaround managed to knock it off of my priority list enough where I’m not actively working on it. However, my drive to understand SQL Server better won’t leave me alone.
This post is my solution. I have some very intelligent people reading this who I hope will at least lead me further down the rabbit hole, even if they don’t have a conclusive answer. There’s a good chance I’ll be asking for help on Twitter with #sqlhelp or opening a connect item on this, for which I have a very well documented description of the issue that I can link to.
Updates:
2016-01-06 – Caching of Temporary Objects
Due to a comment, I started looking into the caching of temporary objects to see if this was the root cause. The comment specifically mentioned Paul White’s (b|t) post Temporary Object Caching Explained, and I also read over Itzik Ben-Gan’s (b|t) post Caching Temporary Objects.
Both of these left me with the impression that smaller amounts of data would be left in the cache linked to temporary objects linked to the proc cache. What I’m seeing is large amounts of data in the buffer pool that did not drop when I ran DBCC FREEPROCCACHE (on a test server that wasn’t in active use) as I expected if this was the full explanation.
While it’s very likely this is related to the issue on hand, I’m not ready to accept it as a full explanation. If the memory associated with TempDB dropped when clearing the proc cache (on a test server) then it would have been a great explanation with a poor side effect of going too far with the memory being used.
2016-01-07 – Opened a Connect Item
I mentioned this issue on the comments of Paul White’s blog post mentioned in the last update and comments below on this post. His response concluded with this:
So, when memory pressure is detected, I would expect memory use like this to be freed up for reuse in pretty short order, by design. If it is not, and bad things happen because memory for unallocated tempdb is not released/reused, that would be a bug.
While I was already leaning that way, it pushed me over the edge to decided it was time to open up a connect item on this issue. I feel it’s well worth the read going to Paul’s post and the connect item. Also, if you’re seeing this as well, an upvote on connect is very appreciated.
https://connect.microsoft.com/SQLServer/feedback/details/2215297

![]()
