

Reading the new features for SQL 2019 I spotted this: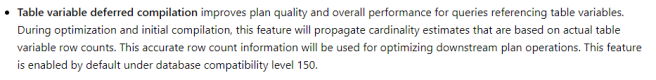
One of the most popular posts on my blog last year was where I pretty much suggested that people not use table variables:
Think twice before using table variables
This wasn’t new information when I wrote it, but bad performance due to the use of table variables remained such a common anti-pattern that I thought it was worth stressing again.
So, when I saw the above 2019 feature I thought I’d better investigate and update what I’m telling people.
TL;DR It looks like table variables are no longer a problem.
I’m going to re-use my examples from the previous post (as well as some of the images captured). One thing to note though it that I’m running these tests on a different, much less performant box than I did last time, so execution times will be longer.
My first test last time was just to show how cardinality estimation was better for a temp table vs. a table variable. This time I’m just going to compare a table variable running under compatibility mode 140 (SQL 2017) with one running under compatibility mode 150 (SQL 2019).
I set the compatibility mode as follows:
ALTER DATABASE AdventureWorks2012 SET COMPATIBILITY_LEVEL = 140;
Then I run the first query:
DECLARE @a TABLE(i INT);

--Create a million rows
WITH Nums(i) AS
(
       SELECT 1
       FROM (VALUES (1),(1),(1),(1),(1),(1),(1),(1),(1),(1)) n(i)
)
INSERT INTO @a(i)
SELECT n1.i
FROM Nums n1
CROSS JOIN Nums n2
CROSS JOIN Nums n3
CROSS JOIN Nums n4
CROSS JOIN Nums n5
CROSS JOIN Nums n6;

SELECT i FROM @a;
The execution plan for that final select looks like this:
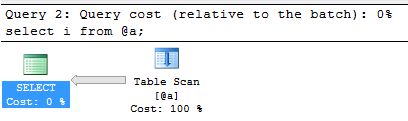
And when I hover over the Table Scan operator I can see the properties:
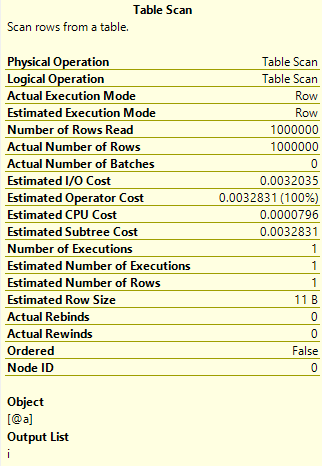
You can see that the estimated number of rows is calculated as 1 – but the actual number of rows was 1 million. This is (was) the problem with table variables.
Now I’ll change the compatibility level:
ALTER DATABASE AdventureWorks2012 SET COMPATIBILITY_LEVEL = 150;
And run the query again.
I get the same execution plan, so let’s just look at the properties of the Table Scan operator this time:
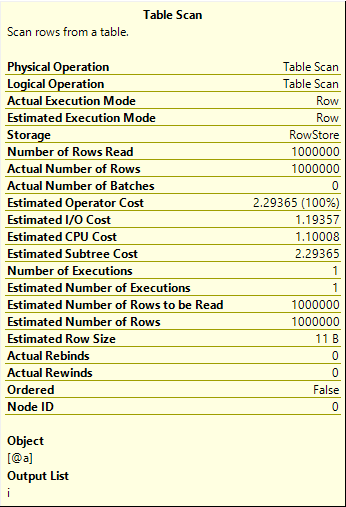
Here you can see that the estimation is correct, 1 million. This is looking good so far for the future of table variables.
In the last post I then looked at a case where the bad estimation caused a poor selection of execution plan so let’s repeat that test. First, I set my compatibility level back to 140, then I run the following (if you want to repeat, you need the AdventureWorks2012 database):
DECLARE @BusinessEntityId TABLE (BusinessEntityID INT NOT NULL PRIMARY KEY CLUSTERED);

INSERT INTO @BusinessEntityId
SELECT BusinessEntityID FROM Person.Person;

SET STATISTICS IO ON;
SET STATISTICS TIME ON;

SELECT COUNT(*)
FROM @BusinessEntityId b
INNER JOIN Person.Person p
       ON b.BusinessEntityID = p.BusinessEntityID;

SET STATISTICS IO OFF;
SET STATISTICS TIME OFF;
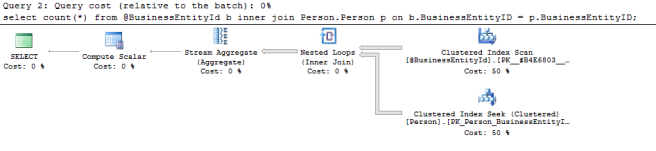
Let’s look at the execution plan for the final query:
Now let’s look at the properties for the clustered index scan:
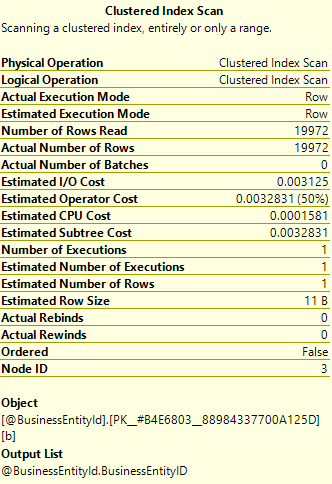
We can see that estimated number of rows is just 1, but that the actual number of rows is 19,972.
If we then look at the properties for the Index seek operator:
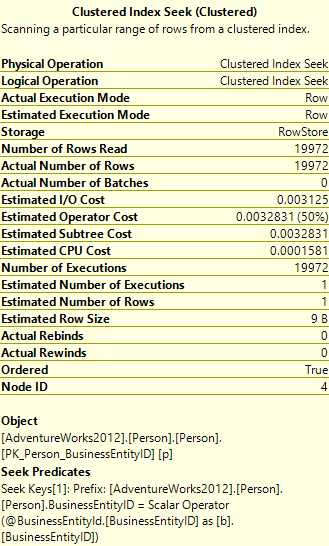
We can see that the estimated number of executions was 1, but the actual number of executions was 19,972. That’s 19,972 seeks into a table with 19,972 rows. As previously discussed – there’s got to be a better way. A Nested Loops join is generally best when there’s a small number of rows from the top table, and a larger amount of rows from the bottom. In this place they both have 19,972 so it’s not optimal.
Here’s the output of the statistics commands for that query:
Table ‘Person’. Scan count 0, logical reads 59916, physical reads 3810, read-ahead reads 0, lob logical reads 0, lob physical reads 0, lob read-ahead reads 0.
Table ‘#B5D4D4C8’. Scan count 1, logical reads 35, physical reads 29, read-ahead reads 28, lob logical reads 0, lob physical reads 0, lob read-ahead reads 0.
SQL Server Execution Times:
CPU time = 47 ms, elapsed time = 30951 ms.
Now we’ll change the compatibility level to 150 and try again. Here’s the execution plan we get this time:
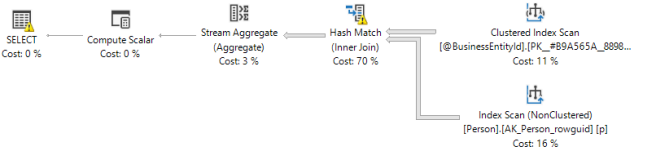
You can see the join operator is now a Hash Match which is generally a much better choice for evenly sized tables. Let’s look at the properties of the Clustered Index Scan in this new plan:
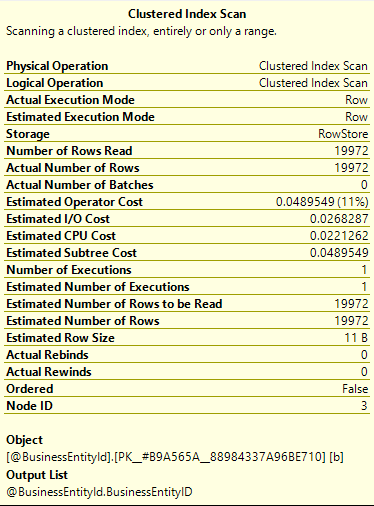
This time the estimated and actual values match, which has enabled SQL to make the better choice of plan. We can see that if we look at the statistics output for this one:
Table ‘Workfile’. Scan count 4, logical reads 64, physical reads 0, read-ahead reads 64, lob logical reads 0, lob physical reads 0, lob read-ahead reads 0.
Table ‘Worktable’. Scan count 0, logical reads 0, physical reads 0, read-ahead reads 0, lob logical reads 0, lob physical reads 0, lob read-ahead reads 0.
Table ‘Person’. Scan count 1, logical reads 67, physical reads 1, read-ahead reads 65, lob logical reads 0, lob physical reads 0, lob read-ahead reads 0.
Table ‘#B9A565AC’. Scan count 1, logical reads 35, physical reads 0, read-ahead reads 0, lob logical reads 0, lob physical reads 0, lob read-ahead reads 0.
SQL Server Execution Times:
CPU time = 0 ms, elapsed time = 25220 ms.
You can see the CPU and reads are massively reduced.
So, it seems table variables aren’t so bad anymore. At least they won’t be once you are running SQL Server 2019.
I should probably add some caveats at this point. This has been a limited test, so you yourselves should make sure you test your own performance if you start using table variables instead of temp tables. There are also going to be deferred compilations when you do this in stored procedures. I haven’t dug down into exactly how that will work with table variables, but I guess it’s going to be similar to the way temp tables work in existing SQL versions.
