There’s two fairly common questions I see on the forums around SQL Server’s memory usage. Either the question asks why SQL’s using too much memory, or why it’s using too little.
Too much memory isn’t usually a real problem, it’s often due to max server memory being left at its default of 2048TB, along with a lack of understanding of how SQL uses memory.
Too little memory used is also often not a real problem, rather it’s usually from using the wrong tools to check SQL Server’s memory usage.
Let’s start by looking at an example.
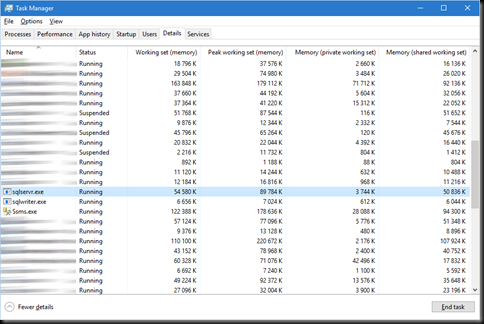
This particular server has 16 GB of memory, and SQL Server’s max server memory is set to 10GB. Since the last restart of the instance, I’ve run SELECT * FROM .. against every table in a 30GB database. That should have warmed the cache up nicely.
Err, what? SQL Server’s not even using 100MB? I’ve just read 30GB of data and SQL Server’s not even using 1% of it’s allowed memory!!!
Or is it?
A look at perfmon shows a completely different picture. Total and target server memory are both at 10GB. So why is Task Manager showing such a low figure?
The service account that SQL’s running under has been granted the Lock Pages in Memory permission. This means that SQL’s not using the normal Windows memory routines to allocate memory.
Normally, SQL Server and other Windows applications allocate memory using the VirtualAlloc API call. This allocates virtual memory which is pageable. When SQL Server has been given the Lock Pages in Memory permission, it doesn’t use VirtualAlloc to allocate memory. Instead it uses the API call AllocateUserPhysicalPages. Memory allocated with this API call is not pageable, it has to remain in physical memory.
Task Manager’s memory counters (the Working Set ones) only show memory that’s been allocated using VirtualAlloc. Hence, when SQL Server has the Lock Pages in Memory permission and is allocating most of its memory using AllocateUserPhysicalPages, its memory usage in Task Manager will appear to be extraordinarily low. As far as I recall, in that case it’s only the non-buffer memory which is still allocated with VirtualAlloc, and that’s just things like the thread stacks, the CLR memory, backup buffers, and similar. It’s not the buffer pool. The buffer pool gets allocated with AllocateUserPhysicalPages.
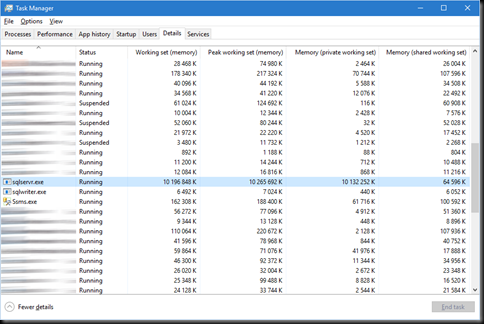
If I remove the Lock Pages in Memory and re-run the test, Task Manager shows completely different values
Now the buffer pool is being allocated with VirtualAlloc and so Task Manager shows the full 10GB of memory usage.
In summary, Task Manager can show a completely incorrect value for SQL Server’s memory usage if the SQL service account has the Lock Pages in Memory permission. This can lead to a lot of wasted time if it is concluded that Task Manager is correct and SQL Server is using little memory.
Rather leave Task Manager alone and use perfmon and the DMVs to check what SQL Server’s memory allocation actually is. They’ll both be correct whether Lock Pages are being used or not.


