

In this post I will attempt to explore calculation of a very basic statistic based on linear relationship between two variables. That is, a number that tells you if two numeric variables in a dataset are possibly correlated and if yes, by what degree. The Pearson’s coefficient is a number that attempts to measure this relationship.
The dataset I am using for this is downloaded from here. It is a dataset related to gender development index from various parts of the world. I am not using all the variables here. I am only attempting to examine if there is a correlation between average number of years in school, and gross national income, for women. Or in other words – Do women stay longer or shorter in schools because of income reasons? One important thing to be aware as we study this – is that correlation does not mean causation. By that – if I find a correlation between number of years women spend in school and the income, does not really mean the two are directly related. There may be many other factors influencing this relationship – or, after studying all the other factors we may very well conclude that there is not a significant relationship one way or the other. But, it is a starting point to see if there is any correlation between these two variables across countries.
The statistical definition of Pearson’s R Coefficient, as it is called, can be found in detail here for those interested. A value of 1 indicates that there is a strong positive correlation(the two variables in question increase together), 0 indicates no correlation between them, and -1 indicates a strong negative correlation (the two variables decrease together). But you rarely get a perfect -1, 0 or 1. Most values are fractional and interpreted as follows:
High correlation: .5 to 1.0 or -0.5 to 1.0.
Medium correlation: .3 to .5 or -0.3 to .5.
Low correlation: .1 to .3 or -0.1 to -0.3.
Now, let us look at calculation this value for the two variables we have chosen using R, then T-SQL and then R script within T-SQL.
Using R:
install.packages(“RODBC”)
library(RODBC)
mydata <- sqlQuery(cn, ‘select [FemaleMeanYearsofSchooling2014],
[GNAPerCapitaWomen2014]
FROM [WorldHealth].[dbo].[GenderDevelopmentIndex] WHERE [femalemeanyearsofschooling2014] >0 ‘)
cor(mydata)
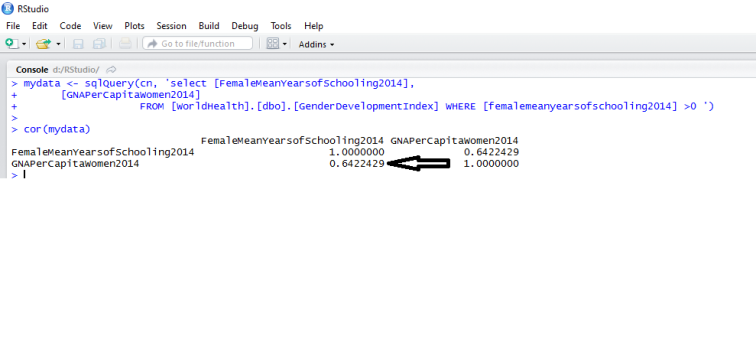
R creates a matrix out the two columns of data and correlates it four ways. I have only highlighted what is relevant to us – a value of 0.64, which suggests a moderately strong correlation.
The same calculation can be done with T-SQL. It is not as simple or elegant as it is in R, but it is very doable. To understand the formula read here. Although it is very possible to do this in one step, I have broken it up into 4 steps to help with clarity and understanding.
TSQL Code:
DECLARE @PART1 FLOAT, @PART2 FLOAT, @PART3 FLOAT, @PART4 FLOAT
SELECT @PART1 = SUM([FemaleSchoolingyears2014]*[GNAPerCapitaWomen2014])
FROM [dbo].[GenderDevelopmentIndex] where [FemaleSchoolingyears2014] > 0
SELECT @PART2 = (SUM([FemaleSchoolingyears2014])*SUM([GNAPerCapitaWomen2014]))/count(*)
FROM [dbo].[GenderDevelopmentIndex] where [FemaleSchoolingyears2014] > 0
SELECT @PART3 = SQRT(SUM([FemaleSchoolingyears2014]*[FemaleSchoolingyears2014])
– (SUM([FemaleSchoolingyears2014])*SUM([FemaleSchoolingyears2014]))/count(*))
FROM [dbo].[GenderDevelopmentIndex] where [FemaleSchoolingyears2014] > 0
SELECT @PART4 = SQRT(SUM([GNAPerCapitaWomen2014]*[GNAPerCapitaWomen2014])
– (SUM([GNAPerCapitaWomen2014])*SUM([GNAPerCapitaWomen2014]))/count(*))
FROM [dbo].[GenderDevelopmentIndex] where [FemaleSchoolingyears2014] > 0
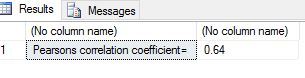
SELECT ‘Pearsons correlation coefficient=’,ROUND((@PART1-@PART2)/(@PART3*@PART4), 2)
The results I get are as below:
So far, in both cases the value is a good 0.64. Now , instead of performing all this math in T-SQL we can call the R function to do it in one line, within T-SQL.
R call from within T-SQL:
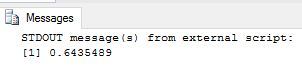
EXEC sp_execute_external_script
@language = N’R’
,@script = N’ cor <-cor(InputDataSet$FemaleMeanYearsofSchooling2014,InputDataSet$GNAPerCapitaWomen2014);
print(cor);’
,@input_data_1 = N’select FemaleMeanYearsofSchooling2014,GNAPerCapitaWomen2014 FROM [WorldHealth].[dbo].[GenderDevelopmentIndex] where [FemaleSchoolingyears2014] > 0
;’;
My results are as below:
As we can see, we got the same results in all 3 cases. The 0.64 correlation indicates the possibility of a moderately strong correlation between length of years women are in school and the GDP ratio of the country. It does not mean the GDP factor is the cause but merely a possibility. There is a old post authored by Joe Celko here that refers to the same calculation and can also help with conceptual understanding.
Thanks for reading.

![]()
