SQL’s auto-updating statistics go a fair way to making SQL Server a self-tuning database engine and in many cases they do a reasonably good job
However there’s one place where the statistics’ auto-update fails often and badly. That’s on the large table with an ascending column where the common queries are looking for the latest rows.
Let’s have a look at a common scenario.
We have a large table (imaginatively called ‘Transactions’) with a date time column (even more imaginatively called ‘TransactionDate’). This table gets about 80,000 new records a day and currently has around 8,000,000 records in it. So we can say roughly that another 1% is added to the table size daily. No records are updated and there’s a monthly purge of old data so that the total size remains about the same. A reasonably common real-life scenario.
CREATE TABLE Accounts (
AccountID INT IDENTITY PRIMARY KEY,
AccountNumber CHAR(8),
AccountType CHAR(2),
AccountHolder VARCHAR(50),
Filler CHAR(50) -- simulating other columns
)

CREATE TABLE Transactions (
TransactionID INT IDENTITY PRIMARY KEY NONCLUSTERED,
AccountID INT NOT NULL FOREIGN KEY REFERENCES Accounts (AccountID),
TransactionDate DATETIME NOT NULL DEFAULT GETDATE(),
TransactionType CHAR(2),
Amount NUMERIC(18,6),
Filler CHAR(150) -- Simulating other columns
)
GO
CREATE CLUSTERED INDEX idx_Transactions_TransactionDate
ON Transactions (TransactionDate)

CREATE NONCLUSTERED INDEX idx_Transactions_AccountID
ON Transactions (AccountID)

CREATE NONCLUSTERED INDEX idx_Accounts_AccountType
ON Accounts (AccountType)

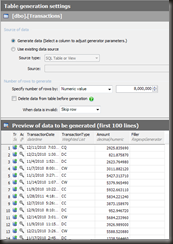
-- Using RedGate's SQLDataGenerator to generate some data for this.
Day 1 of the month, the indexes have just been rebuilt (after the data purge) and the statistics associated with those have been updated. The latest value in the TransactionDate column is ’2011/01/31′ and the last value in the statistics histogram is ’2011/01/31′. Life is good.
Day 2 of the month, there have been 80,000 new records added for the previous day. Only 1% of the table has been updated, so the automatic statistics update would not have triggered. The latest value in the TransactionDate column is ’2011/02/01′ and the last value in the statistics histogram is ’2011/01/31′. Doesn’t look like a problem.
Fast forwards another couple of days. Day 5 of the month. By this point 300,000 rows have been added since the beginning of the month. This amounts to around 5% of the table. Hence the statistics auto-update (triggered at 20%) still would not have run. The latest value in the TransactionDate column is ’2011/02/04′ and the last value in the statistics histogram is ’2011/01/31′. Starting to look less than ideal.
So, what kind of effect does this have on the queries against that table?
Let’s assume there’s an important query that runs every morning to calculate the totals for the previous three day’s transactions.
CREATE PROCEDURE AccountPositionSummary (
 @EffectiveDate DATE
)
AS
SELECT a.AccountNumber, a.AccountHolder, t.TransactionType, SUM(t.Amount) AS AccountPosition, CAST(TransactionDate AS DATE) AS EffectiveDate
 FROM dbo.Accounts a
 INNER JOIN dbo.Transactions t ON a.AccountID = t.AccountID
 WHERE t.TransactionDate >= @EffectiveDate
 GROUP BY a.AccountNumber, a.AccountHolder, t.TransactionType, CAST(t.TransactionDate AS DATE)
GO
Day 1 ( the 1st of Feb) the query is run over the records from the 29th January to the 31st. The stats histogram lists the 31st as the maximum value of the TransactionDate column (which it is) and so the optimiser is able to get a very accurate estimate of the rows affected.
The execution stats look pretty decent considering the amount of data in the table.
Table ‘Worktable’. Scan count 0, logical reads 0, physical reads 0.
Table ‘Transactions’. Scan count 1, logical reads 6329, physical reads 0.
Table ‘Accounts’. Scan count 1, logical reads 112, physical reads 0.
SQL Server Execution Times:
CPU time = 1076 ms, elapsed time = 2661 ms.
Day 2 (2nd Feb) the query is run over the records from the 30th January to the 1st Feb. The plan is unchanged and still fast, but there’s early warning signs of a problem
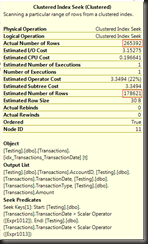
There’s a difference in the estimated and actual row counts, and not a small one. It’s not affecting the plan, yet, but there are several days still to go before the auto_update will kick in (at around 1% of the table modified each day, it’ll be about the 20th of the month before the auto update threshold is hit).
On Day 5, what does the plan look like?
Radically different. It’s worth noting that, because I’ve just been copying the previous day’s rows, the row count hasn’t changed at all, but we now have a nested loop join sitting in the middle. Nested loop joins do not work well with large numbers of rows in the outer table. Don’t be deceived by the narrow arrow leading to the nested loop. In the Management Studio display, the width can be defined by the estimated row counts (in this case 1), not the actual in some cases (note that the arrow in question doesn’t have an actual row count on it).
So have the execution stats changed?
Table ‘Accounts’. Scan count 0, logical reads 530784, physical reads 0.
Table ‘Transactions’. Scan count 1, logical reads 6358, physical reads 0.
SQL Server Execution Times:
CPU time = 2839 ms, elapsed time = 6746 ms.
Um yeah, just slightly.
What’s happening here is that, because the new rows are all at the end of the index, the stats histogram doesn’t just show a estimate lower than the actual rows (as would happen for new rows inserted across the range of the data), it indicates that there are absolutely no matching rows. The optimiser then generates a plan optimal for one row.
Ironically, an ascending column is considered a good choice for a clustered index because it reduces fragmentation and page splits. Combine that with a query that always looks for the latest values and it’s very easy to end up with a query that intermittently performs absolutely terribly with no easy-to-see cause.
The fix isn’t hard, a scheduled statistics update, maybe daily depending on when data is loaded and what the queries filter for, fixes this completely. The trick is often realising that it is necessary.
It is worth noting that the example I’ve contrived here is not an isolated example, and it’s on the low-end of the possible effects. At a previous job I saw a rather critical daily process that would go from around 30 minutes at the beginning of the month to several hours somewhere late in the second week of the month, because the stats on the datetime column indicated 0 rows, instead of the 5 million that the query would actually return.


